the Creative Commons Attribution 4.0 License.
the Creative Commons Attribution 4.0 License.
 | 27 Feb 2020
Determination of the mixing ratio of a flowing gas mixture with self-actuated microcantilevers
Jaqueline Stauffenberg
Steve Durstewitz
Martin Hofmann
Tzvetan Ivanov
Mathias Holz
Waleed Ehrhardt
Wolf-Ulrich Riegel
Jens-Peter Zöllner
Eberhard Manske
Ivo Rangelow
Microcantilevers offer a wide range of applications in sensor and measurement technology. In this work cantilever sensors are used as flow sensors. Most conventional flow sensors are often only calibrated for one type of gas and allow an analysis of gas mixtures only with increased effort. The sensor used here is a cantilever positioned vertically in the flow channel. It is possible to operate the sensor in dynamic and static mode. In the dynamic mode the cantilever is oscillating. Resonance frequency, resonance amplitude and phase are measured. In static mode, the bending of the cantilever is registered. The combination of the modes enables the different measured variables to be determined simultaneously. A flow influences the movement behaviour of the sensor, which allows the flow velocity to be deduced. In addition to determining the flow velocity, it is also possible to detect different types of gas. Each medium has certain properties (density and viscosity) which have different effects on the bending of the sensor. As a result, it is possible to measure the mixing ratio of a known binary gas mixture and their flow velocity simultaneously with a single sensor. In this paper this is investigated using the example of the air–carbon-dioxide mixture.


Microcantilevers form an important group among MEMS devices. They are free-standing beams a few micrometres in size that undergo changes in their mechanical behaviour as a result of the application of forces and mass deposits. They offer a wide spectrum for sensory tasks: scanning force sensors offering an atomic resolution (Rangelow et al., 2017), force and pressure sensors, acceleration sensors, mass sensors, temperature sensors, IR radiation sensors, bio- and chemical sensors, and flow sensors (Kumar et al., 2014; Steffanson et al., 2012; Waggoner et al., 2007), but also for so-called tip-based nanofabrication (Rangelow, 2006). Due to the possibility of producing these resonant MEMS sensors in extremely small spatial dimensions, they are able to detect forces in the nanonewton (nN) range, masses in the femtogram (fg) range and dimensions in the sub-nanometre (nm) range. For these microelectromechanical sensors, silicon is the dominant material. They are manufactured using processes that are equivalent to the process steps of micro- and nanoelectronics fabrication. Scientific interest lies in the investigation of vibrating microcantilevers in viscous media. These investigations are connected with atomic force microscopy and sensor technology with micromechanical oscillators. To describe the influence of the surrounding medium, the prediction of the forces acting on the oscillator is of crucial importance. This influence has been investigated in various studies (Sader, 1998; Hiroshi et al., 1995; Maali et al., 2005; Naeli et al., 2009). The emerging forces are described by the increase in mass caused by the moving fluid and the hydrodynamic damping. Both effects act as inertial and viscous forces on the movement of the body in the fluid. They are determined by the characteristic dimensions of the cantilever body and the thickness of the viscous boundary layer and cause a shift of the resonance frequency and the quality factor. In general, the problem of considering the aerodynamic forces on a vibrating cantilever is very complex because of the three-dimensional gas flow. The acting forces depend on the ratio of thickness to width of the plate, the size ratio of the oscillation amplitude to the characteristic plate dimension (KC, Keulegan–Carpenter number) and the frequency-dependent normalised Reynolds number (see Eq. 16) (Egorov et al., 2014). In Sader (1998), this problem was solved for a thin plate oscillating in a quiescent fluid with small amplitude, and the influence of the fluid on the resonance frequency and the quality factor was derived. Badarlis et al. (2015) used these relations to investigate the determination of the density and viscosity of different gases and binary gas mixtures by means of microcantilevers. But this measuring method was only investigated for measurements in quiescent gases. Hence, it should also be possible to use cantilever sensors to determine the mixing ratio of two known gases or to distinguish between different gases. In Zöllner et al. (2018) it was shown that the resonance behaviour (resonance frequency and resonance amplitude) and the static deflection of microcantilevers are influenced by the gas flow, and hence these influences can be used to measure the gas flow. This measuring principle depends on the type of gas. In order to be able to measure the flow of different gases and gas mixtures, calibration curves must be stored for the respective gases and mixtures and selected accordingly. A wrong selection would not be detected. This also applies to many commercial sensors. In Ejeian et al. (2019) different MEMS-based flow sensors can be found. These flow sensors can be categorised in general into three main types: thermal, piezoresistive and piezoelectric sensors. In our case, we use a microcantilever with integrated actuator and piezoresistive read-out.
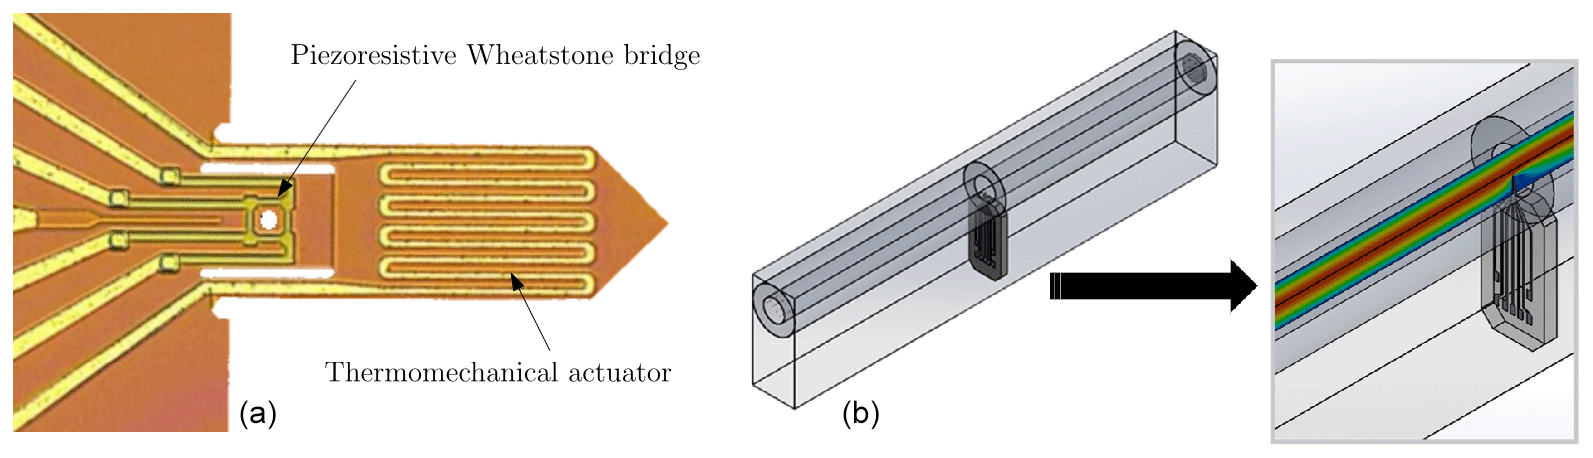
Figure 1Magnification of a cantilever sensor with a piezoresistive resistance bridge and a meander-shaped thermomechanical actuator (Rangelow et al., 2005) (a) and model of the measurement chamber with a flow channel of 1 mm diameter and cantilever sensors positioned vertically in the flow channel, in which the gas flow is illustrated (b).
In this work we investigate whether it is possible to detect gas type simultaneously to the flow measurement with a single cantilever sensor. Using the example of the air–carbon-dioxide mixture, this paper examines how the mixing ratio affects the cantilever behaviour at different flow velocities. This investigation is embedded in the development of a compact, autocalibrating, remotely interrogatable flow measurement system with gas type detection. Most flow sensors on the market are limited by the type of gas. If another gas medium is examined, recalibration is necessary for most sensors. For this reason, it is not possible to detect a gas composition or gas type in a gas mixture. Therefore the simultaneous determination of gas type and mass flow is connected with very high expenditure. With the sensors presented in this paper, it is possible to simultaneously determine the flow rate and the mixture fraction of a known gas mixture by measuring two quantities (resonance frequency and resonance amplitude) simultaneously with one sensor.
As sensor element we use a cantilever with a rectangular cross section (with length L, width W, thickness T, while ), which is placed crosswise to the gas flow in a round channel and is excited in the first resonance mode. To describe its behaviour we use the model of the simple harmonic oscillator.
with z the deflection, D the damping, m the mass of the cantilever and the moving fluid, ω0=2πf0 the resonance frequency of the cantilever in the fluid and the periodic excitation. Using the quality factor Q defined by
with the bandwidth Δf, the resonance frequency fres, the resonance amplitude and the phase shift φres can be expressed by
The approximations apply to Q≫1 and are applicable to the studies carried out in the context of this work. The total quality factor of the cantilever oscillating in a fluid under atmospheric pressure is determined by the individual quality factors of three dominant dissipative mechanisms (Naeli et al., 2009).
Qclamp is the quality factor for the energy loss at the clamping point (Hao et al., 2003), QTED is the quality factor for the thermoelastic damping (Zener, 1938) in the cantilever itself and Qfluid is the quality factor for the viscous dissipation by the surrounding fluid. For the cantilevers used in this work, the viscous damping dominates. The oscillation of the cantilever is subject to inertial and viscous forces of the surrounding gas. These forces depend on the dimensions of the cantilever, the properties of the gas and the thickness δ of the viscous boundary layer that forms around the body. Sader (1998) investigated the resonance behaviour of a cantilever oscillating in a quiescent viscous fluid and described the influence on the resonance frequency and the quality factor by means of a hydrodynamic function. Using the approximation of the hydrodynamic function of Maali et al. (2005) the resonance frequency can be described by
with the mass of the cantilever mcan and the moving mass of the fluid mfluid. For the natural eigenfrequencies,
applies. The cantilever mass is obtained from its mean density ϱ and the following dimensions:
The mass of the moving fluid is calculated as follows:
with ϱfluid the density of the gas, the constants a1=1.0553 and a2=3.7997 and the boundary layer thickness δ:
with ηfluid the dynamic viscosity of the gas. The resonance frequency of the cantilever in gas f0 is reduced in comparison to the resonance frequency in vacuum f0,vac by the added gas mass mfluid to the cantilever mass mcan. The added gas mass depends on the length L and width W of the cantilever, the density of the gas ϱfluid and the real part of the approximated hydrodynamic function . The thickness of the viscous boundary layer δ depends on ϱfluid the density and ηfluid the dynamic viscosity of the gas and decreases with higher frequency. The quality factor was given by
For the dissipation coefficient for viscous damping
applies, with the constants b1=3.8018 and b2=2.7364. For the cantilever and the gas mixture under investigation, the thickness of the viscous boundary layer is significantly smaller than the characteristic dimension W. Under these conditions the quality factor is indirectly proportional to . Based on the investigations of Zöllner et al. (2018), the influence of the gas flow velocity v on the resonance frequency (Eq. 7) can be described by the change in the moving gas mass as a result of the boundary layer thickness decreasing with increasing velocity:
The influence of the flow on the quality factor, which is proportional to the resonance amplitude, can be determined by the following matching function:
c1, c2 and n (n≈2) are gas-type-dependent fitting parameters. Both functions are applicable for flow velocities up to 10 m s−1.
A microcantilever is a thin silicon leaf spring clamped on one side. The rectangular cross section cantilever used here has dimensions of and has an integrated thermomechanical actuator and a Wheatstone measuring bridge in a full bridge arrangement (Rangelow et al., 1994). In Fig. 1a the magnification of a cantilever sensor is shown. The application of a periodic signal (excitation signal) to the actuator leads to a periodic temperature change. Due to the different coefficients of thermal expansion (Al actuator and Si cantilever), the periodic temperature change leads to oscillation of the arrangement (bimorph effect). The bending can be detected via the Wheatstone measuring bridge located at the clamping point. The static and dynamic deflection on the cantilever can be determined from the response signal.
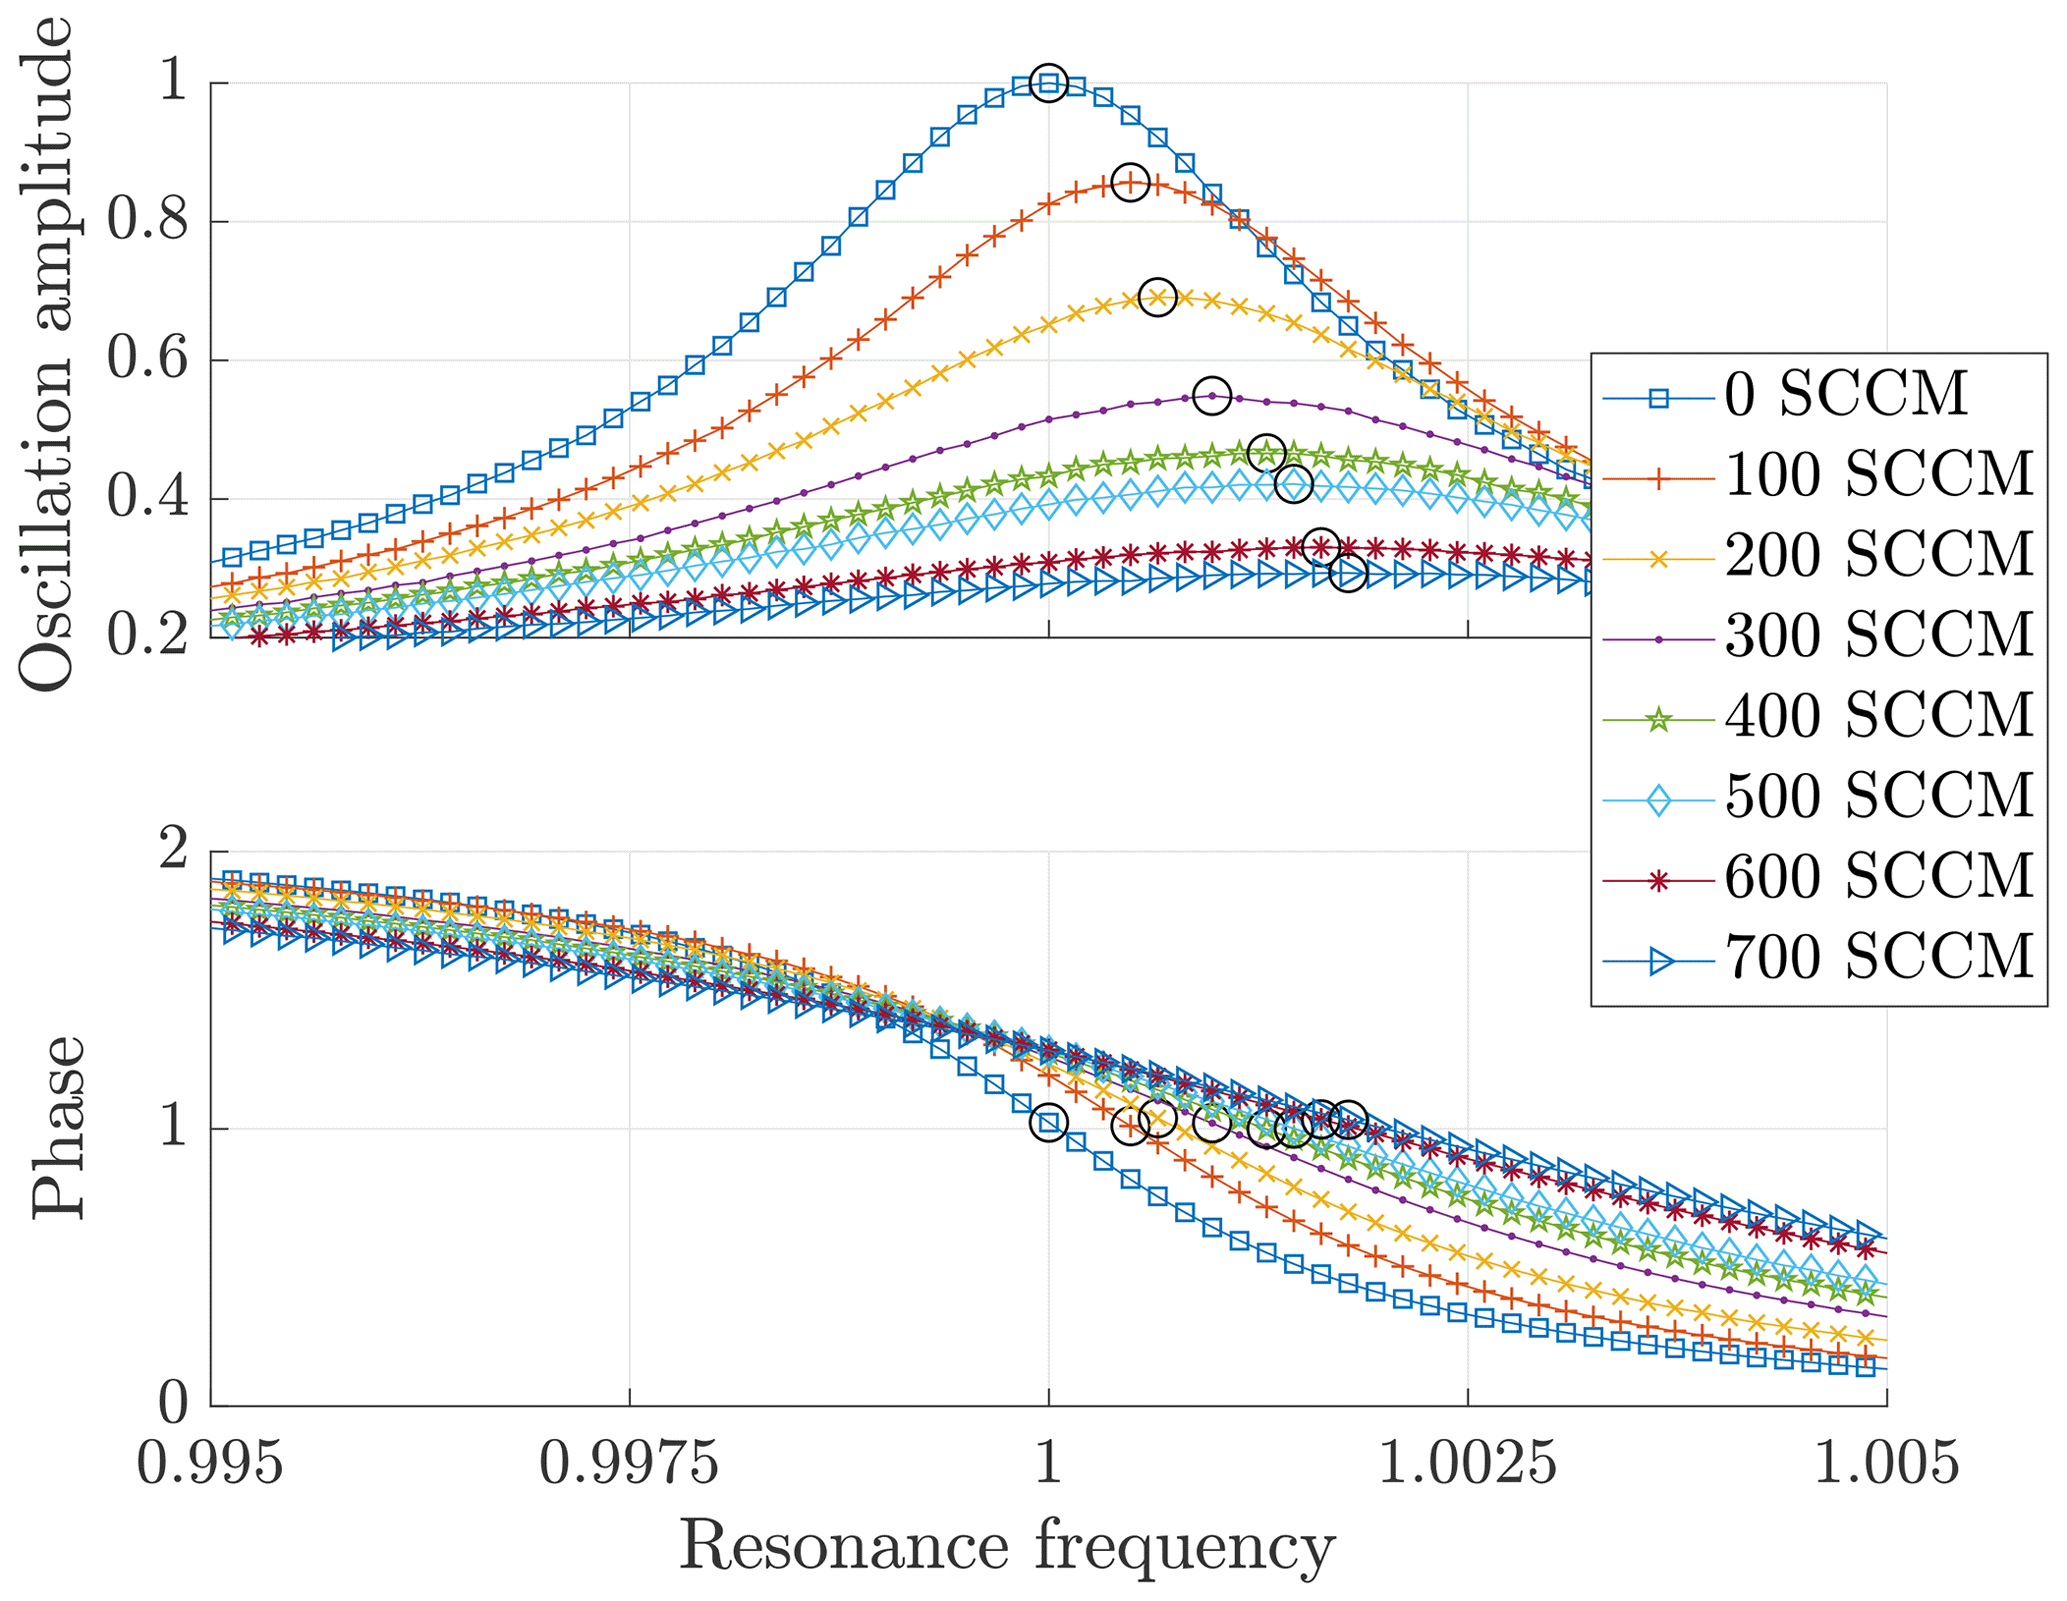
Figure 2Oscillation amplitude and phase as a function of the resonance frequency at different volume flows (the circles mark the oscillation maxima and the associated phase).
Figure 1b shows a model sketch of the flow channel. It can be seen that the cantilever is located vertically in the flow channel and is influenced by a flow. The flow passes an entrance length of 11 mm to ensure that a laminar flow profile strikes the cantilever. Furthermore, it is important to ensure that the cantilever is aligned in the middle of the flow channel in order to achieve reproducibility of the measurement. Figure 2 shows frequency sweeps of a cantilever for different volume flows (SCCM – standard cubic centimetres per minute) in air. The set of curves shows the oscillation amplitude and the phase as a function of the frequency of the excitation signal. The oscillation amplitude decreases according to Eq. (3) with increasing volume flow and thus increasing attenuation. According to the harmonic oscillator model, one would assume that the frequency would be shifted to smaller values with increasing attenuation. However, the small shift of the resonance frequency (see Eq. 11) to higher frequencies can be explained by a lower mass of the fluid due to an increasing volume flow according to Eq. (7) (Zöllner et al., 2018). The phase shift (phase) between response and excitation signal is shown in Fig. 2. By comparing the points in resonance with respect to the phase, a constant phase can be shown with respect to the resonance frequency according to Eq. (5).
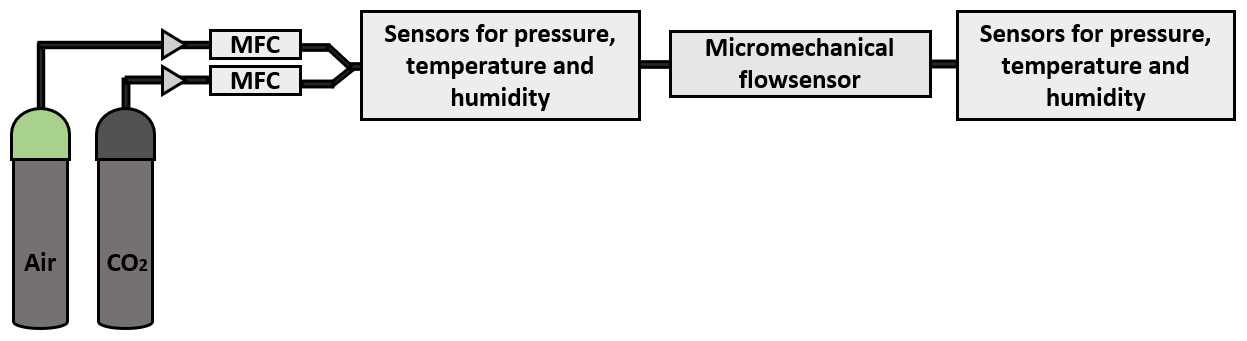
Figure 3Principle representation of the measurement set-up for the analysis of an air–carbon-dioxide gas mixture with sensors for the detection of the cross-sensitivities and the micromechanical flow sensor (cantilever).
Because of the constant phase at the resonance point, a phase-locked loop was used to evaluate the microcantilever signals (Zöllner et al., 2018). To provide the excitation signal of the microcantilever, a signal generator (DDS – direct digital synthesis) is used. The response signal is then separated by filtering into a static (DC voltage) and a dynamic (AC voltage) signal. The lock-in amplifier is used to determine the dynamic amplitude and phase. The measured phase is transferred from the lock-in amplifier to a phase controller. This controls the frequency of the signal generator in such a way that it is regulated to a preset phase. This guarantees that the microcantilever is always in resonance even when environmental influences change (e.g. mass flow, type of gas). In contrast to the frequency sweep, this measurement method also enables real-time recording of the measurement signals.
Figure 3 shows the experimental set-up. The two gas sources of air and carbon dioxide are each connected to a mass flow controller (MFC). The volume flow is controlled by gas type-specific mass flow controllers. By adjusting these controllers, the proportions in the gas mixture and the volume flow can be varied. The gas mixture is fed via a sensor unit to monitor the ambient variables. Since the measuring set-up used is an open measuring system, these sensors were installed before and after the cantilever sensor. In order to quantify the influence of cross-sensitivities, temperature, pressure and humidity are recorded. By recording the cross-sensitivities it can be determined whether stable conditions have been established in the measuring system.
First, the influence of the gas flow and the mixing ratio of the gas mixture on the measured variables resonance frequency and amplitude is determined. For one series of measurements, during the detection of the gas concentration in the air–carbon-dioxide gas mixture, the volume flow was set to a constant value. Only the mixing ratio was changed in order to allow only detection of the concentration. For different series of measurements, these tests were carried out at different constant volume flows. Figure 4 shows the resonance frequency as a function of the mixing ratio for different volume flows (50, 100, 200, 300 and 400 SCCM). For a set volume flow of 50 SCCM, a mean flow velocity of 1.05 m s−1 can be expected for a tube diameter of 1 mm (, , , ). The function plotted in this figure as dotted lines was calculated. The dotted curve was calculated for quiescent gas (0 SCCM) according to Eqs. (7)–(10) with adjustment coefficients adapted to the specificity of the cantilever. The moving gas volume leads to a change of the resonance frequency. Higher relative velocities of the cantilever with respect to the gas, caused by the movement of the cantilever itself (oscillation) and additionally by the gas flow, lead to a decrease in the boundary layer thickness and thus to a decrease in the moving gas mass combined with an increase in the resonance frequency. Since the moving gas mass is small compared to the cantilever mass and this small gas mass is additionally dependent on the boundary layer thickness, this influence is small and can be described as a linear increase (Eqs. 7 and 10). As can be seen in Fig. 4, the resonance frequency decreases with the increase in carbon dioxide in the gas mixture. This influence can essentially be attributed to the difference in density between air and carbon dioxide. The calculated function for a quiescent gas shows an equivalent linear behaviour. The standard deviation is ±1 Hz, which was determined by repeated measurements.
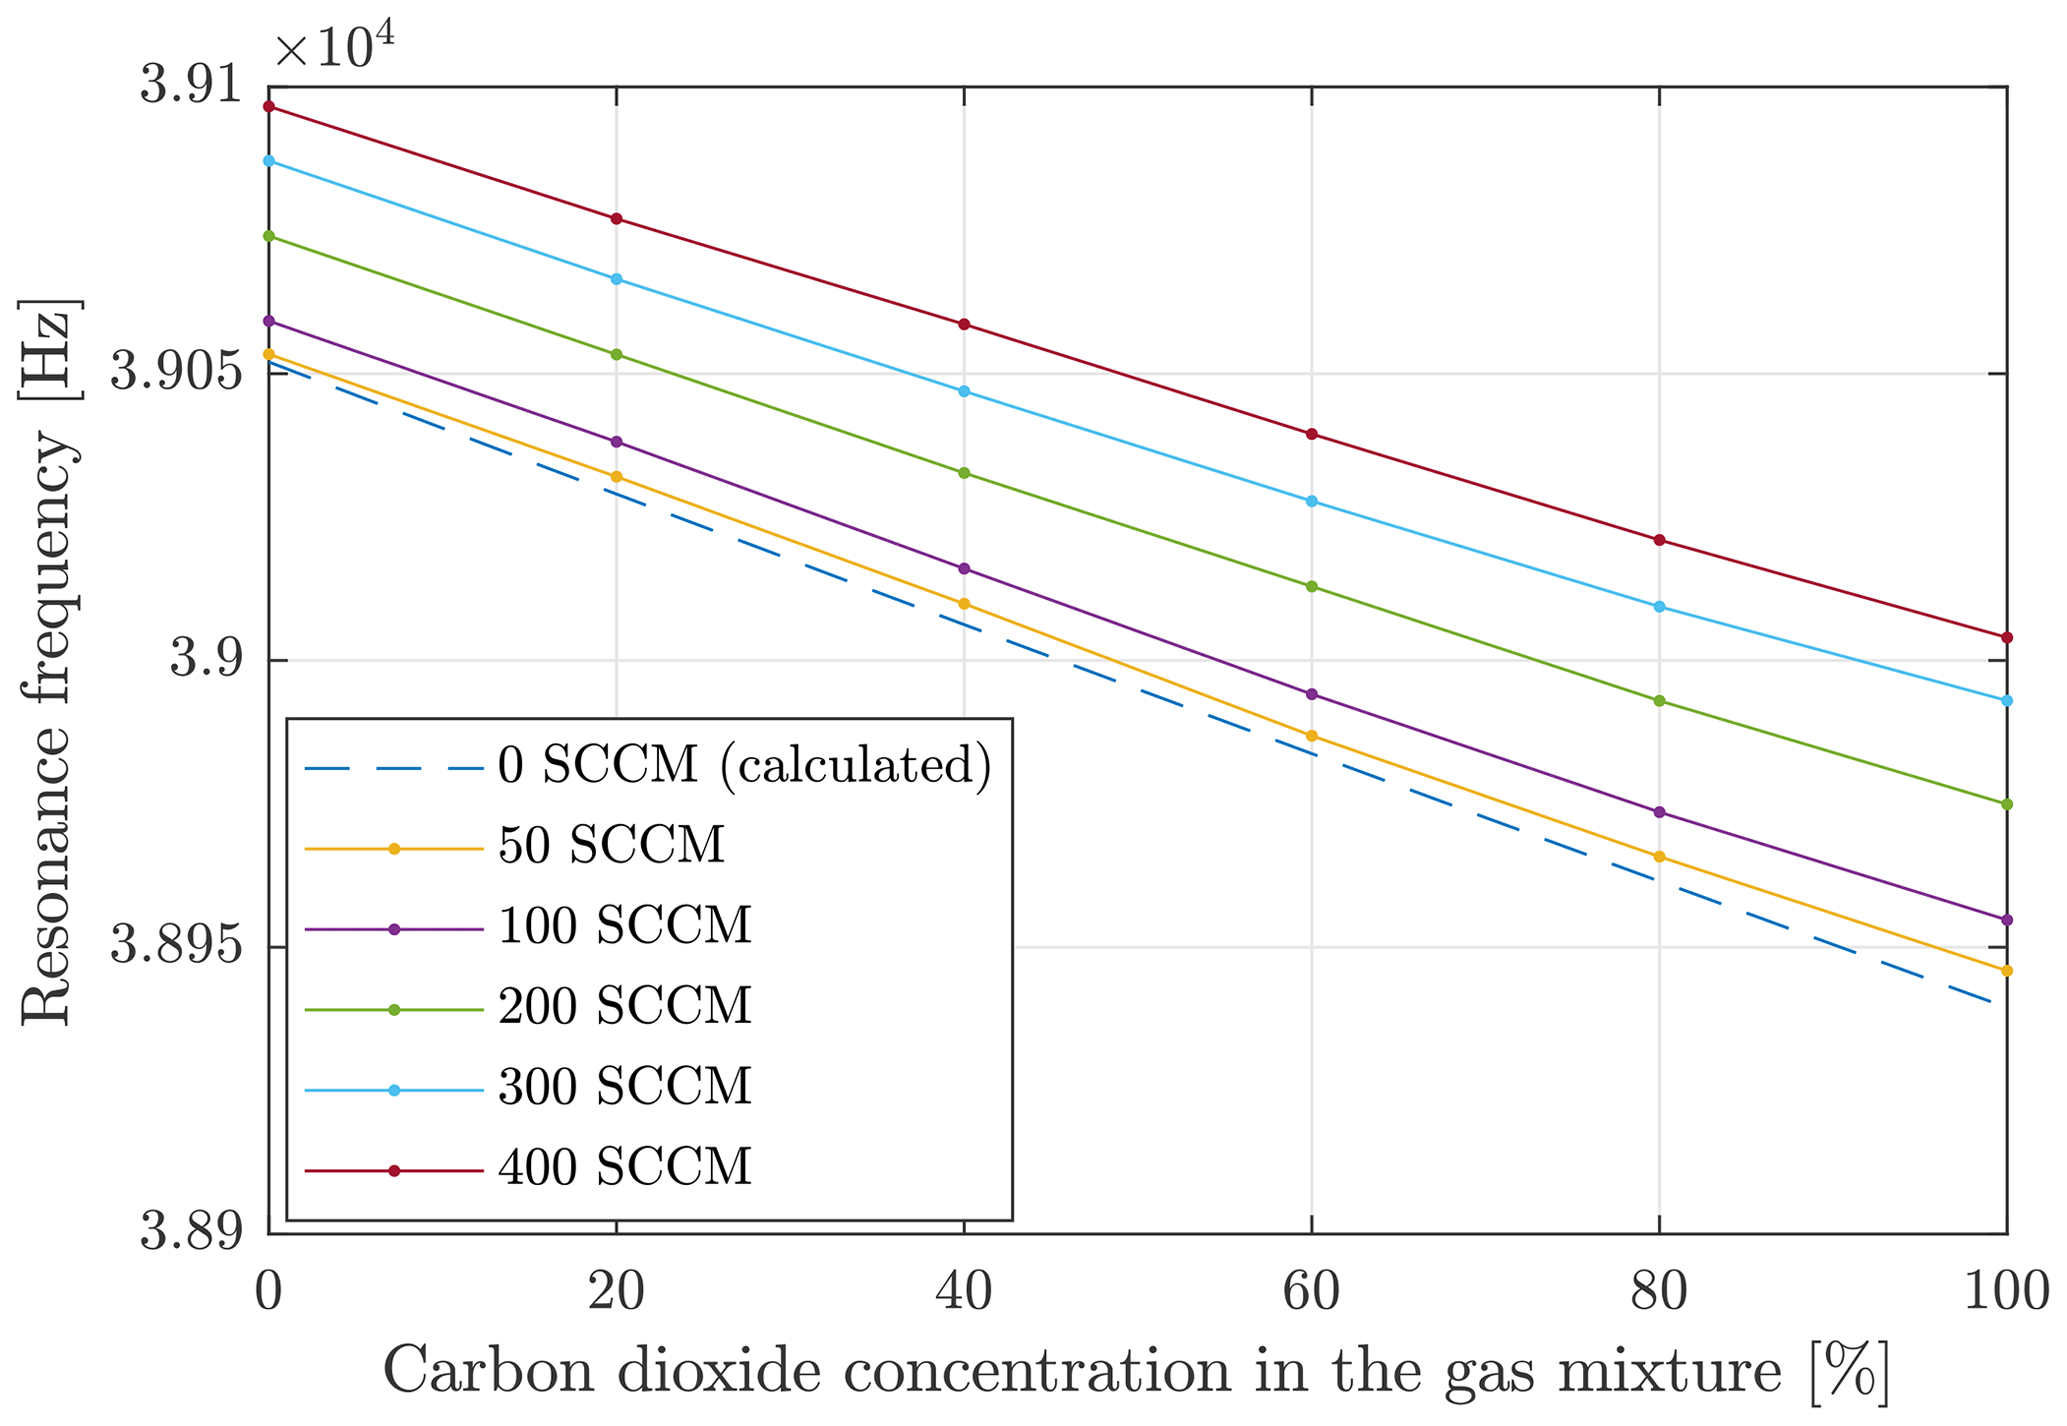
Figure 4Resonance frequency as a function of the concentration of carbon dioxide in the air–carbon-dioxide gas mixture at different volume flows.
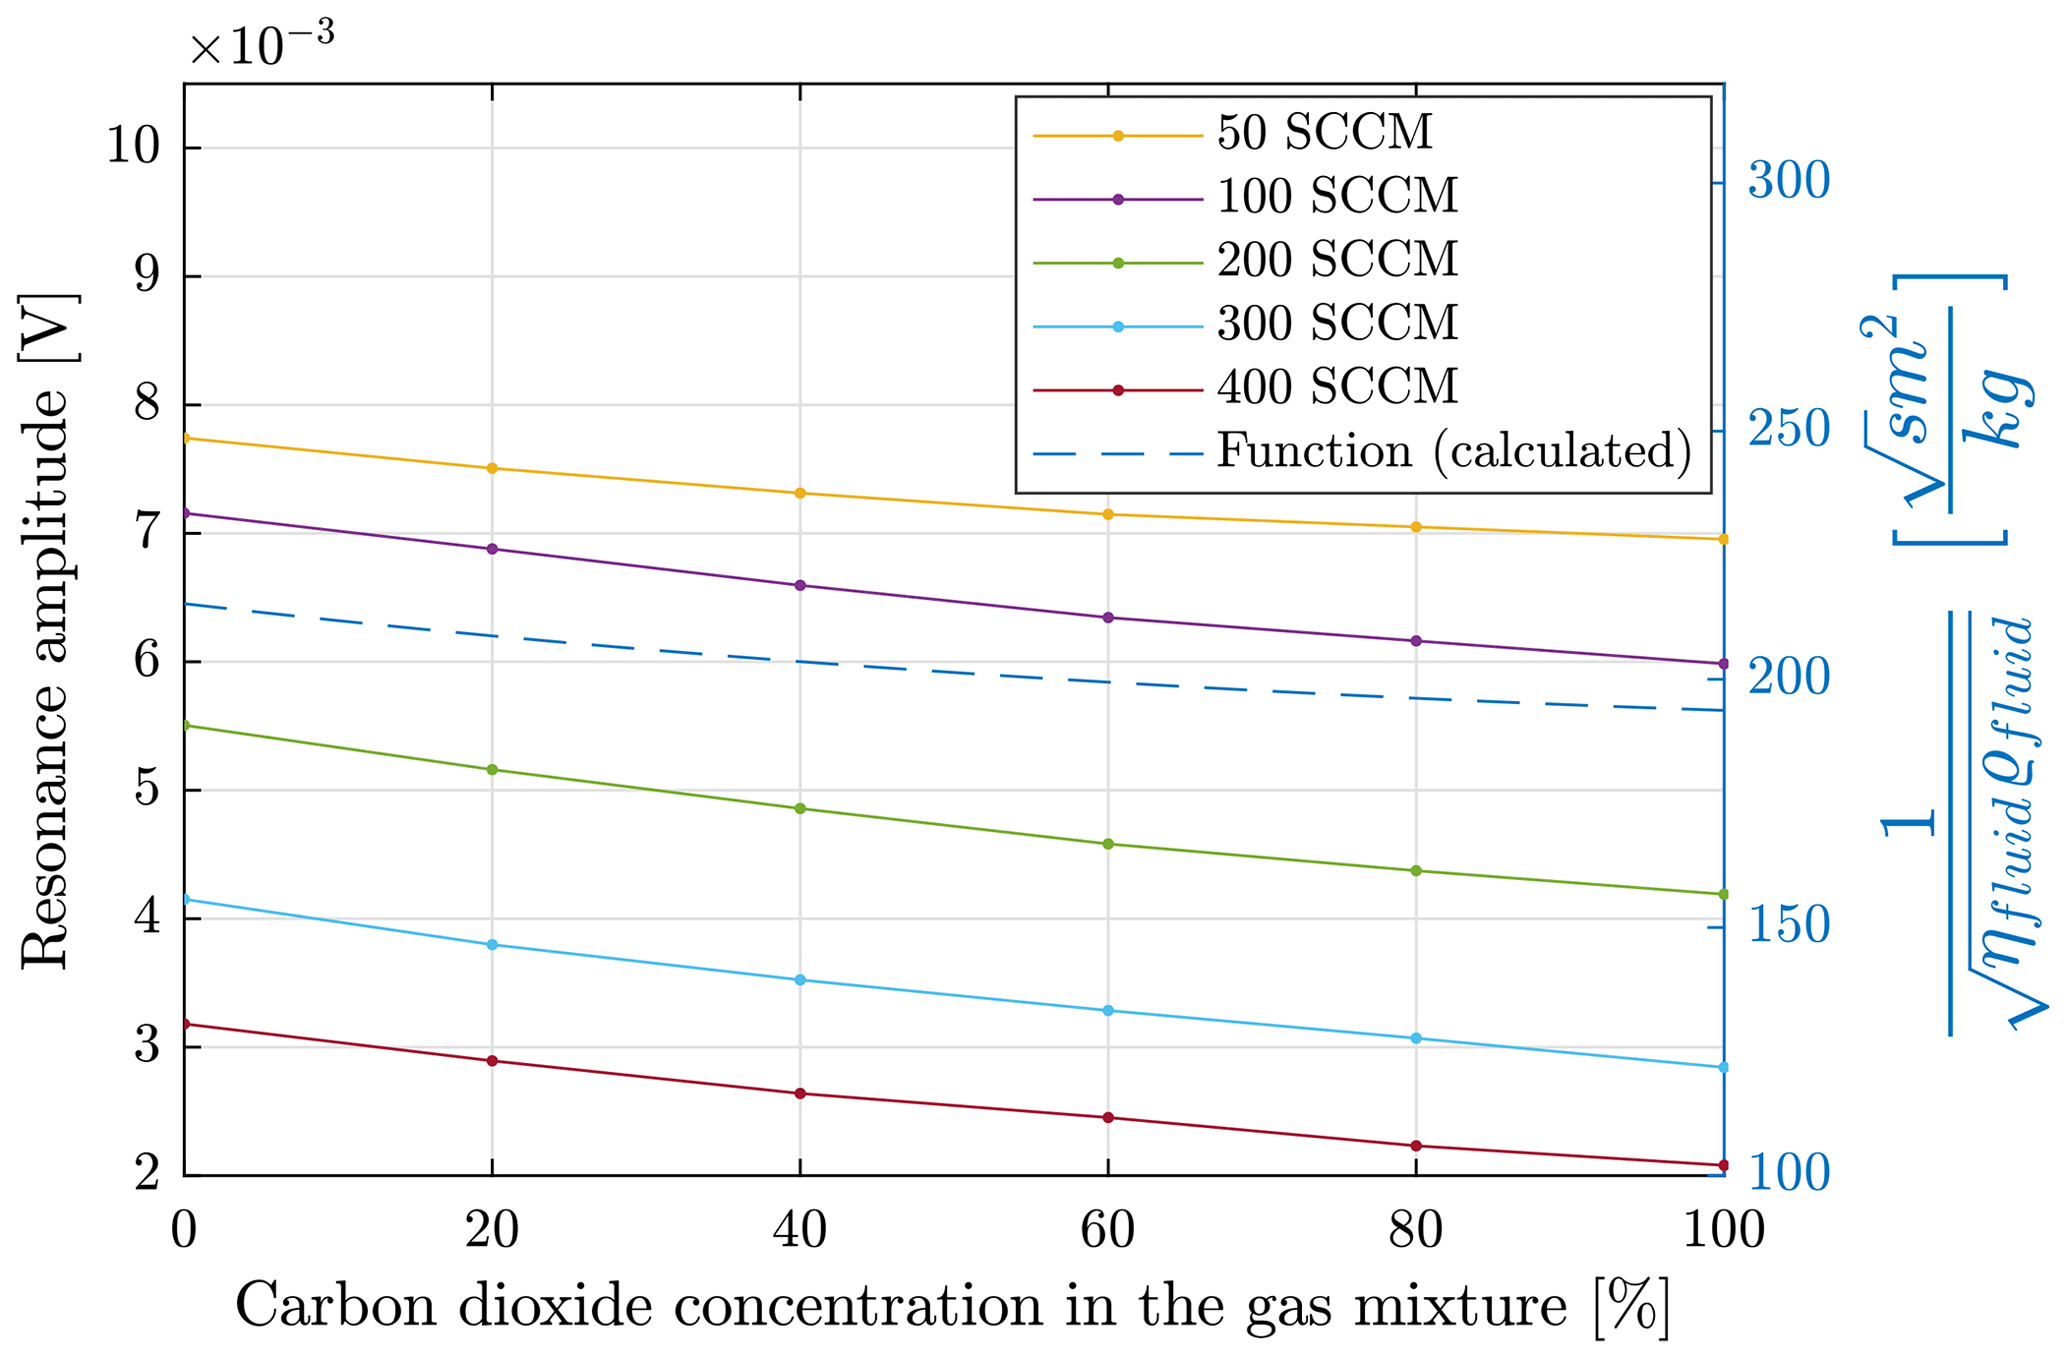
Figure 5Resonance amplitude and function for describing the mixing properties (blue) as a function of the air–carbon-dioxide gas mixture at different volume flows.
Figure 5 shows the resonance amplitude as a function of the mixing ratio for different gas flows. In addition, the dependency of the factor on the mixing ratio is inserted in the diagram. It shows the influence of changing gas properties on the resonance amplitude according to Eqs. (4) and (12). In contrast to the resonance frequency, the resonance amplitude is much more influenced by the flow velocity (volume flow) and is proportional to , with n≈2 and for higher velocities proportional to (Zöllner et al., 2018).
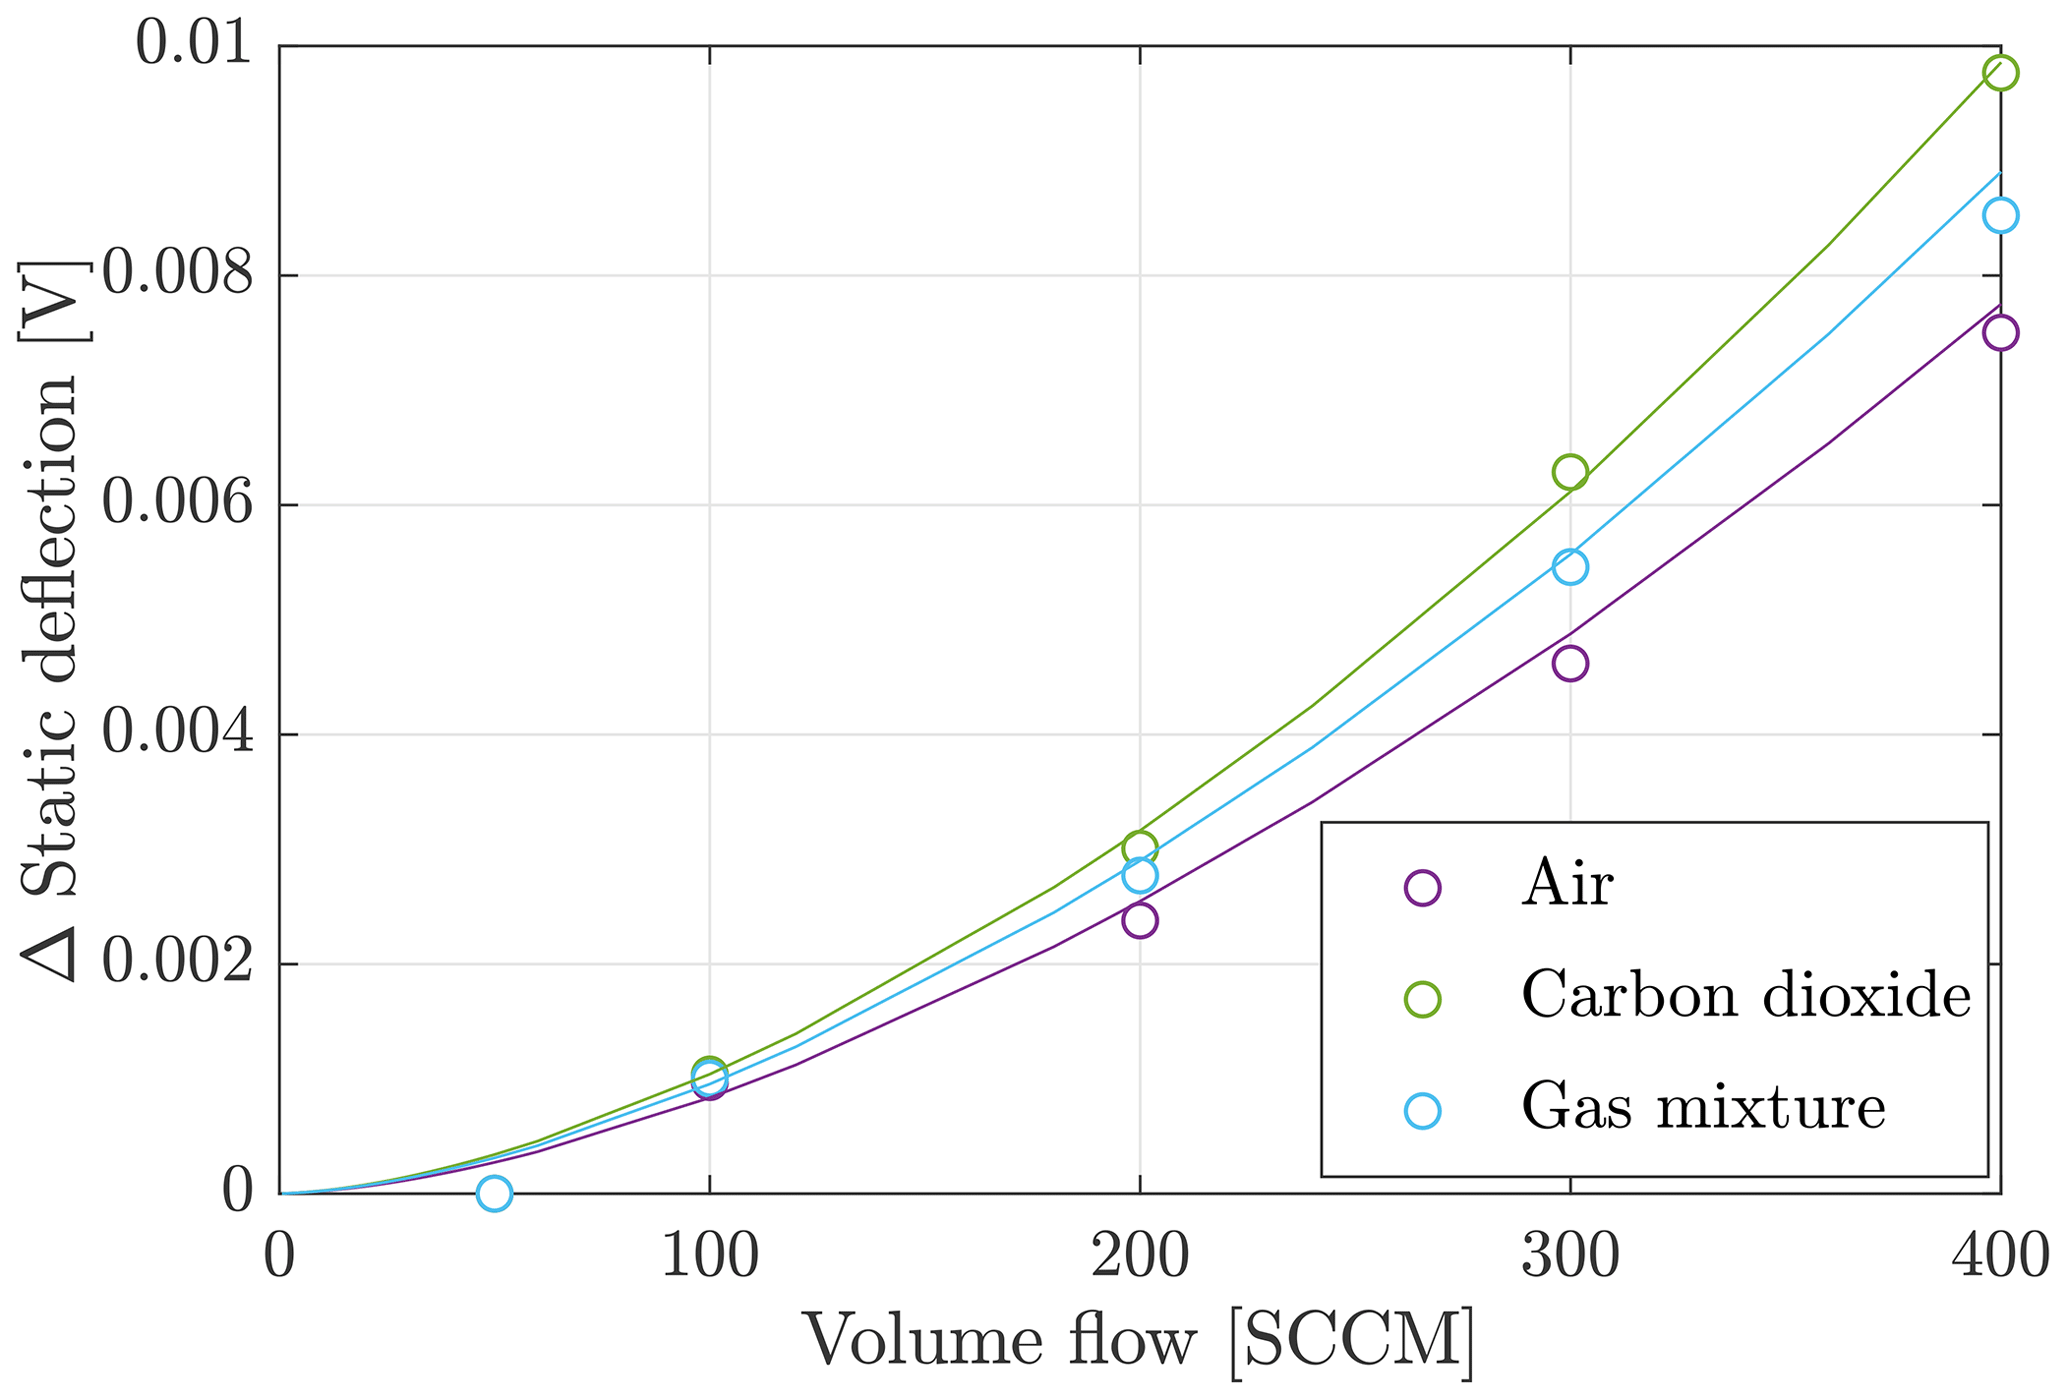
Figure 6Static deflection as a function of the volume flow for air, carbon dioxide and a gas mixture with a composition 50 % to 50 %.
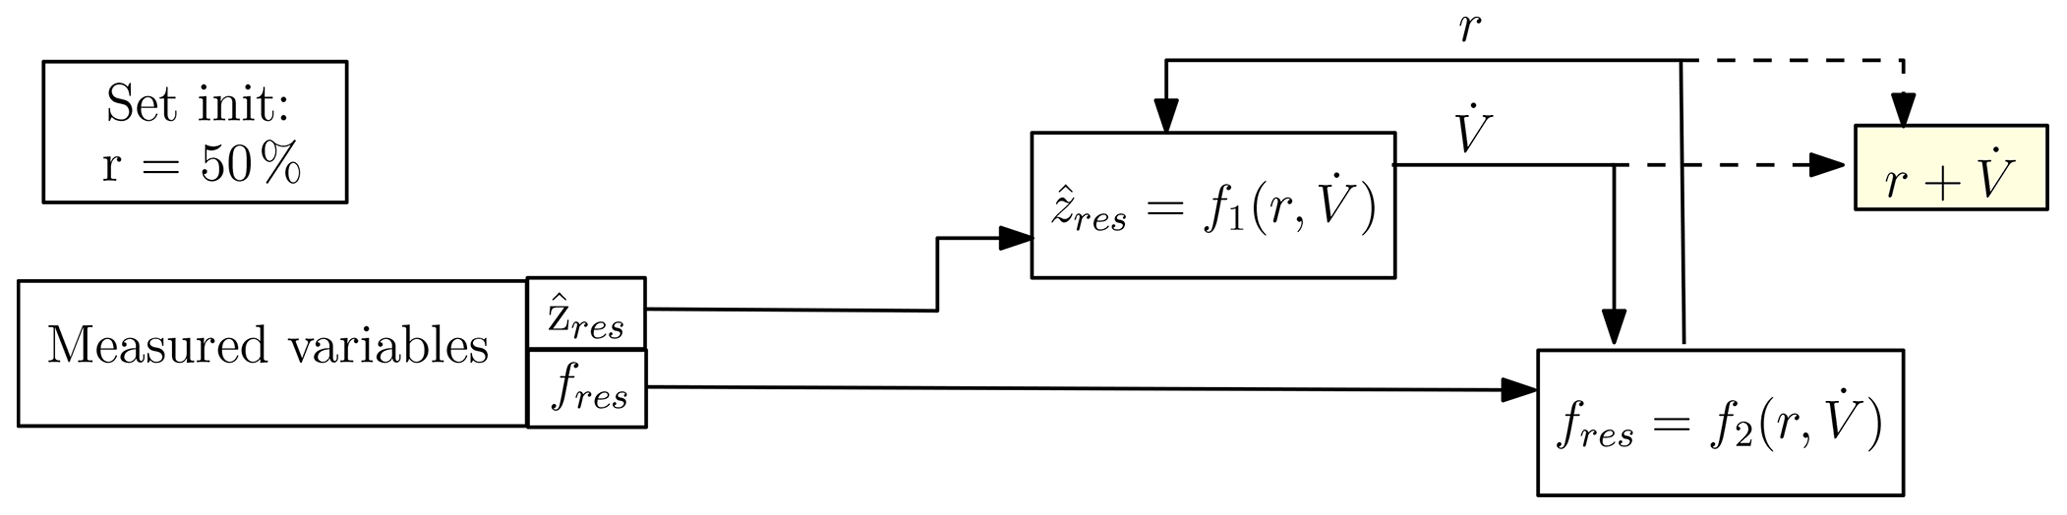
Figure 7Model for the description of the iterative solution for the determination of the gas concentration in the gas mixture and the volume flow. The term “init” is short for “initialisation”.
An increase in the volume flow from 50 to 400 SCCM causes the resonance amplitude to decrease by 60 %. This is caused by the fact that with increasing volume flow the system is more strongly damped. However, the influence of the gas medium on the resonance amplitude is smaller. The influence of the mixing ratio on the resonance amplitude is mainly caused by the factor in the investigated flow range. All curves for different flows show this dependency. The influence of the flow on the curve shape is small. In addition to the dynamic measuring mode, it is possible to record the static deflection. The influence of the type of gas and the flow velocity on the static deflection is shown in Fig. 8. For this purpose the static deflection at different volume flows in air, carbon dioxide and a mixture with a proportion of 50 % carbon dioxide and 50 % air was recorded.
For static deflection the following relationship with the drag coefficient cD applies:
The static deflection is influenced on the one hand by the density of the surrounding medium and on the other hand by the volume flow; accordingly this measured variable increases with the flow velocity as well as with a higher density. Since the sensitivity of this measured variable is low for small volume flows and is affected by noise, the further course of the determination of the mixing ratio and the volume flow is limited to the dynamically measured variables.
It could be shown that two variables influence the movement behaviour of the cantilever at the same time, whereby these two variables act together. However, the presented results allow the separation of these two variables. The algorithm for determining the mixing ratio and the volume flow out of the resonance amplitude and the resonance frequency is shown in Fig. 7. The characteristic curve fields ( and ) determined experimentally for the intended working range (mixing ratio: r=0… 100 %; volume flow: ) are stored as value tables.
Additionally a sequence of iterative approximation can be found in Fig. 8, in which the first four steps are described in an image sequence. To describe the algorithm, a frequency of 39.02 kHz and an amplitude of 6 mV are assumed as measured values (black lines in the diagrams of Fig. 8). At the beginning a start value for the mixing ratio, e.g. r=50 %, is set. Using this value and the current measured value the volume flow is determined from the dependency (Fig. 8a). In the next step, this value (inserted as an interpolated curve) and the current measured value fres are used to determine the mixing ratio r using the dependency (Fig. 8b). This ratio r is again used to determine the volume flow from the curve field (Fig. 8c). This procedure is continued cyclically and delivers the desired values of r and . The algorithm includes the detection and handling of out-of-range conditions.
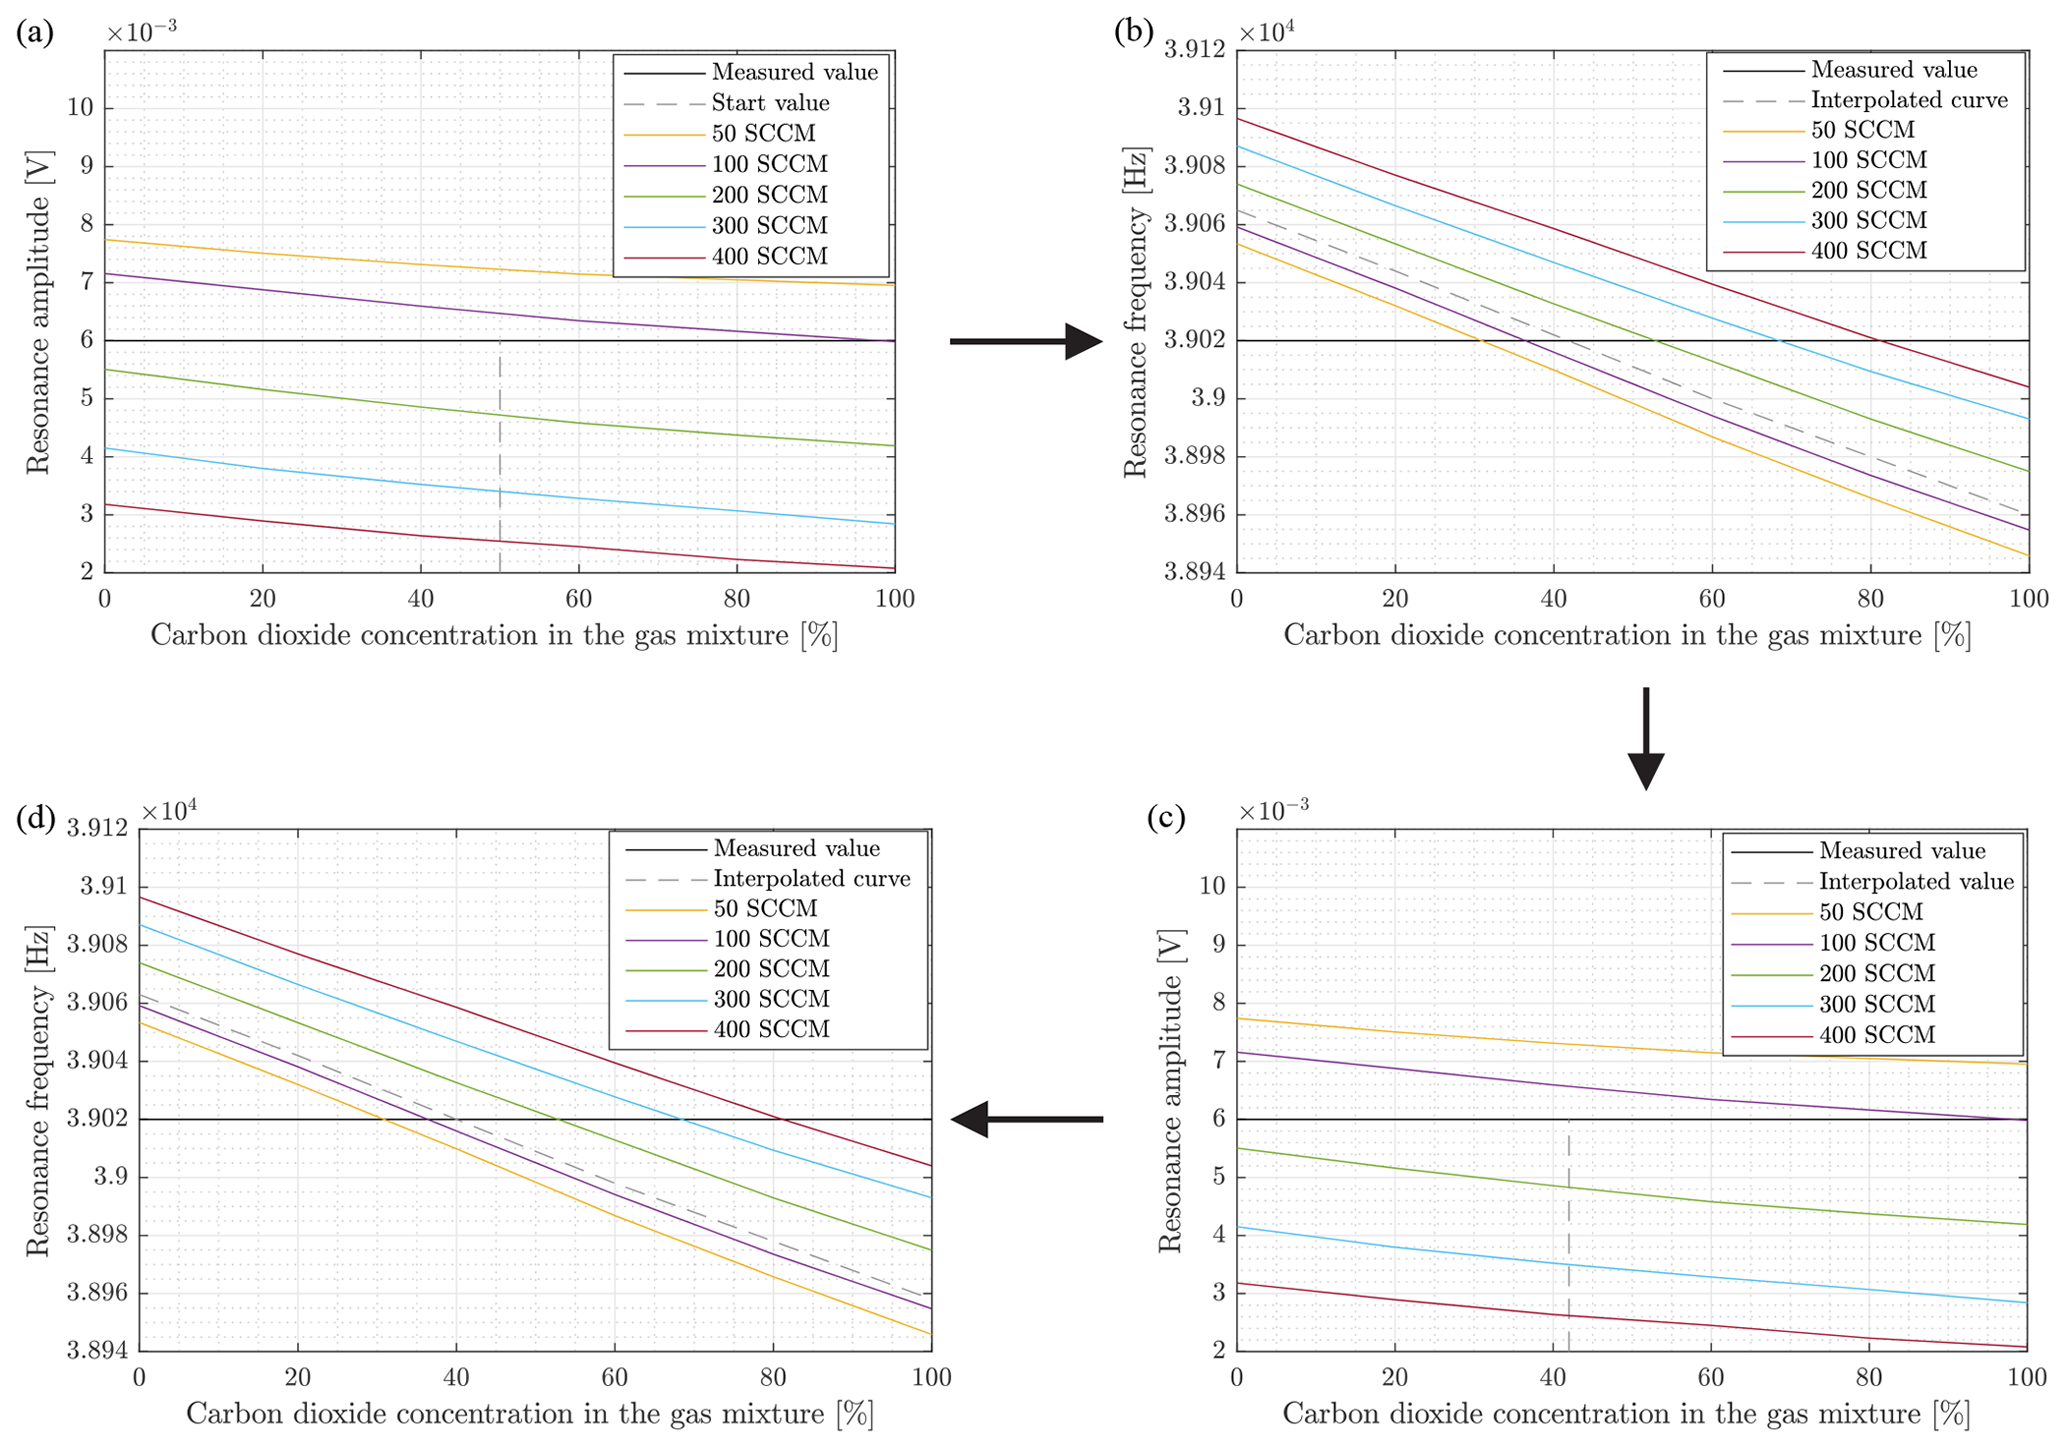
Figure 8Description of the iterative solution for determining the gas concentration in the gas mixture and the volume flow out of the measured values of resonance frequency and resonance amplitude.
It was investigated within which framework it is possible to determine the mixing ratio of a mixture consisting of two known gases with a single microcantilever sensor in addition to the recording of the volume flow rate. An air–carbon-dioxide mixture (0 % to 100 % CO2 content) at volume flows of 50 to 400 SCCM was used for the investigation. A cantilever with a bimorphactuator and piezoresistive readout is used. The cantilever, which is placed transverse to the gas flow, is operated permanently in resonance by a controlled actuation. The detected resonance amplitude and resonance frequency depend on the flow velocity and the gas properties density and viscosity and thus on the mixing ratio of a binary gas mixture. The experimentally determined sensor behaviour is used in an iterative algorithm to determine the volume flow and the mixing ratio from the resonance frequency and resonance amplitude. By repeated measurements a measuring accuracy of the mixing ratio of 1 % could be achieved. However, this only applies to the gas mixture used, as these two gases can be distinguished sufficiently well by their densities. When using gases with similar material properties, the achievable accuracy is lower. In this work it could be shown that this concept can be successfully applied for the determination of the flow rate and the mixing ratio of a gas mixture. These sensors are also cost-effective, small and the manufacturing process is CMOS compatible, which makes it possible to produce them as a mass product. With a gas mixture consisting of two distinguishable gases in terms of viscosity and density, this sensor system offers some advantages for determining the flow rate and the mixing ratio in contrast to conventional systems, where it is only possible to determine both quantities simultaneously with difficulty or with recalibration. Possible further applications are the recognition of the drift of the sensor behaviour and detection of contamination and ageing phenomena.
The research data are available upon request to the authors.
JPZ developed the theory and performed the computations. JPZ, JS and SD performed the experiments and analysed the data . JS, JPZ and SD wrote the paper. TI, MH and MH designed and fabricated the cantilever. WE developed the electronic. WUR constructed and built the sensor enclosure. JPZ, IR and EM conceived and designed the experiments.
The authors declare that they have no conflict of interest.
This article is part of the special issue “Sensors and Measurement Systems 2019”. It is a result of the “Sensoren und Messsysteme 2019, 20. ITG-/GMA-Fachtagung”, Nuremberg , Germany, 25–26 June 2019.
The authors gratefully acknowledge the support by the Thüringer Aufbaubank within the framework of the project (project no. 2017VF0047). Furthermore, we acknowledge support for the Article Processing Charge by the German Research Foundation (DFG) and the Open Access Publication Fund of the Technische Universität Ilmenau.
This paper was edited by Stefan Zimmermann and reviewed by two anonymous referees.
Badarlis, A., Pfau, A., and Kalfas, A.: Measurement and Evaluation of the Gas Density and Viscosity of Pure Gases and Mixtures Using a Micro-Cantilever Beam, Sensors, 15, 24318–24342, https://doi.org/10.3390/s150924318, 2015. a
Egorov, A. G., Kamalutdinov, A. M., Nuriev, A. N., and Paimushin, V. N.: Theoretical-Experimental Method for Determining the Parameters of Damping Based on the Study of Damped Flexural Vibrations of Test Specimens. 2. Aerodynamic Component of Damping, Mech. Compos. Mater., 50, 267–278, https://doi.org/10.1134/S0021894416020103, 2014. a
Ejeian, F., Azadi, S., Razmjou, A., Orooji, Y., Kottapalli, A., Warkiani, M., and Asadnia, M.: Design and applications of MEMS flow sensors: A review, Sensor. Actuat. A-Phys., 295, 483–502, https://doi.org/10.1016/j.sna.2019.06.020, 2019. a
Hao, J., Erbil, A., and Ayazi, F.: An analytical model for support loss in micromachined beam resonators with in-plane flexural vibrations, Sensor. Actuat. A-Phys., 109, 156–164, https://doi.org/10.1016/j.sna.2003.09.037, 2003. a
Hosaka, H., Itao, K., and Kuroda, S.: Damping characteristics of beam-shaped micro-oscillators, Sensor. Actuat. A-Phys., 49, 87–95, https://doi.org/10.1016/0924-4247(95)01003-J, 1995. a
Kumar, A., Periasamy, C., and Pant, B. D.: Cantilever based MEMS pressure sensor using different Piezoelectric Materials: A comparative study, IJEDR, 2, 4022–4026, https://doi.org/10.14419/ijet.v7i1.5.9153, 2014. a
Maali, A., Hurth, C., Boisgard, R., Jai, C., Cohen-Bouhacina, T., and Aime, J.-P.: Hydrodynamics of oscillating atomic force microscopy cantilevers in viscous fluids, J. Appl. Phys., 97, 074907, https://doi.org/10.1063/1.1873060, 2005. a, b
Naeli, K. and Brand, O.: Dimensional considerations in achieving large quality factors for resonant silicon cantilevers in air, J. Appl. Phys., 105, 014908, https://doi.org/10.1063/1.3062204, 2009. a, b
Rangelow, I. W.: Scanning proximity probes for nanoscience and nanofabrication, Microelectron Eng, 83, 1449–1455, https://doi.org/10.1016/j.mee.2006.01.199, 2006. a
Rangelow, I. W., Skocki, S., and Dumania, P.: Plasma etching for micromechanical sensor applications, Microelectron. Eng., 23, 365–368, https://doi.org/10.1016/0167-9317(94)90174-0, 1994. a
Rangelow, I. W., Ivanov, T., Hudek, T. P., and Fortagne, O.: Device and method for mask-less AFM microlithography, U.S. patent 7,141,808, 2005. a
Rangelow, I. W., Ivanov, T., Ahmad, A., Kästner, M., and Lenk, C.: Active scanning probes: A versatile toolkit for fast imaging and emerging nanofabrication, J. Vac. Sci. Technol. B, 35, 06G101, https://doi.org/10.1116/1.4992073, 2017. a
Sader, J.: Frequency responds of cantilever beams immersed in viscous fluids with applications to the atomic force microscopy, J. Appl. Phys., 84, 64, https://doi.org/10.1063/1.368002, 1998. a, b, c
Steffanson, M., Gorovoy, K., Ramkiattisak, V., Ivanov, T., Krol, J., Hartmann, H., and Rangelow, I. W.: ARCH-type micro-cantilever FPA for uncooled IR detection, Microelectron. Eng., 98, 614–618, https://doi.org/10.1016/j.mee.2012.04.037, 2012. a
Waggoner, P. and Craighead, H.: Micro- and nanomechanical sensors for environmental, chemical and biological detection, Lab Chip, 10, 1238–1255, https://doi.org/10.1039/b707401h, 2007. a
Zener, C.: Internal Friction in Solids II, General Theory of Thermoelastic Internal Friction, Phys. Rev., 53, 90, https://doi.org/10.1103/PhysRev.53.90, 1938. a
Zöllner, J.-P., Durstewitz, S., Stauffenberg, J., Ivanov, T., Holz, M., Ehrhardt, W., Riegel, W.-U., and Rangelow, I. W.: Gas-Flow Sensor Based on Self-Oscillating and Self-Sensing Cantilever, in: Proceedings of Eurosensors 2018, Graz, Austria, 9–12 September 2018, vol. 2, p. 846, 2018. a, b, c, d, e
- Abstract
- Introduction
- Basic equations for resonance behaviour
- Cantilever sensors and measurement set-up
- Measuring principle
- Experimental set-up
- Measurement results and evaluation
- Conclusions
- Data availability
- Author contributions
- Competing interests
- Special issue statement
- Acknowledgements
- Review statement
- References