the Creative Commons Attribution 4.0 License.
the Creative Commons Attribution 4.0 License.
 | 21 Feb 2020
Determination of the single point uncertainty of customized polymer gear wheels using structured-light scanning with various polygonization settings
Andreas Michael Müller
Dominik Schubert
Dietmar Drummer
Tino Hausotte
During the manufacturing of work pieces, geometrical deviations from the intended nominal geometry of the designer are inevitable. The procedure of conformance testing defined in ISO 14253-1:2018-07 is used to ensure the function of a work piece by verifying the geometrical compliance with pre-defined tolerance specifications. Depending on the measurement setup used for the validation step, it is possible that the local measurement uncertainty is too large in order to provide a meaningful conformance evaluation. This paper aims to demonstrate the complete workflow of the determination of the locally defined single point uncertainty and its components (systematic and random measurement error, respectively) for a given measurement task. It was shown for an optical measurement setup in combination with an industrial X-ray computed tomography reference measurement system that different necessary colouring methods of polymer (POM) gear wheels, which are required to enable measurements using structured-light scanning, have a measurable influence on the local distribution of the measurement uncertainty. Because of the fact that the presented method is dependent on a discrete surface sampling, the effects of different polygonization settings during the creation of the areal measurement result were evaluated in order to rate the reduced data complexity against the hereby possibly increased measurement uncertainty. The gained information regarding the local measurement uncertainty of a measurement setup can then be used for downstream processes in various use cases, e.g. for the improvement of holistic tolerance simulation models or the improvement of geometrical measurements using weighted regression analysis. Additionally, the visualization of the areal distribution of the measurement uncertainty enables a powerful tool to optimize the used measurement setup.


Generally, the results of any geometrical measurement of a work piece and the subsequent comparison against the nominal geometry (CAD – computer-aided design – model) as defined by the designer can be divided into three different contributions: (a) the geometric deviations of the measurement object with respect to the nominal geometry, (b) the (signed) systematic measurement error of the measurement system and (c) the (unsigned) random measurement error of the measurement system. The measurement uncertainty is a positive non-zero parameter associated with every real measurement and can in general only be reduced but never be completely avoided. The golden rule of metrology states that the measurement uncertainty shall be less than 10 % to 20 % of the tolerance (Knapp, 2001; Berndt et al., 1968). This requires a close observation of the achieved measurement uncertainties for each geometric verification task. Recent research efforts at the Institute of Manufacturing Metrology (FMT) dealt with the question of how to determine the local distribution of the measurement uncertainties over the surface of a measurement object and subsequently derive metrological benefits from that knowledge. The developed framework of the single point uncertainty (SPU) requires several inputs and prerequisites.
-
A measurement object.
-
The nominal geometry of the measurement object (CAD model).
-
A measurement system targeted for the uncertainty examination and capable of recording complete areal measurements of the chosen measurement object. (Note: the demonstrated method produces the best results when areal measurements are processed. However, making the required adjustments, it is in principle also possible to handle different forms of geometry representations, like line scans from coordinate measurement machines or even simple point clouds.)
-
A statistically significant number of measurement repetitions (here 20, following guideline VDI/VDE 2630 VDI/VDE 2630-2.1, 2015 and ISO 15530-3:2011 International Organization for Standardization, 2018).
-
A single reference measurement of the measurement object (reference geometry) performed by a reference measurement system in the sense of the International Vocabulary of Metrology (VIM) (Brinkmann, 2012) which is capable of recording areal measurements of the chosen measurement object (see also the note above).
-
A suitable sampling strategy dependent on the processed geometries and the computational resources available.
First, a reference measurement of the measurement object needs to be created using the reference measurement system. The captured areal geometry (usually represented by a triangle mesh in the STL format) is then geometrically aligned against the nominal geometry (CAD) by means of a geometrical registration routine. One property of a reference measurement system is that the measurement uncertainty for that specific measurement task is known to be low compared to the expected geometrical deviations. Consequently, the differences between the nominal geometry and the reference geometry can be fully assigned to the geometric deviations of the measurement object. Then, a measurement series consisting of n repeated measurements of the same measurement object is created, using the measurement system chosen for the uncertainty evaluation. Each measurement is then geometrically registered against the reference measurement. After the alignment of the surfaces, the calculation of the spatial measurement uncertainty distribution can be performed using different sampling strategies (Fig. 1). If the normal vectors of the reference geometry are trustworthy and the expected measurement uncertainty is rather small compared to geometric features on the surface, the sampling strategy normal vector can be used (Fig. 1, right). Starting from each sampling point SPk on the reference geometry, the intersection distance of a constructed search ray in the direction of the vertex normal vector is calculated for each measurement repetition. Thus, the resulting sets of distances () are effectively assigned to their respective reference surface vertices SPk, which then maps the computed distances onto the reference geometry. Per definition the detected distances dk only represent contributions to the measurement uncertainty of the used measurement system because the reference geometry by agreement represents the true geometry of the measurement object. Consequently, the mean value of dk represents the local systematic measurement error, while the local distribution of random measurement errors (measurement precision) is determined by the standard deviation of dk. After that, a suitable sampling method is applied to determine the local geometric deviations of the measurement object for each sampling point SPk by comparing the (same) reference surface against the nominal geometry (CAD). Summarizing the above, the single point uncertainty (SPU) is a framework to determine the geometric deviations of the examined measurement object and both components of the associated measurement uncertainty for each sampling point SPk on the surface of a reference geometry, with respect to the common coordinate system of reference geometry and measurement geometry. Consequently, the method is capable of drawing a spatially resolved uncertainty map of a specific measurement task. It is advantageous if the reference surface is pre-processed in such a way that the triangles of the mesh have uniform edge lengths, thus resulting in a homogeneous and preferably very dense sampling point distribution. Compared to the sampling strategy normal vector, the method shortest distance can provide better results in edge regions or if large distances are expected to be computed (Fig. 1). Nonetheless, in general both methods result in very similar uncertainty characteristics, with the main difference being the computation requirements and the easiness with which certain run time sensitive optimization measures can be implemented (Müller and Hausotte, 2019a). In case no reference measurement is available, the method can be used nonetheless to compute the areal distribution of the random measurement error, while the geometric deviations of the measurement object and the systematic measurement error cannot be separated this way. It is important to note that the determination of the SPU can be rather sensitive to geometrical misalignments resulting from a poor geometrical registration routine, which requires a certain diligence when deciding for a registration strategy. Extensive research at FMT has revealed numerous different usage scenarios, in which the determination of the SPU can enhance the understanding of a measurement setup and consequently improve the measurement itself. It was successfully shown in (Müller et al., 2018) that locally varying systematic measurement errors of a real industrial X-ray computed tomography (CT) system can be corrected by the determination of the SPU of repeated simulated measurements, if the simulation framework is sufficiently adopted to the real CT system. The information about the local measurement precision was successfully used within the implementation of a weighted geometry element regression analysis (also called fit/fitting), resulting in improved measurement results (Müller and Hausotte, 2019b). Fits are commonly used to assign standard geometry elements to measurement coordinates by minimizing a certain error function in order to determine the size and orientation of a specific geometry element (e.g. fitting of a cylinder to the point cloud representing a measured drilling). The method also allows the transfer of information about the measurement uncertainty associated with a certain measurement task to the downstream process of tolerance management (Müller et al., 2019). Here, the measurement uncertainty can then be taken into account during the design of work pieces and determination of the associated tolerances. The determination and evaluation of the SPU methods were developed for areal and volumetric measuring systems, which produce an areal representation of the geometry of the measurement object with varying meshes (e.g. computed tomography, structured-light scanning in combination with a rotatory axis and focus variation Müller and Hausotte, 2019c). Nonetheless, similar evaluations are also possible for tactile coordinate measurement machines, although a different data processing pipeline needs to be implemented and utilized (Müller et al., 2019a).
The goal of this paper is to present the framework of the single point uncertainty as a useful tool for the quantitative evaluation of a specific measurement setup using the example of an optical (structured-light scanning) polymer gear measurement task. Because of the relevance for the presented setup, the necessary measurement object colourization as well as the polygonization settings as part of the point cloud processing were investigated in more detail.
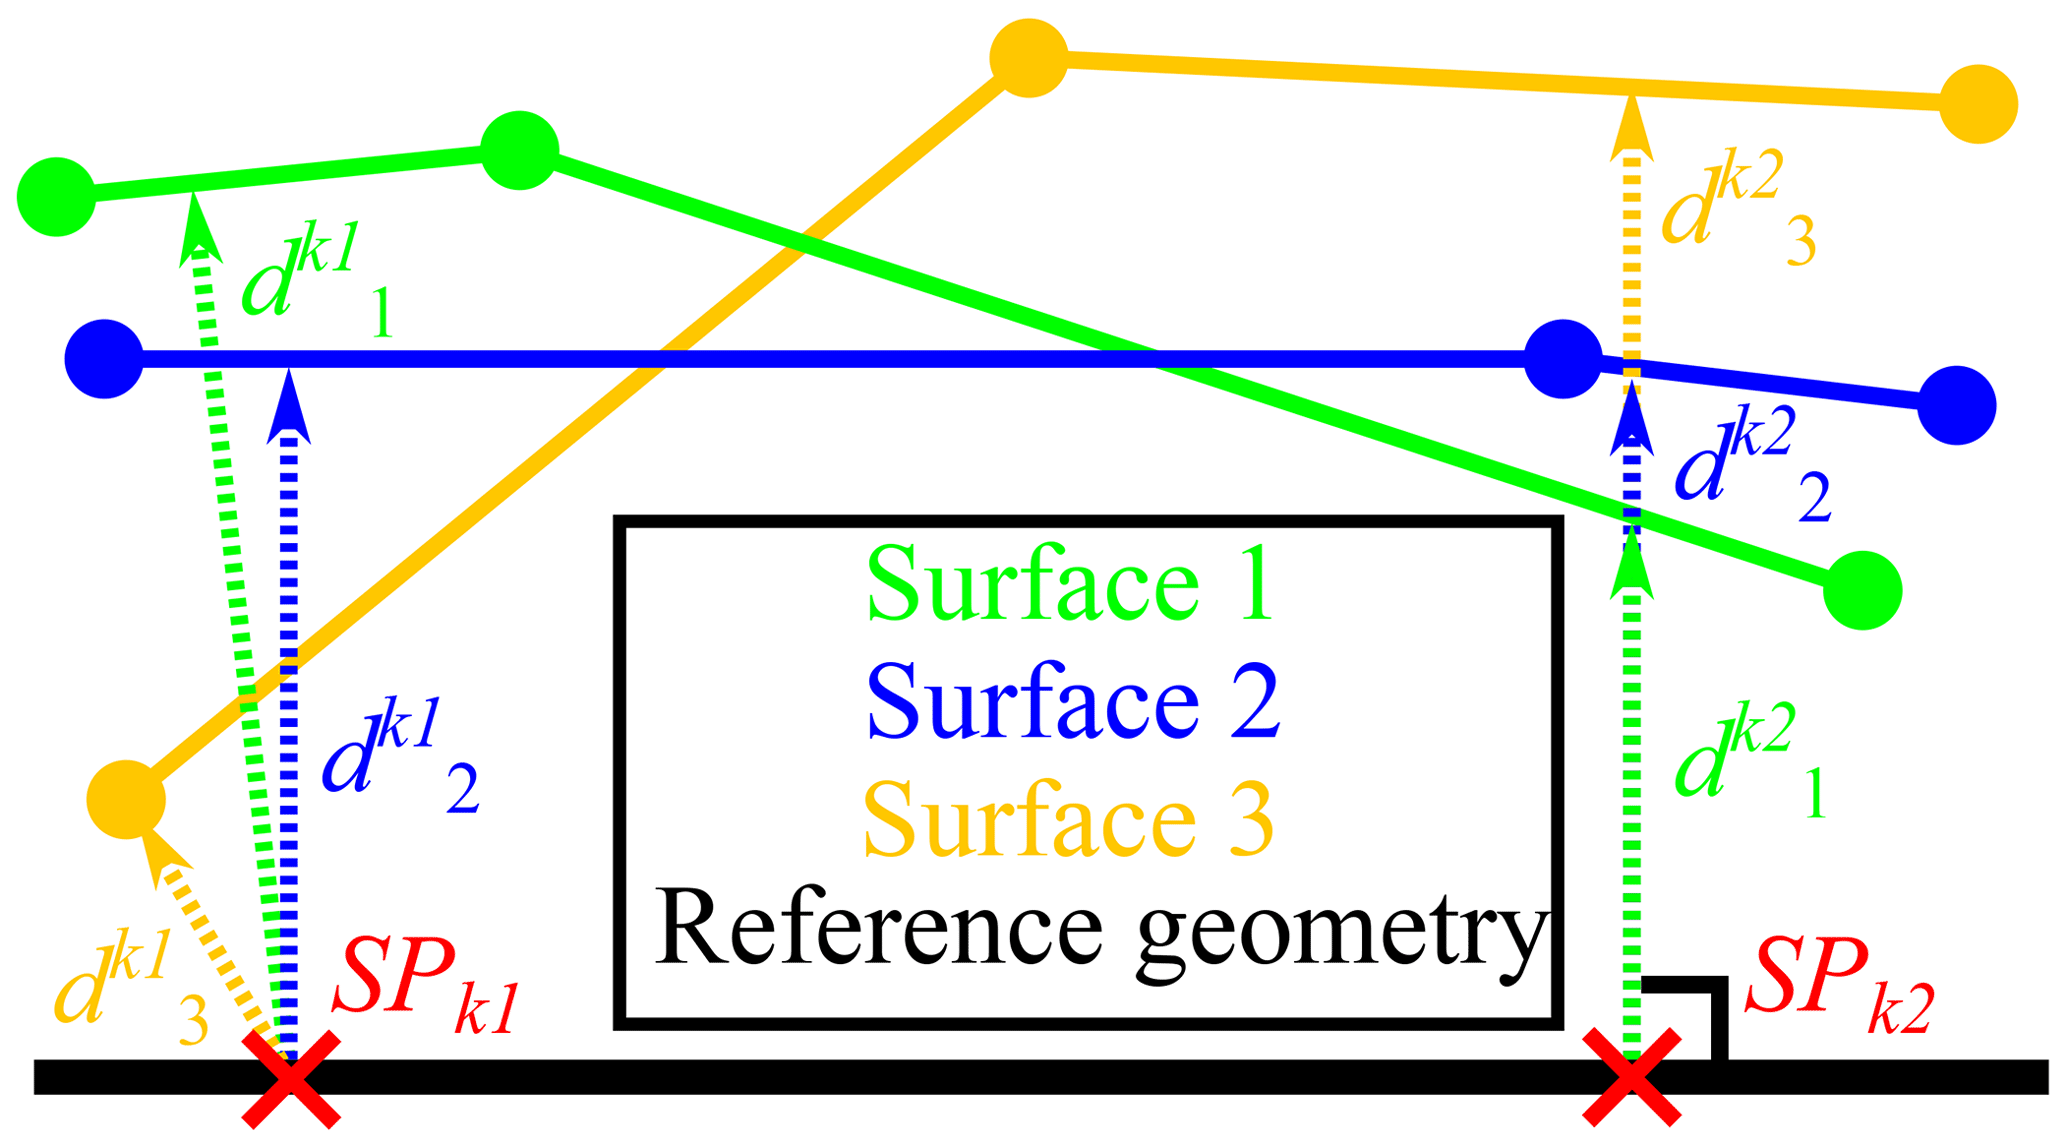
Figure 1Visualization of different sampling strategies: shortest distance (left) and normal vector (right).
The gears examined in this paper (Fig. 2, diameter approx. 39 mm) were produced by injection moulding using a polyoxymethylene (POM) of the type Hostaform C9021 by Celanese Services Germany GmbH, Kelsterbach. POM is often used in gear applications due to its self-lubricating properties and resulting good dry running capabilities and low friction and wear (Piorkowska and Rutledge, 2013). The semi-crystalline structure of the material leads to a process-dependent microstructure. In injection moulding processes, an optically amorphous edge layer is formed due to the high cooling rate in the areas with contact with the mould material. This leads to the formation of crystalline nanostructures with sizes below the wavelength of visible light. As a result, the edge layer appears optically amorphous (Menges et al., 1976). This semi-transparent edge layer leads to difficulties in optical measurements, especially with structured-light methods, due to the scattering of the projected lines into the material. Thus, the surface cannot clearly be determined. A further factor complicating optical measurements on this material is its gloss. To achieve useful measurements, the optical properties of the material have to be altered.
Using colourants, i.e. pigments with or without carrier materials, the optical properties of polymer materials can be altered easily and cost-efficiently. Pigments and other nano-sized particles act as scattering centres, reducing the translucency of the optically amorphous skin layers. They can also decrease the amount of directed reflection, reducing gloss (Raymond and Ronca, 2016). There are the three main methods of colourizing polymers with pigments, each with their own use case (Müller, 2012). Firstly, pre-coloured granulate, made by adding pigments to the base material, is used for large batches of material and frequently uses colours such as black and white (Müller, 2012). Secondly, for the individual colouration of smaller batches, master batches, highly pigment-filled granules, are used (Müller, 2012). Thirdly, compared to master batches, liquid colours allow for a more flexible mixing of pigments and a wider range of colours (Müller, 2012). The cost of colouration depends on the choice of pigment, way of colouration and dosage. Master batches and liquid colours are more expensive than pre-dyed material, but they are more flexible. Pigment cost can vary widely from inexpensive carbon to more expensive mineral- or metal-based effect pigments.
There are two main effects of colourants on part properties. On the one hand colourants can influence the crystallization either by acting as a nucleating agent or by hindering nucleation, depending on chemical interactions of the polymer and the colourant. On the other hand the colourant itself can effect changes, which can be subdivided into effects of the carrier material and effects due to the pigment. In general, these effects are superimposed and cannot be distinguished easily.
Nucleating effects of pigment-based colourants on the base material are observed frequently. This is due to the fact that both nucleating agents (Richaud, 2014) and colourants (Müller, 2012) are usually small in size (a few hundred nanometres) and require chemically compatible surfaces, good dispersion and insolubility to ensure proper functionality. As a result pigments can introduce additional crystallization centres leading to parts which exhibit a finer, more crystalline microstructure if compared to the base material (Müller, 2012). Lower cooling rates in the material can lead to a similar effect by allowing more time for the material itself to form nucleation centres (Richaud, 2014). In the case of POM two commonly used pigments, white titanium dioxide (Wacharawichanant et al., 2012) and carbon black (Richaud, 2014), show nucleating effects. One consequence of higher crystallinity is increased shrinkage and therefore deviations from desired geometric dimensions. Mechanical properties, like yield strength (Darras and Séguéla, 1993), break elongation, stiffness and impact strength (Piorkowska and Rutledge, 2013), are also often increased with a finer and highly crystalline microstructure. In pin-on-disk tests materials with a finer, highly crystalline morphology showed improved tribological properties, especially reduced wear rates (Künkel, 2005). However, even with titanium dioxide showing nucleation properties on POM (Wacharawichanant et al., 2012), a chemically related pigment, chrome antimony titanium rutile, showed de-nucleating effects and a related decrease in mechanical and tribological properties (Schubert et al., 2019). Thus, due to the complex interactions of pigment, carrier system and base polymer there is no general approach to predict whether a colourant has a nucleating, de-nucleating or no effect on the base polymer.
Due to the aforementioned complex interactions of pigments and base material, no general trend can be given for the effects of the materials itself. In regard to light and heat stability pigments can have widely varying impacts on POM. For example, carbon black has excellent properties as a stabilizer and UV absorber (Richaud, 2014) and titanium dioxide can selectively absorb harmful radiation and reduce material ageing (Wallner et al., 2017); in the presence of moisture, however, it can act as a photo-catalyst increasing degradation (Richaud, 2014). There are even pigments which almost exclusively have negative effects on light stability, especially red pigments (Klemchuk, 1983). Research on the influence of pigments and other nanoparticles, like carbon nanotubes (Yousef et al., 2016) or organoclay (Jose and Alagar, 2011), on the mechanical and tribological properties also show no general trends. Particle material, size and dosage highly influence whether nanoparticles have beneficial or disadvantageous effects (Wacharawichanant et al., 2012).
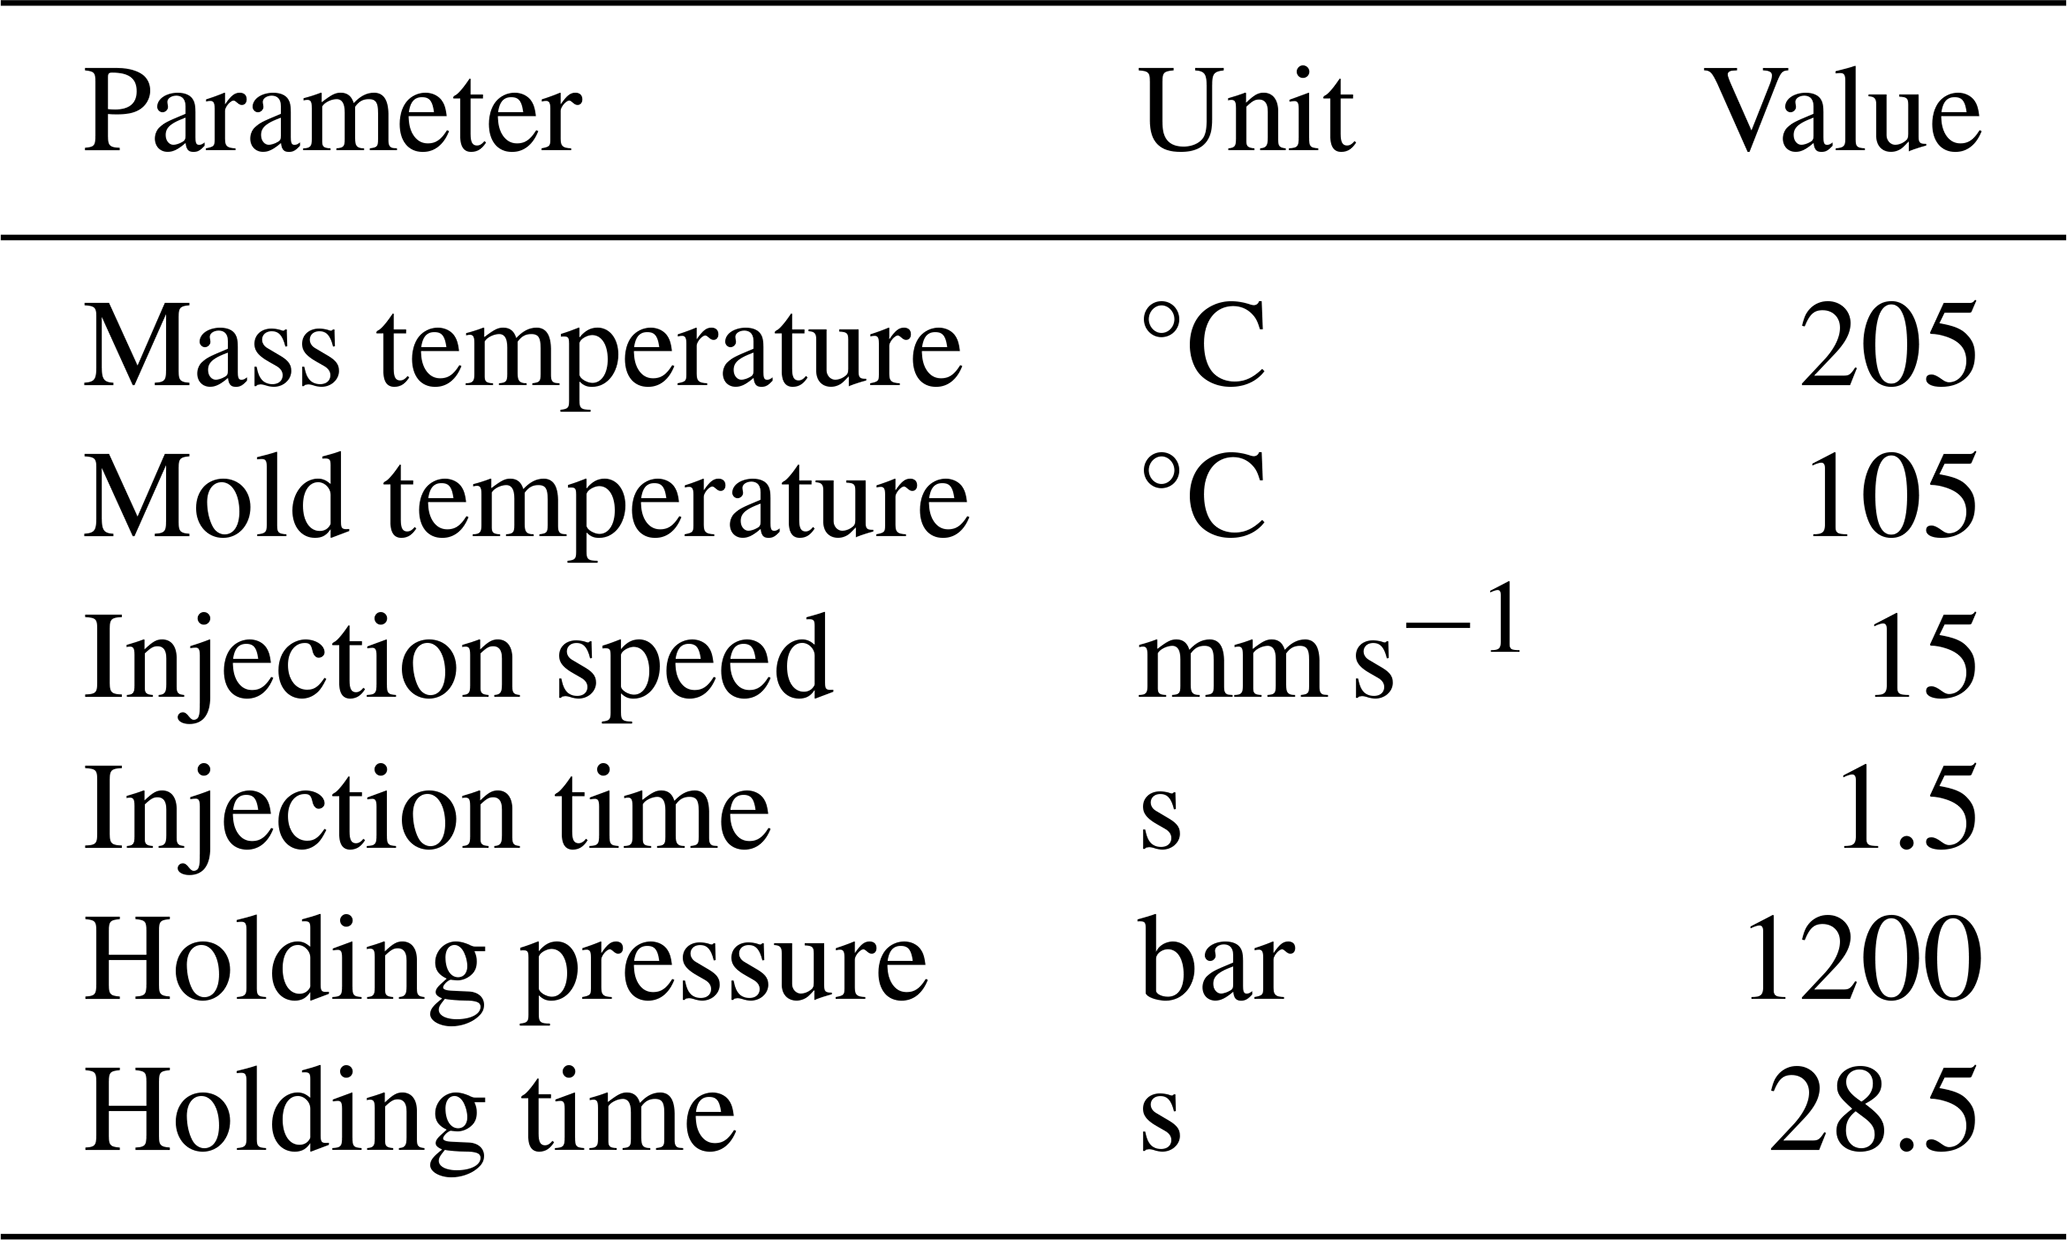
To exclude influences of carrier materials, two pigment-based colourants were chosen for this research. The pigments were added by means of direct compounding in order to achieve a non-translucent, low-gloss surface with homogenous pigment distribution to improve the optical properties of the gear specimens for further optical measurements. The following pigments were used: a white titanium dioxide (TiO2) pigment of the type Dei®Pow – Weiß (Fig. 2, right), provided by Deifel GmbH & Co. KG, Schweinfurt, and a pigment mixture in the ratio of 1:1 of the (Ti, Cr, Sb) O2 pigment with a carbon black (C) pigment of the type Dei®Pow – Spezialschwarz (Fig. 2, left), also provided by Deifel GmbH & Co. KG. An injection moulding machine of the type Arburg 370 U-700-30-30 with a plasticizing unit with an 18 mm screw diameter by Arburg GmbH & Co. KG, Loßburg, Germany, was used to produce the gear specimens. Table 1 shows the processing parameters used for manufacturing.
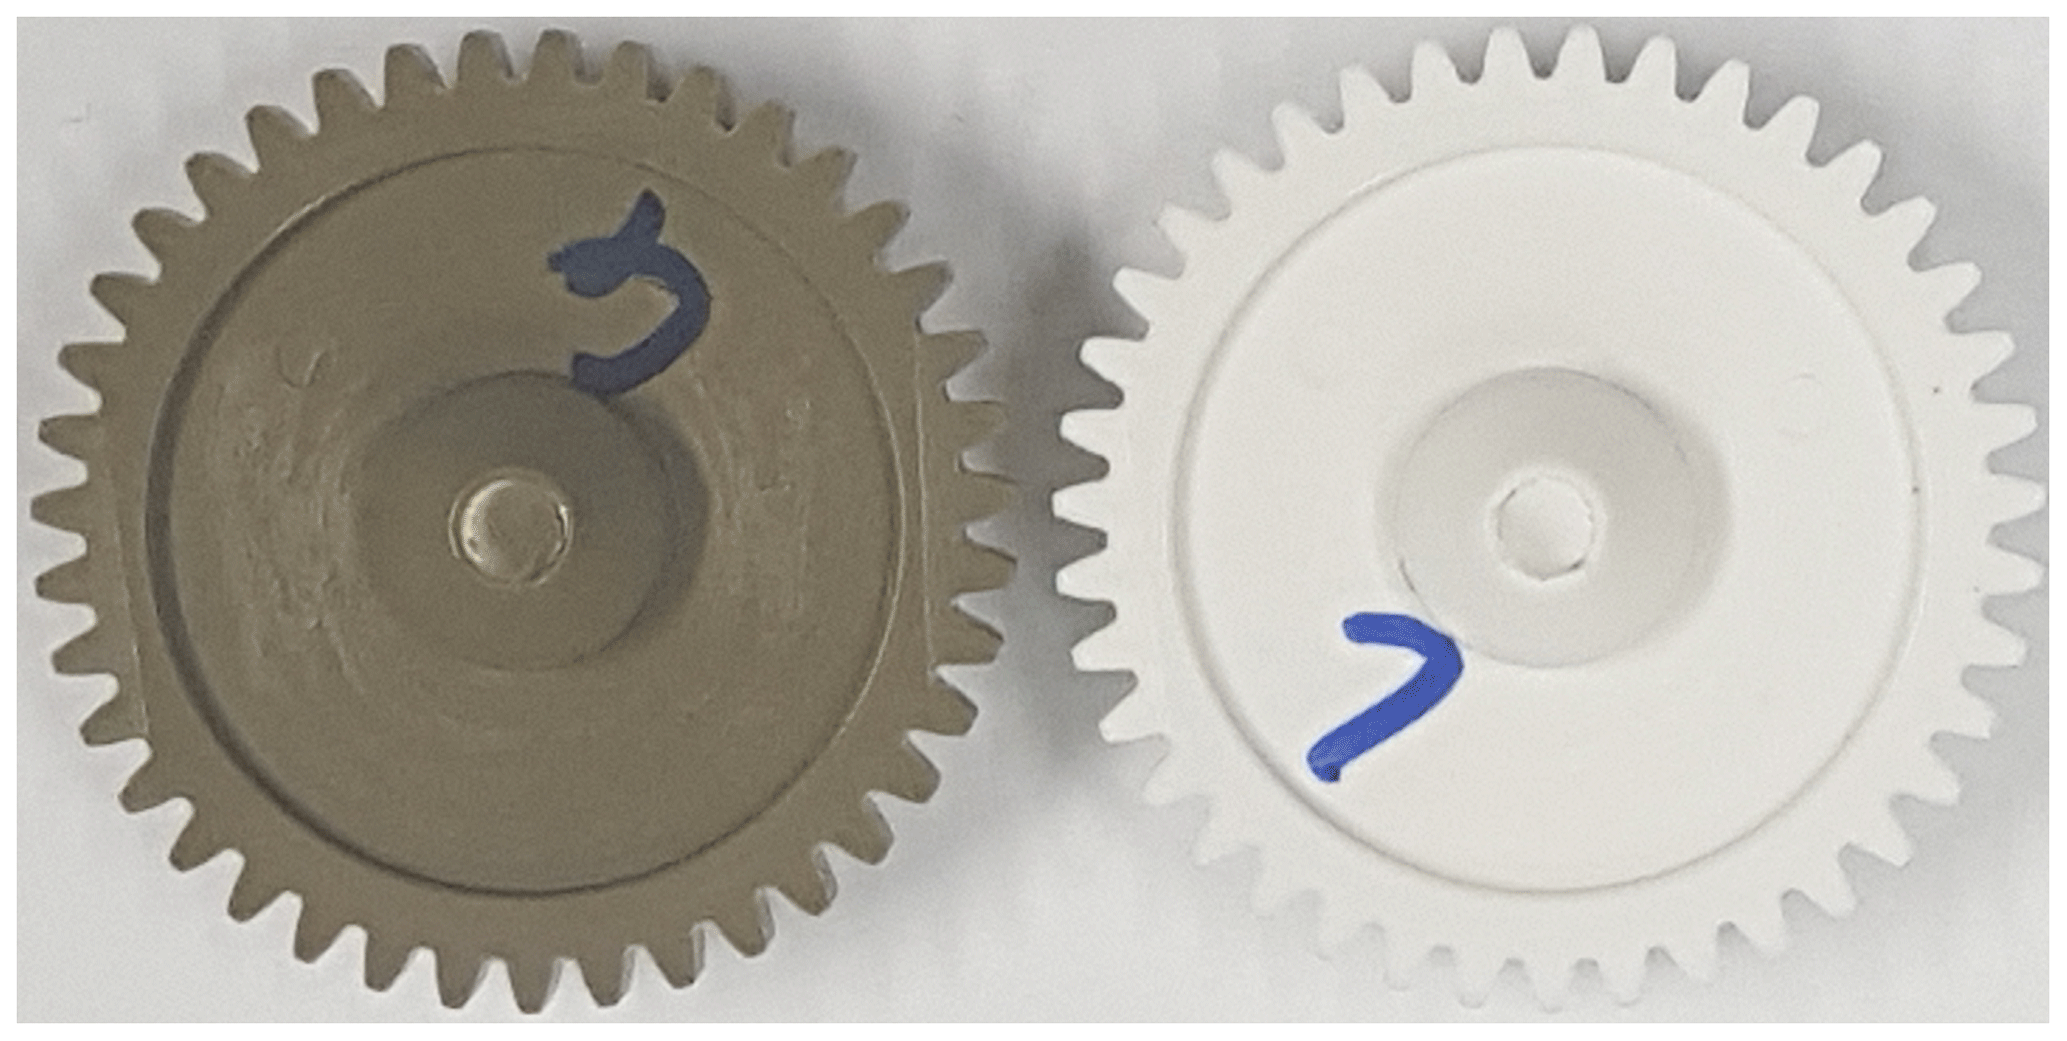
Figure 2Coloured gear wheels: IDDG (identifier dark green, left) and IDW (identifier white, right).
The goal of this paper was to evaluate the locally distributed single point uncertainties for gear wheel measurements using a structured-light scanner. The used system was GOM ATOS CORE 200 5M (GOM GmbH, 2019) in combination with a rotatory stage (Fig. 3). The sensor was controlled by the GOM ATOS Professional 2018 software (GOM GmbH, 2018). The internal settings for the sensor were set to the least restrictive options possible, thus making sure that as many surface points as possible were recorded during the measurement. The illumination settings were determined by user-controlled selection of a target of interest on the live image once before each measurement series. During the measurements, all external light sources in the laboratory were dimmed to a minimum in order to ensure the exclusive illumination by the measuring device. The measurement object (gear wheel) was mounted onto the rotatory stage through its accessible rotatory axis. The used bracket was equipped with reference markers, which enabled the GOM ATOS Professional 2018 software to perform the referencing of each image with the angular position of the rotatory stage. The sensor is characterized by the following key data: measuring range 200×150 mm2, lateral resolution 80 µm, measuring distance 250 mm and native camera resolution 5 million pixels. Before measurement, the sensor was calibrated using the CP40 170 40760 calibration plate consisting of 3657 calibration points. A single measurement consisted of 200 single images (projections), which were equally distributed over a full rotation (360∘) of the rotatory stage, with two different sensor positions each: one position captured the gear wheel sloping from above the gear wheel and the other from below, with both angles roughly equalling 45∘. As soon as all images were recorded from that position, the scanner was manually moved to the second position and the second set of 200 projections was recorded. The mounting of the measurement object (including the reference markers) was only done once and therefore not altered during the recording of all measurements. The reference markers were visible to the scanner from both senor positions, which made the data fusion of several image stacks possible. Thus, the GOM software merged all of the 400 images (200 for each sensor position) together into one surface representation of the gear wheel in a triangulated mesh format (STL). Each measurement was repeated 20 times to ensure a statistically valid result for the following single point uncertainty calculations. During the polygonization routine, which is required to transform the (point cloud) measurement data into the desired measurement result (surface data in the form of a triangle mesh), the GOM software offers five different polygonization settings, which differ in the number of surface points and thus (implicit) filtering of the measurement data: no post-processing, more details, standard, less details and smallest data volume. A reduction of the surface point density is problematic if additional measurement errors are introduced because of the reduction of the information density. But on the other hand, an unnecessary high point density can lead to increased computation requirements without adding to the quality of the measurement data. A perfect polygonization routine would implicitly (locally) filter out all spatial frequencies, which are higher than the (local) structural resolution of the measurement system. Both measurement series were processed with each of the five quality settings in order to be able to examine the effect of the polygonization routine on the observed measurement uncertainty. The measurements were performed in a temperature-controlled environment with temperatures set to 20 ∘C ±1 K. Overall, two different gear wheels were examined, and thus 40 single measurements (each with two sensor positions) were performed. Both required reference measurements were captured using the Zeiss Metrotom 1500 industrial X-ray computed tomography system (Carl Zeiss Industrielle Messtechnik, 2019). The gear wheel was positioned on the rotatory stage of the CT system using the bracket already presented in Fig. 3. The upper part of the bracket consisted of polymer, which was easy to penetrate by X-rays and did not lead to CT-specific sources of errors due to a possibly high material density. CT systems are in general very well suited for measuring polymer parts with high accuracy. To ensure a high-quality measurement, lengthy device settings were chosen in order to guarantee a very low measurement uncertainty of the reference measurement system. Because of the fact that the polymer colouration had no measurable impact on the absorption properties of the measurement object, these following settings were used for both reference measurements: tube voltage 150 kV, tube current 400 µA, resulting nominal focal spot size 60 µm, X-ray filter 0.5 mm Cu, geometrical magnification 9.0, resulting voxel size 22.3 µm, integration time 1000 ms, number of projections averaged 10, number of projections per measurement 2050. The required surface determination was performed using VGStudio Max 3.2 (VGS) (Volume Graphics GmbH, 2019) using the settings automatic grey value threshold, search distance 16 voxels, remove all particles and voids, and iterative surface determination. The measured surface was then exported as a triangle mesh in the STL format using high-quality settings. The measurement was subsequently registered against the nominal geometry (CAD) using VGS. Finally, the gear sprocket was extracted from the full surface using our own MATLAB program by removing all triangles with an edge point distance to the rotatory axis of smaller than 16 mm. The authors are aware of the fact that an industrial CT system might not necessarily show improved measurement uncertainty characteristics for all applications compared to a structured-light scanner. Nonetheless, these measurement devices were chosen to demonstrate the principle approach for the determination and evaluation of the single point uncertainty framework as a tool in dimensional metrology.
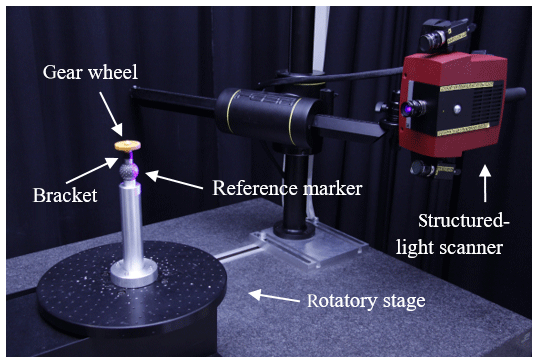
Figure 3Figurative representation of the measurement setup, consisting of a structured-light scanner (here GOM ATOS Compact Scan 2M/300) in combination with a rotatory stage.
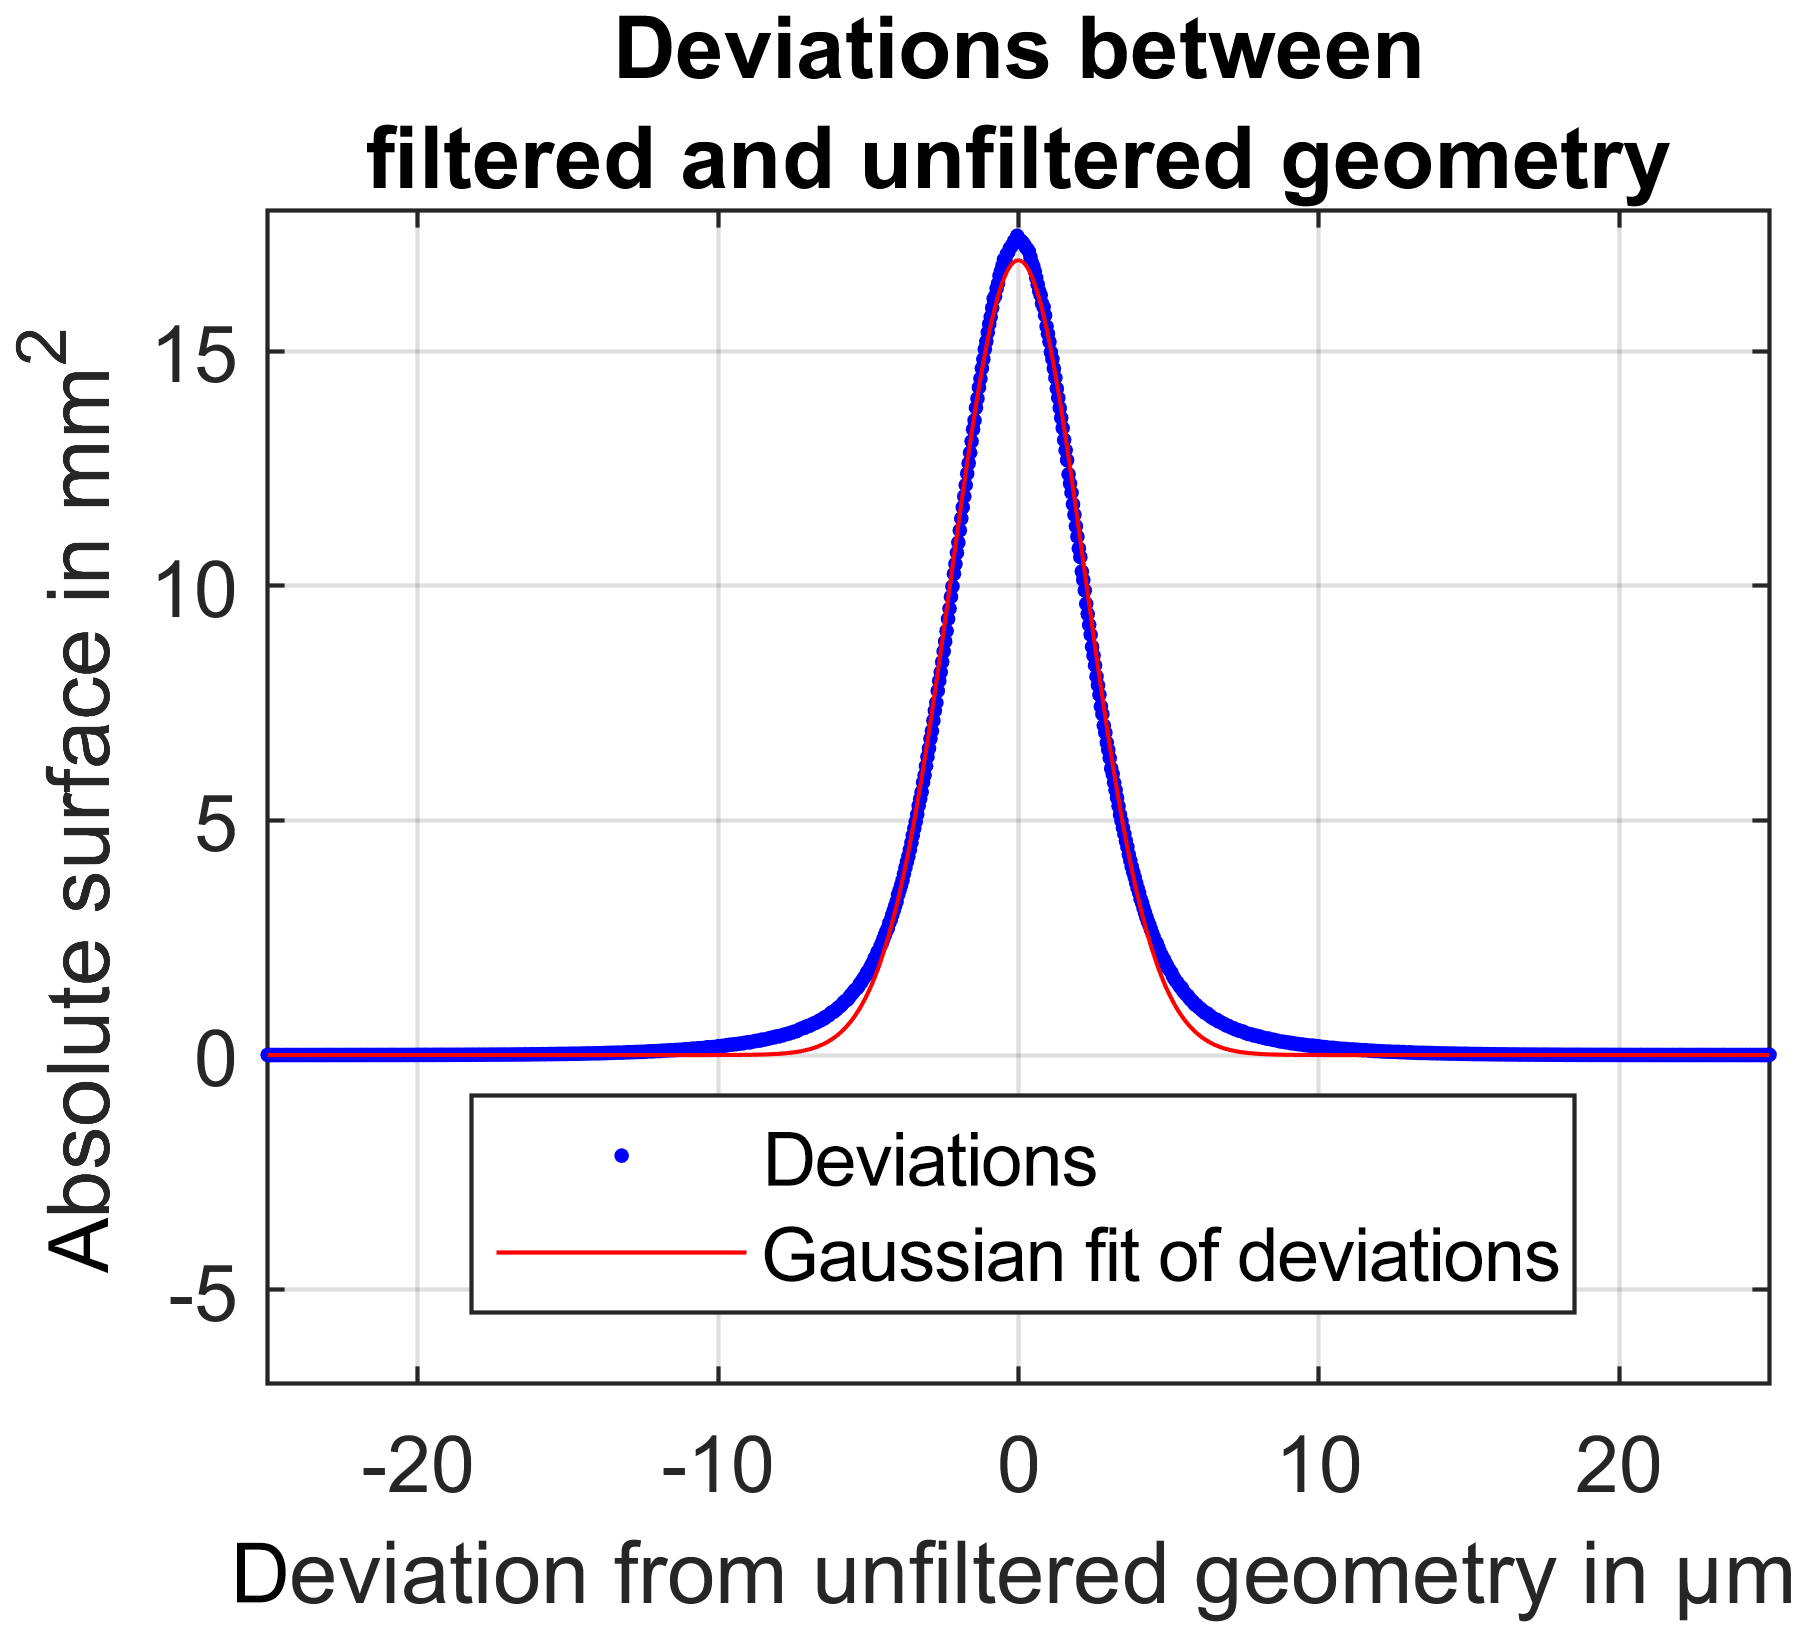
Figure 4Examination of the geometry-altering mesh operations using a nominal–actual comparison and a Gaussian fit.
As mentioned above, the sampling strategy normal vector requires trustworthy sampling vectors in order to compute the metrologically correct distances. CT measurements are often subject to high-frequency noise with location wavelengths considerably higher than the structural resolution of the measurement system. In order to remove very high spatial frequencies and to improve the triangle mesh properties regarding triangle edge size and homogeneity, the generated surface of the reference measurement was undertaken with a post-processing routine using GOM ATOS Professional 2018. First, the mesh was smoothed using the Mesh → Smooth… operation with settings very large filter radius, very low detail sharpness and surface tolerance 10 µm. After that the homogeneity of the surface point distribution was improved using the Mesh → other → Regularize… operation with settings surface tolerance 10 µm and maximum edge length 50 µm. Of course these kinds of operations need to be used with special care, because any filtration of the reference measurement results in altered uncertainty values for the examined structured-light measurement device. Because of that, the effect of the described mesh operations was investigated further by comparing the filtered mesh against the unfiltered mesh using a conventional nominal–actual comparison (VGS). Figure 4 shows that the deviations between the filtered and unfiltered geometry nearly form a perfectly shaped Gaussian distribution with the expected value μ=0. The comparison against the regression result of the deviations using a Gaussian model confirms the underlying normal distribution. Consequently, we can state, following the central limit theorem (Hazewinkel et al., 1988), that the removed part of the geometry consists of noise. Consequently, it is part of the random measurement error. Because of that, and because of the fact that the removed parts of the geometry due to the filtration are clearly below the voxel size (22.3 µm) and the X-ray focal spot (60 µm) of the CT system, it is stated that no relevant measurement information of the geometry form was removed by the mesh post-processing operations. After the post-processing of the reference geometry, each of the 20 measurement repetitions was registered against that reference measurement using VGS. Following a first rough alignment, the rotatory symmetry was dissolved by arrangement of the drilling in one of the tooth roots. The geometrical registration was finalized by a fine registration using the quality level 50 and consider current transformation settings. Then the gear wheel sprocket was extracted by removing all triangles with an edge point distance to the rotatory axis of smaller than 16 mm (same procedure as for the reference measurement before). This step reduces the overall number of processed triangles during the calculation of the single point uncertainty and is justified because the gear wheel sprocket was targeted for the dimensional investigations. Figure 5 shows the alignment of each single measurement with the reference geometry. It is clearly observable that the drillings in each mesh lie on top of each other (top region in the figure), thus confirming a valid registration result. After that, the geometric deviations of the measurement object were calculated by determining the distances from each sampling point SPk of the reference geometry to the nominal geometry using the shortest distance sampling strategy. (These results are not used further in the subsequent evaluations, because they are not part of the measurement uncertainty. Nonetheless, these findings can be exploited in different usage scenarios.) Then, the single point uncertainty was calculated by determination of the distances from each of the same sampling points SPk on the reference geometry to each of the measurements of the measurement series using the normal vector sampling strategy (as described in the first chapter). Finally, each sampling point SPk was associated with a value describing the local geometrical deviations of the measurement object t and a (mathematical) set dk characterizing the local measurement uncertainty.
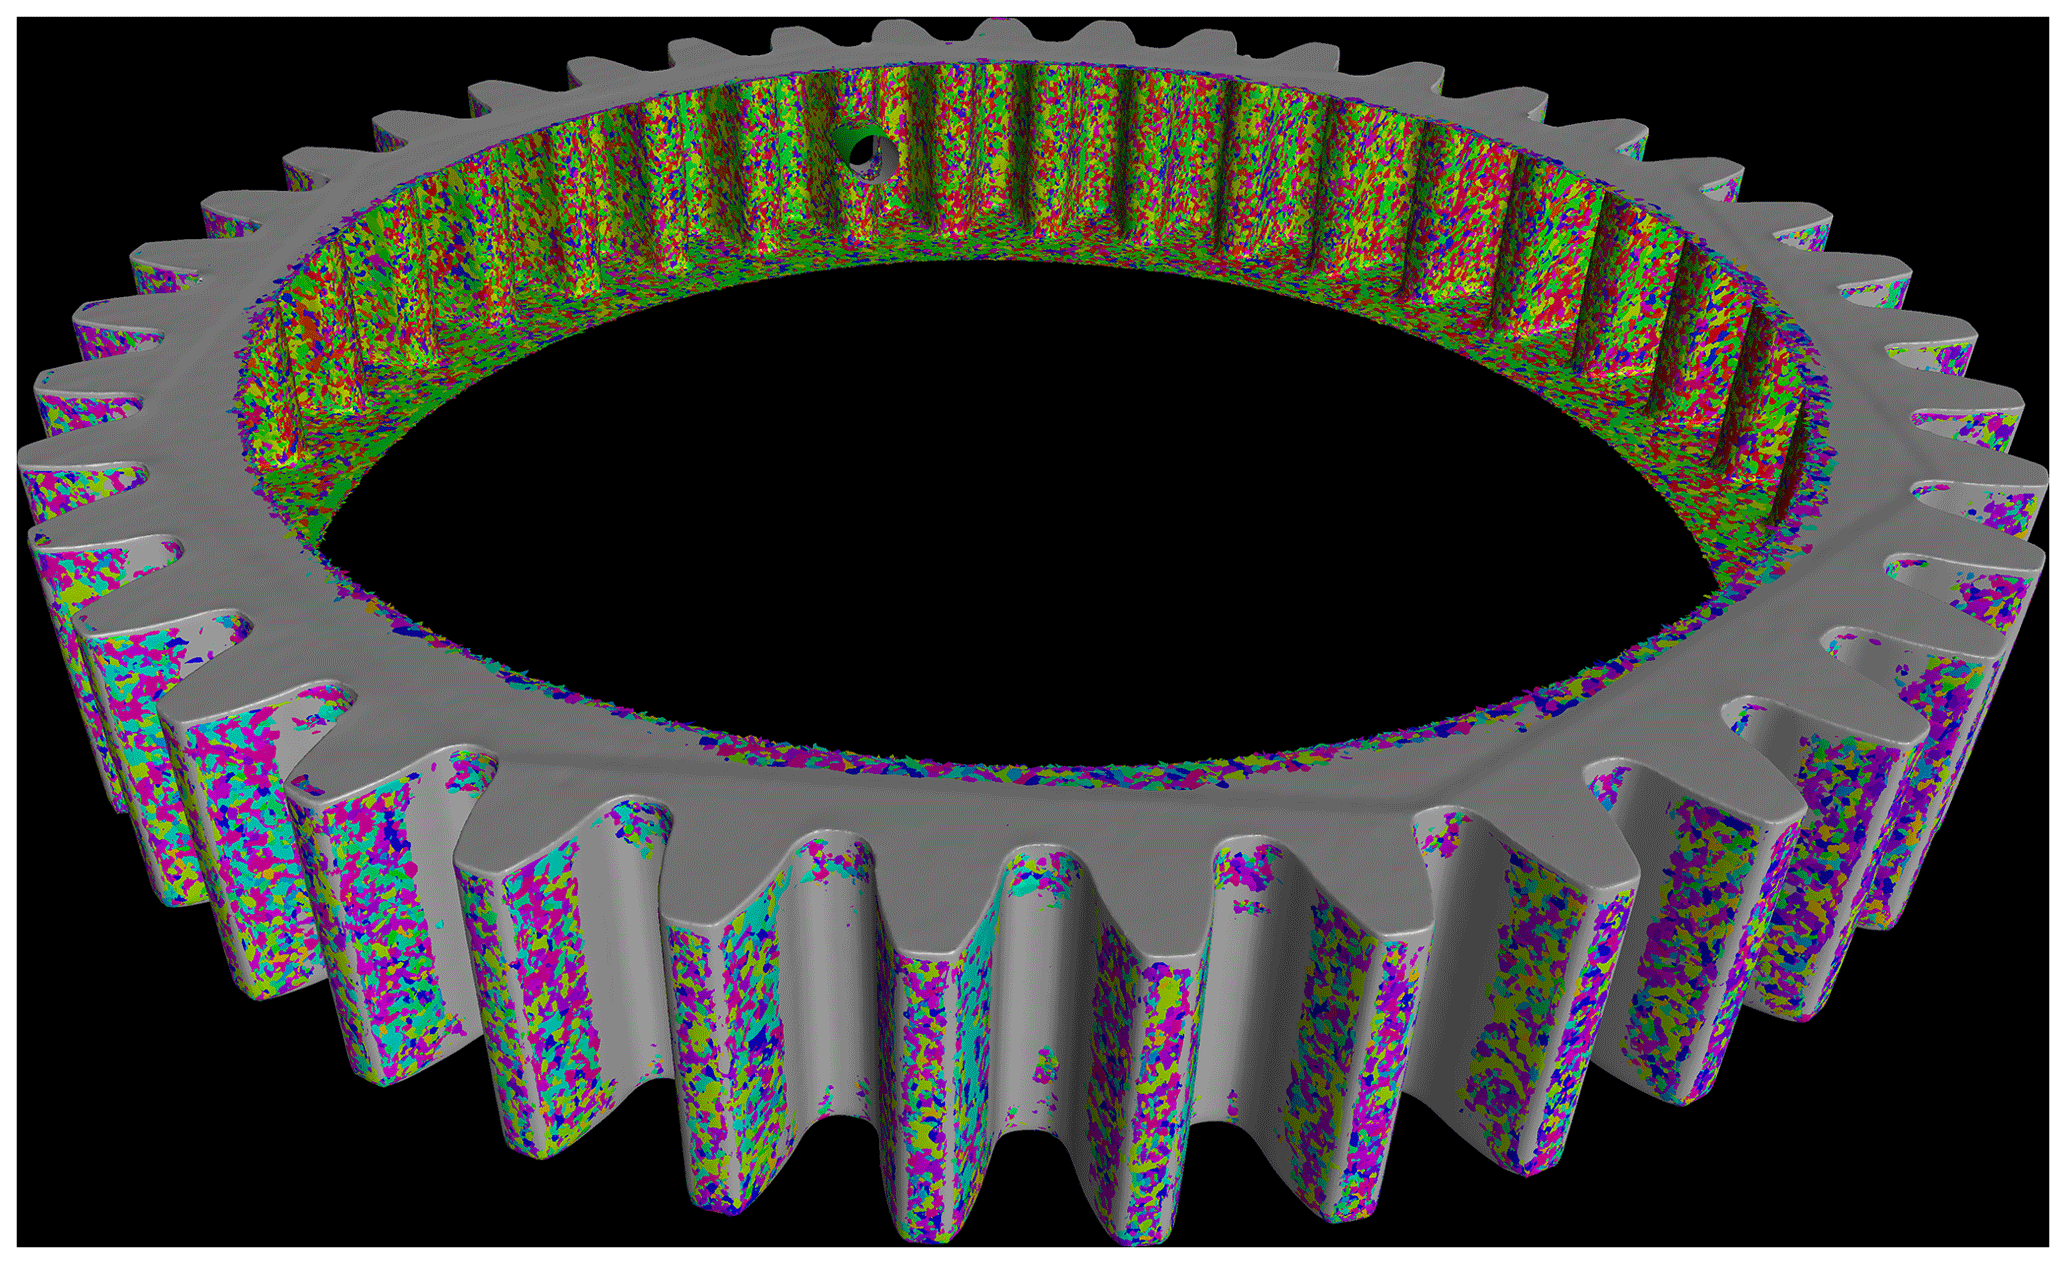
Figure 5Alignment of the sprocket of the reference geometry (grey) and the 20 measurement repetitions (various colours) after the registration routine.

Figure 6 shows the expanded measurement uncertainty with a coverage factor of k=2 for the gear wheel measurement using a structured-light scanner as well as a white colour additive (IDW) combined with the no postprocessing polygonization option. The expanded uncertainty is calculated by the quadratic sum of the systematic measurement error and the standard deviation of the random measurement errors and is then multiplied by a (positive integer) coverage factor k (Eq. 1) (Härtig and Krystek, 2008, Eq. 11).
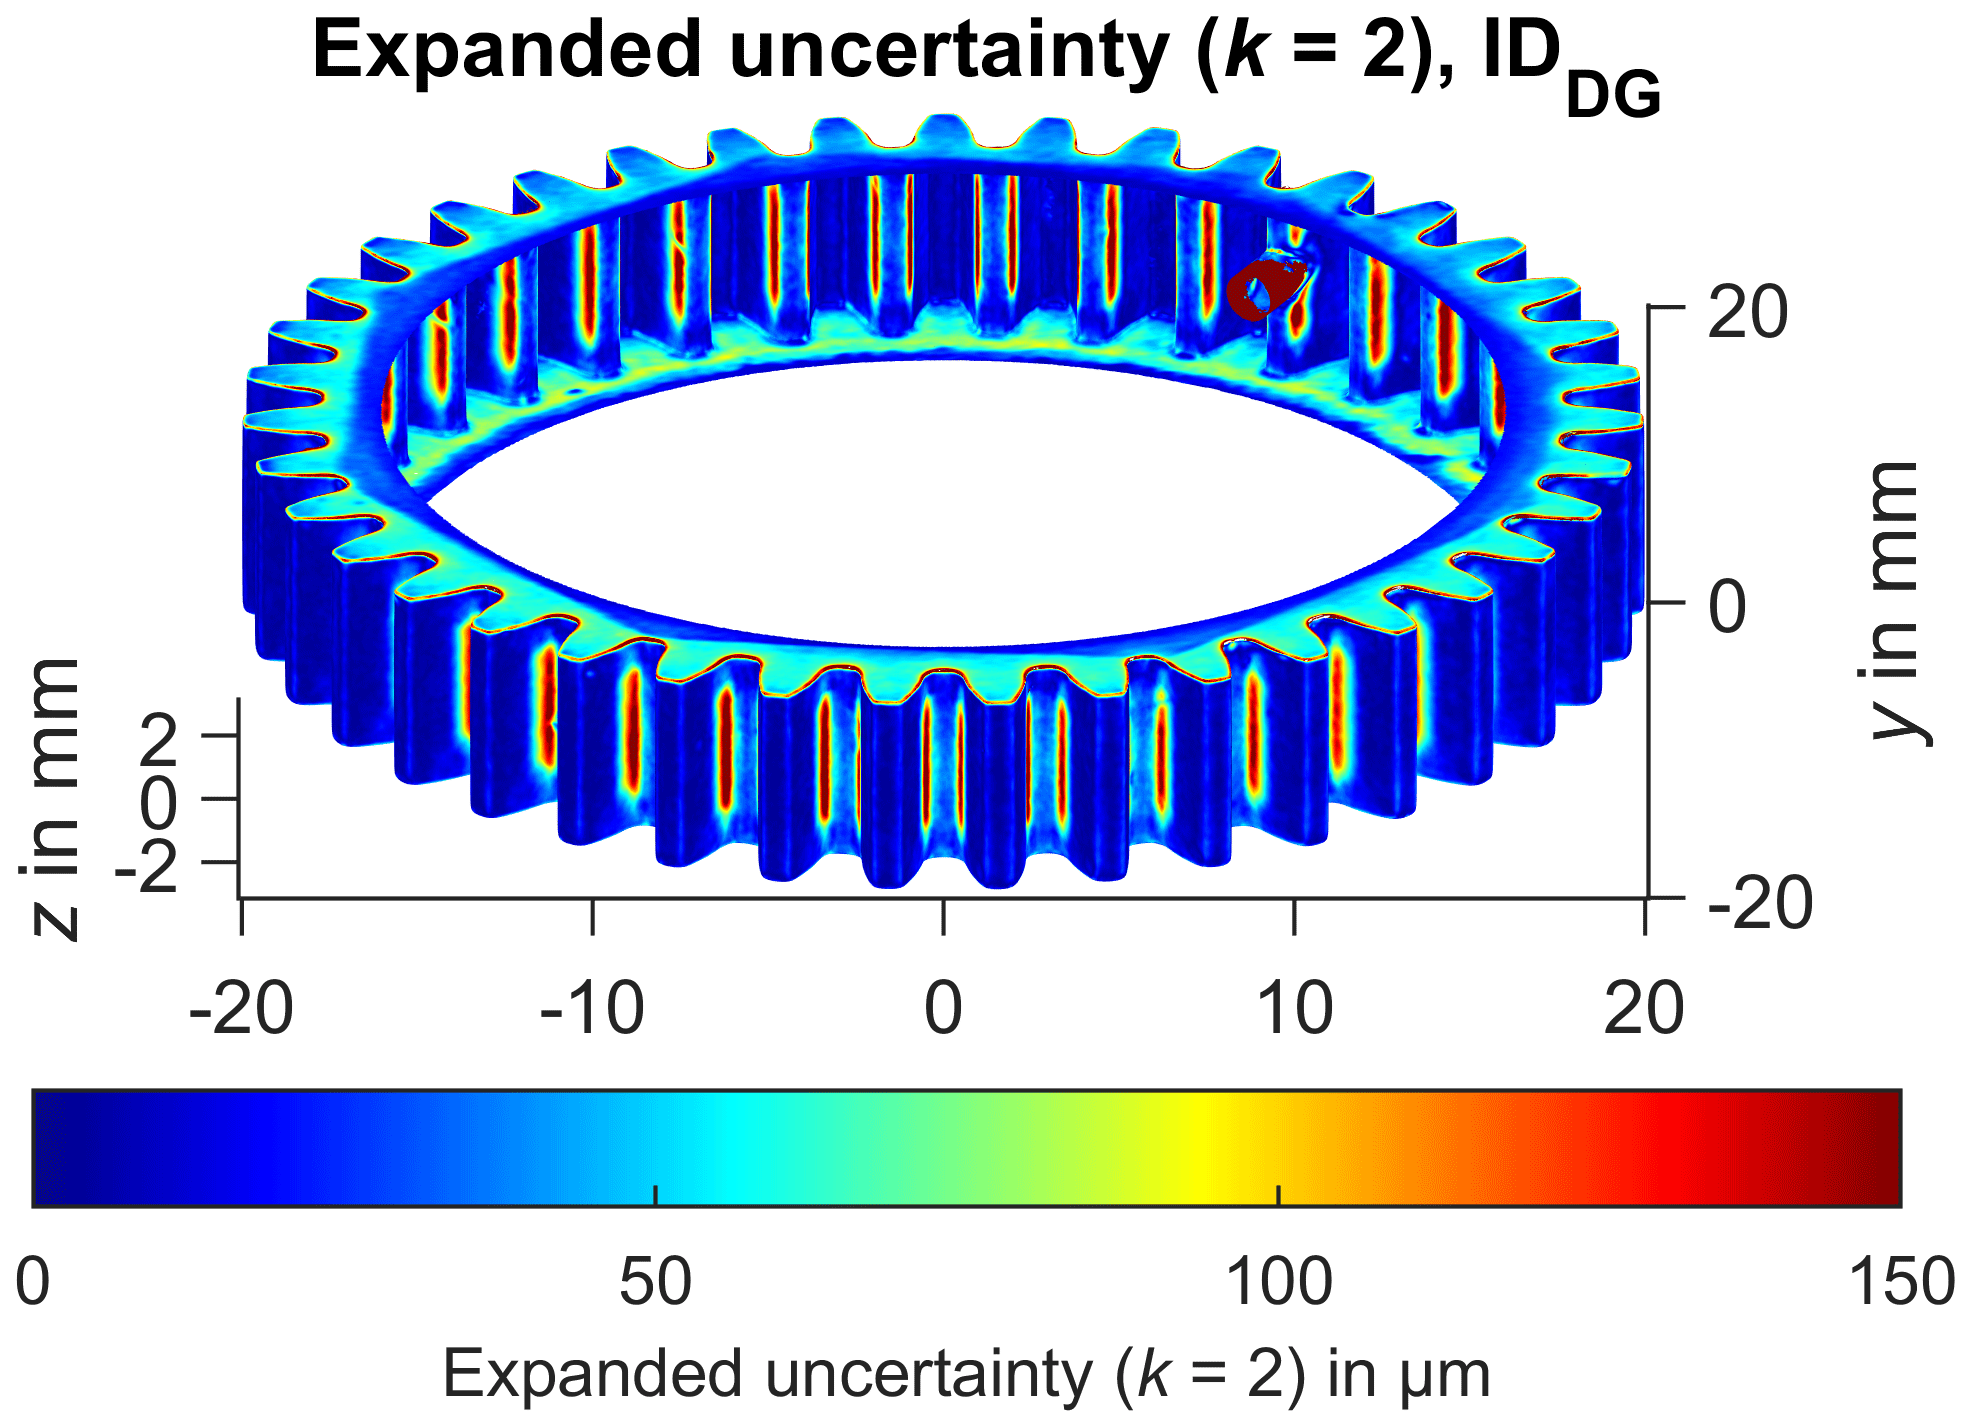
A coverage factor of 2 results in having a level of confidence of approx. 95 %, assuming a normal distribution (, ). The findings in Fig. 6 show that the limited optical accessibility of the gear roots resulted in a substantial increase in the expanded measurement uncertainty over 100 µm. The gear wheel side also exhibits a larger measurement uncertainty because of the angled image capturing. The upper parts of the gear flanks and the tooth tips were measured with a comparably low expanded measurement uncertainty significantly below 50 µm. Figure 7 shows the expanded uncertainty (k=2) for the evaluated measurement series of gear wheel IDDG. It can be seen that the measurement uncertainty is slightly lower (more dark blue regions) compared to gear wheel IDW. The gear roots are also characterized by a lower measurement uncertainty. The visual examination of the distribution of the measurement uncertainty can be used subsequently to validate a given measurement strategy.
Next, the effects of the tested polygonization settings during the measurement data evaluation are demonstrated. The numbers of unique vertices used to build the triangle meshes of the measurement repetitions are given for both measurement series IDDG and IDW in Tables 2 and 3, respectively. Even though the shape of the measured gear wheel geometry is not changed, the number of vertices and triangles is different for each polygonization setting. This possible impact was the target of the subsequent investigations.
Table 2Statistical overview of the number of vertices of the different triangle meshes for measurement series IDDG. The number of vertices (sampling points SPk) of the used reference geometry is 1 935 969.
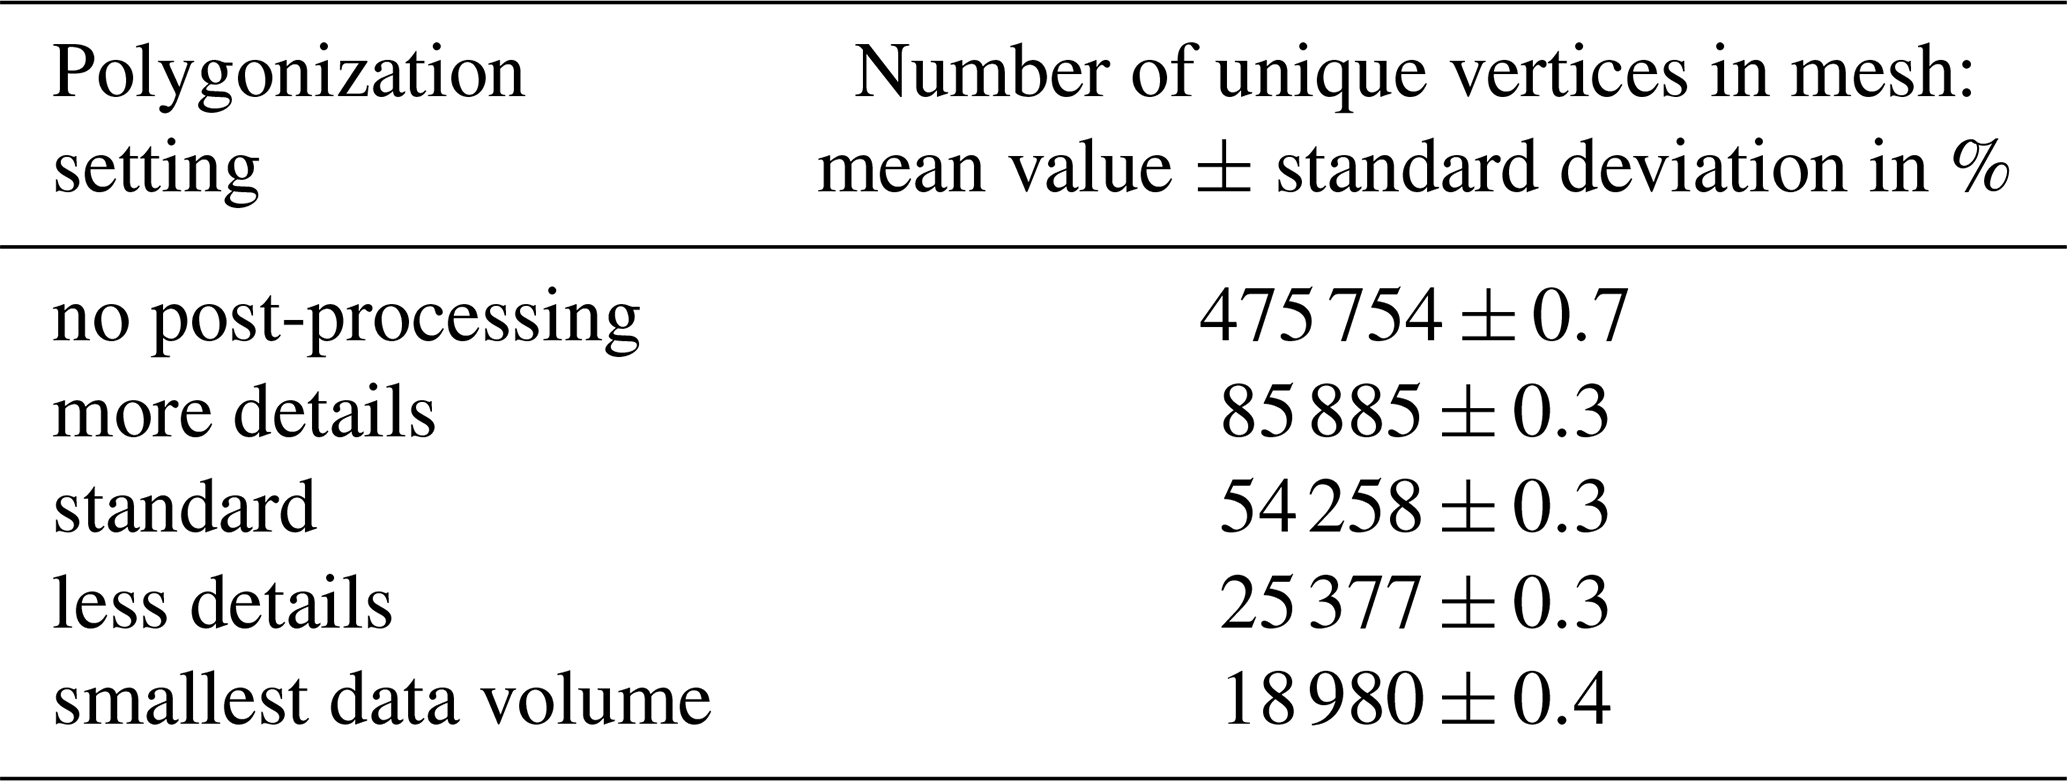
Table 3Statistical overview of the number of vertices of the different triangle meshes for measurement series IDW. The number of vertices (sampling points SPk) of the used reference geometry is 1 930 759.

The following results give a statistical overview of the consequences of using different polygonization settings during the measurement data evaluation. The analysis of the systematic measurement error shows only marginal differences between the different polygonization settings (Fig. 8). Nonetheless it is important to note even though the observable differences are small, those errors are introduced purely based on the data processing pipeline. The comparison between both measurement series indicates that distributions of the calculated systematic measurement errors vary slightly. This was purely caused by the different colour additives because the manufacturing process parameters as well as the measurement setup and the data processing pipeline were chosen identically for both variants. Consequently, both the colourant and the polygonization settings do have an impact on the observed systematic measurement errors.
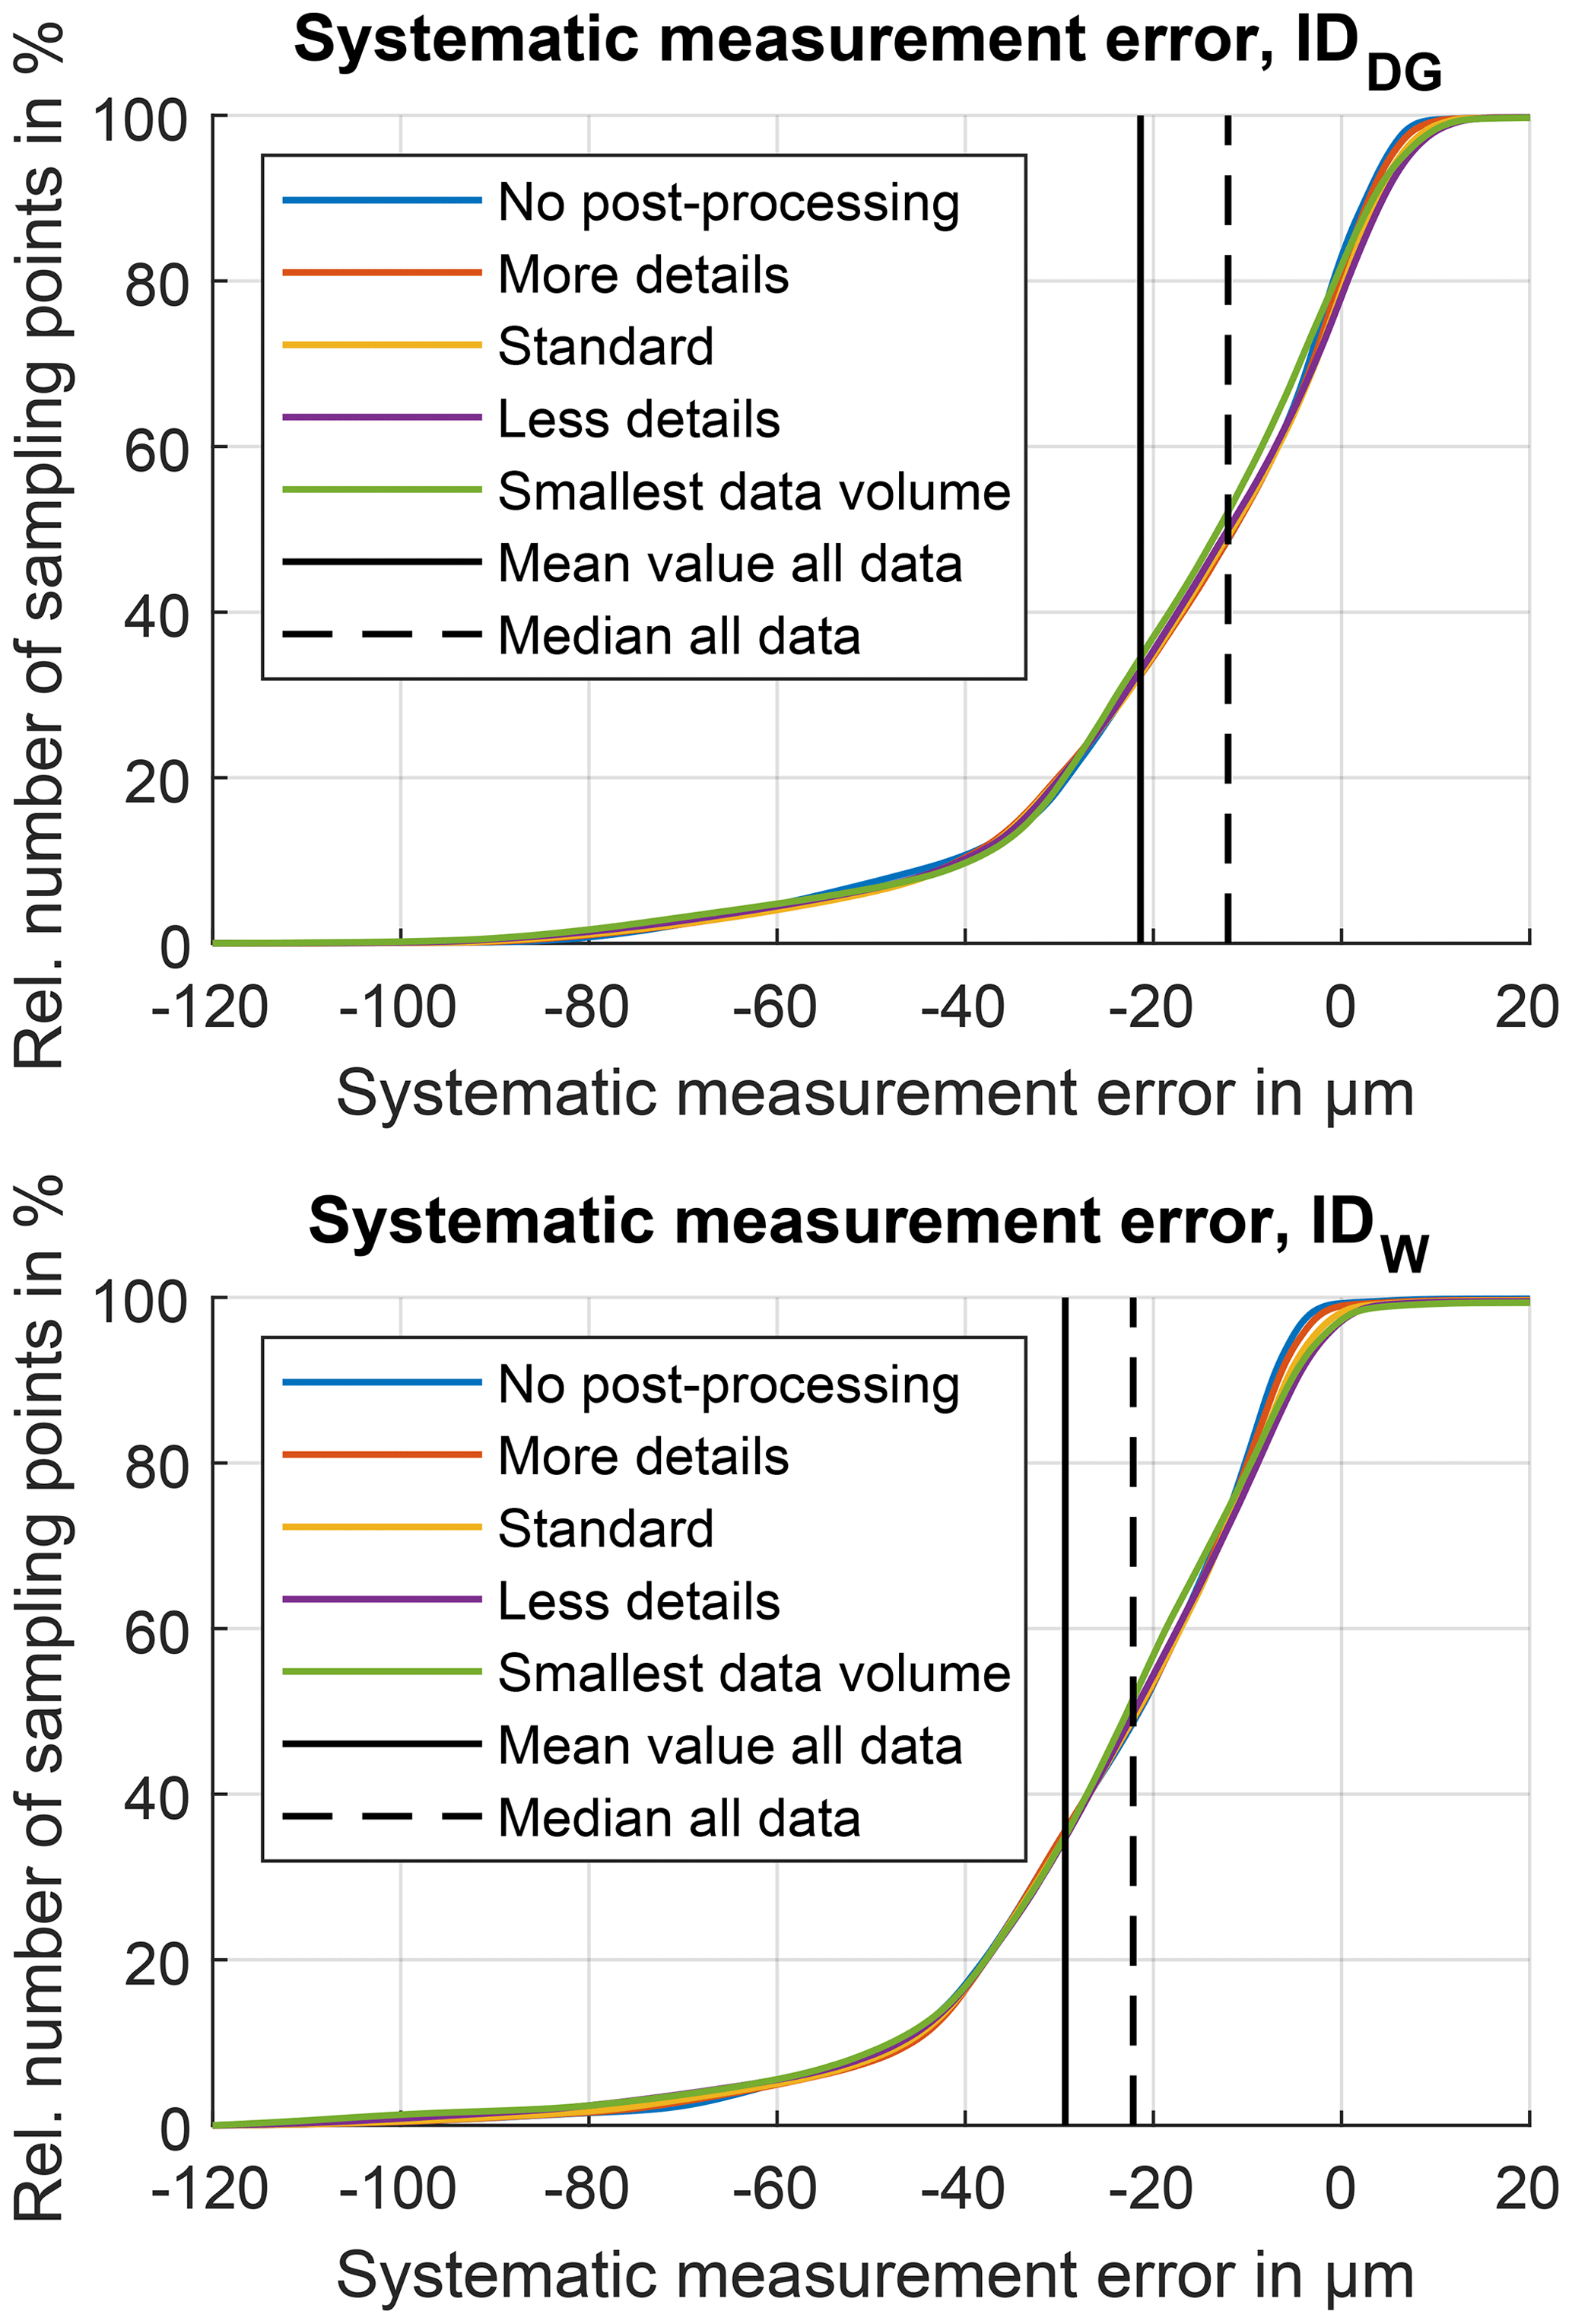
Figure 8Cumulative visualization of the systematic measurement errors for different polygonization settings for both gear wheels IDDG and IDW.
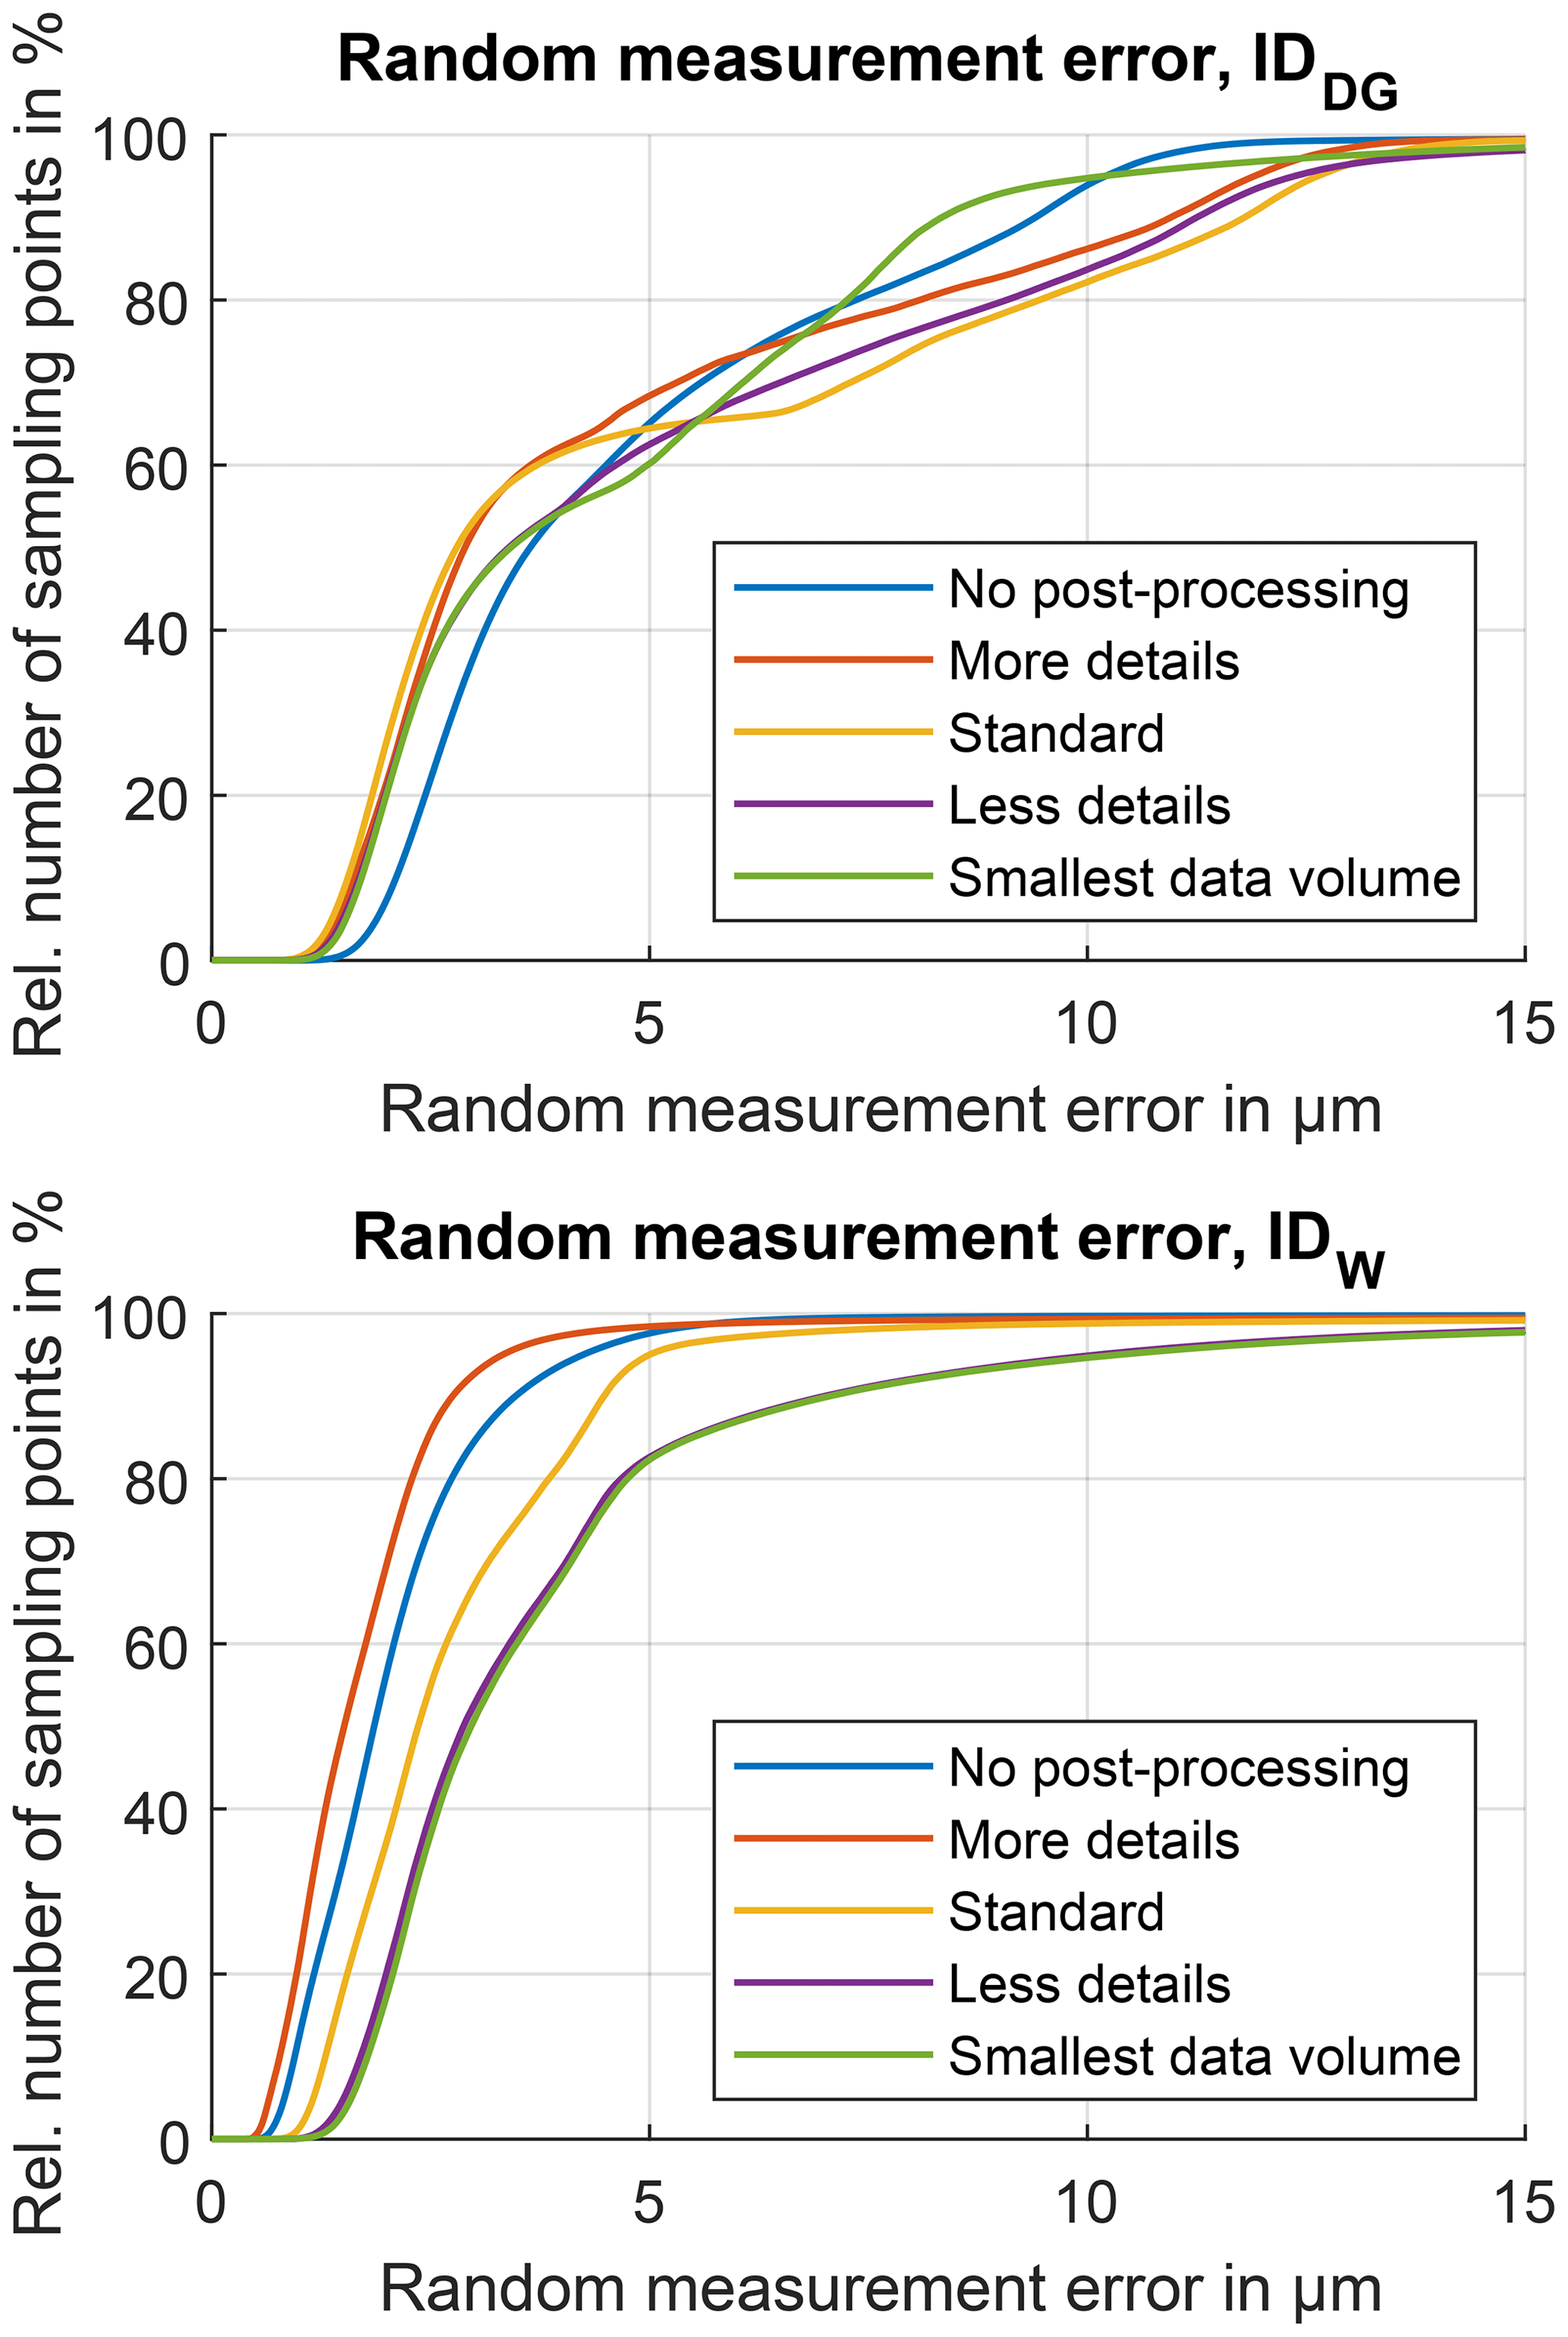
Figure 9Cumulative visualization of the random measurement errors for different polygonization settings for both gear wheels IDDG and IDW.
The evaluation of the random measurement error shows different characteristics for both measurement series: there is no clear correlation between the polygonization setting and the random measurement error observable for gear wheel IDDG (Fig. 9). This is not the case for the second series, where a clear distinction between the different settings is visible. The more details option results in slightly lower error statistics than the no post-processing option, which indicates the successful filtration effect of the reduced polygon count. A further reduction of the vertex count using the standard, less details and smallest data volume settings leads to a continuous increase in the random measurement errors in that named order. Thus, there is a (non-trivial) optimum regarding the polygonization setting, which is different from the maximum possible number of polygons. The settings should be chosen taking into account the desired structural resolution.
It was shown that the optical measurement of POM gear wheels using structured-light scanning can in principle be realized by colouration during the manufacturing process. This was demonstrated by means of two prototypes with different colourizations. It was also observed that the measurement uncertainty varies on the measured surfaces when comparing both differently colourized gear wheels. This is possibly influenced by the different optical properties of the surface resulting from the colouration process in interaction with the illumination and camera system used by the measurement system. Furthermore, the limited optical accessibility of the tooth roots presumably leads to increased uncertainty values. This confirms that a global illumination setting during the measurement is not optimal for all geometrical features of the gear wheel and that the resulting effects on the local measurement uncertainty can in fact be investigated using the single point uncertainty framework. Although a complete measurement was possible, the achieved expanded measurement uncertainties might be insufficient nonetheless, depending on the targeted tolerance requirements. Depending on the defined tolerances for different geometrical features on the polymer gear wheels surface, the golden rule of metrology might prevent the geometrical inspection of those gear wheels using structured-light scanners. The measurement uncertainty could potentially still be reduced for the presented measurement system by increasing the number of sensor positions and introducing additional illumination settings, but the measurement expense would then rise quite substantially. Alternatively, a scanner with a smaller measurement range could be used. It is worth noting that the calculated precision of the measurements was very good compared to the systematic measurement error. This could possibly be caused by extensive averaging of measurement data due to the high number of recorded projections. The examination of different polygonization settings showed very little effects on the statistical distribution of the systematic measurement errors for the given test scenario. A reason for that is possibly the absence of high spatial frequencies on the tested geometry, which could implicitly be filtered out by a strong reduction of the polygon density of the mesh representation. In contrast to that it was shown that the random measurement errors are affected differently by the tested polygonization settings when comparing both colourization options. This resulted in a possible selection of the non-trivial optimal setting (more details) for the measurement series IDW. Lastly it is noted that the used reference measurement setup (CT) also exhibits some kind of measurement uncertainty, which was not taken into account within this paper. A more accurate determination of the single point measurement uncertainty of structured-light scanners using CT as a reference measurement system must also take this error source into account.
The presented work demonstrated the possibility of a better understanding of a specific measurement setup regarding the achieved measurement uncertainty. It is not uncommon in industrial applications that a single measurement setup is operated to monitor the output of a production line. The demonstrated examination of the effects of different polygonization settings makes it possible to also take into account subsequent data processing operations within the complete measurement chain. Additional benefits can especially be created by taking into account the locally different measurement uncertainty within the scope of weighted regression analysis of standard geometry elements. Further research efforts could be invested to determine improved colourization options in order to find optimally coordinated optically imaging mechanisms between the gear wheel surface and the projected light of the structured-light scanner.
In this paper, we present a methodology to determine the single point uncertainty of polymer gear wheels using structured-light scanning. The algorithms used for this purpose, the parameters for the generation of the measurement data and all data processing steps are described in detail in the paper. Additionally, publications cited in the paper describe the algorithms used to determine the single point uncertainty. Thus, all information needed for a reproduction of the presented results is available to the interested reader.
AMM contributed to conceptualization, data curation, formal analysis, funding acquisition, investigation, methodology, software, validation, visualization, writing the original draft, writing the review and editing. DS and DD contributed to conceptualization, methodology, funding acquisition, project administration, resources, supervision, validation, writing the original draft, writing the review and editing associated with Sect. 2 as well as the production of the examined gears. TH contributed to conceptualization, funding acquisition, project administration, supervision and writing the review and editing.
The authors declare that they have no conflict of interest.
This article is part of the special issue “Sensors and Measurement Systems 2019”. It is a result of the “Sensoren und Messsysteme 2019, 20. ITG-/GMA-Fachtagung”, Nuremberg, Germany, 25–26 June 2019.
The authors would like to thank the German Research Foundation (DFG) for supporting the FOR 2271 process-oriented tolerance management based on virtual computer-aided engineering tools research project under grant nos. HA 5915/9-2 and DR 421/21-2 and for the financial support of the acquisition of the Zeiss Metrotom 1500 CT system through grant no. 324672600. The authors would like to thank the Celanese Crop., Deifel GmbH & Co. KG Buntfarbenfabrik and BASF Pigment GmbH companies for providing research materials.
This research has been supported by the Deutsche Forschungsgemeinschaft (grant nos. HA 5915/9-2 and DR 421/21-2).
This paper was edited by Sascha Eichstädt and reviewed by two anonymous referees.
Berndt, G., Hultzsch, E., and Weinhold, H.: Funktionstoleranz und Meßunsicherheit, Wissenschaftliche Zeitschrift der Technischen Universität Dresden, 17, 465, 1968. a
Brinkmann, B.: International vocabulary of metrology: Basic and general concepts and associated terms (VIM) German-English version ISO/IEC-Guide 99:2007, Corrected version 2012, Beuth Wissen, Beuth, Berlin, 4, aufl. edn., 2012. a
Carl Zeiss Industrielle Messtechnik: 3D Röntgenmessung in der Qualitätssicherung: ZEISS METROTOM, available at: https://www.zeiss.de/messtechnik/produkte/systeme/computertomographie/metrotom.html, last access: 26 September 2019. a
Darras, O. and Séguéla, R.: Tensile yield of polyethylene in relation to crystal thickness, J. Polym. Sci. Pol. Phys., 31, 759–766, https://doi.org/10.1002/polb.1993.090310702, 1993. a
GOM GmbH: ATOS Professional, available at: https://www.gom.com/de/3d-software/gom-systemsoftware/atos-professional.html (last access: 26 September 2019), 2018. a
GOM GmbH: ATOS Core – Optischer 3D-Scanner, available at: https://www.gom.com/de/messsysteme/atos/atos-core.html, last access: 26 September 2019. a
Härtig, F. and Krystek, M.: Berücksichtigung systematischer Fehler im Messunsicherheitsbudget, in: 4. Fachtagung Messunsicherheit, Erfurt, 2008. a
Hazewinkel, M., Bityutskov, V. I., Gamkrelidze, R. V., and Prohorov, J. V.: Encyclopaedia of mathematics, Kluwer Academic, Dordrecht, 1988. a
International Organization for Standardization: Geometrical product specifications (GPS) – Coordinate measuring machines (CMM): Technique for determining the uncertainty of measurement: Part 3: Use of calibrated workpieces or measurement standards (ISO 15530-3:2011), available at: https://www.iso.org/standard/53627.html (last access: 29 September 2019), 2018. a
Joint Committee for Guides in Metrology: Guide to the expression of uncertainty in measurement: JCGM 100:2008 – GUM 1995 with minor corrections, September 2008. a
Jose, A. J. and Alagar, M.: Development and characterization of organoclay-filled polyoxymethylene nanocomposites for high performance applications, Polymer Composites, 32, 1315–1324, https://doi.org/10.1002/pc.21152, 2011. a
Klemchuk, P. P.: Influence of pigments on the light stability of polymers: A critical review, Polym. Photochem., 3, 1–27, https://doi.org/10.1016/0144-2880(83)90042-8, 1983. a
Knapp, W.: Tolerance and uncertainty, in: Laser Metrology and Machine Performance V, 357–366, 2001. a
Künkel, R.: Auswahl und Optimierung von Kunststoffen für tribologisch beanspruchte Systeme, Zugl.: Erlangen, Nürnberg, Univ., Diss., 2005, Univ., Lehrstuhl für Kunststofftechnik, Erlangen-Tennenlohe, 2005. a
Menges, G., Wübken, G., and Horn, B.: Einfluß der Verarbeitungsbedingungen auf die Kristallinität und Gefügestruktur teilkristalliner Spritzgußteile, Colloid Polym. Sci., 254, 267–278, https://doi.org/10.1007/BF01384025, 1976. a
Müller, A.: Coloring of Plastics: Fundamentals - Colorants - Preparations, Hanser, Carl, München, 2012. a, b, c, d, e, f
Müller, A., Metzner, S., and Hausotte, T.: Characterization of the single point precision of steel gear wheel measurements using tactile coordinate measurement machines in scanning mode, in: 20. GMA/ITG-Fachtagung Sensoren und Messsysteme 2019, edited by: AMA Service GmbH, 756–762, https://doi.org/10.5162/sensoren2019/P2.18, 2019a. a
Müller, A. M. and Hausotte, T.: Comparison of different measures for the single point uncertainty in industrial X-ray computed tomography, in: 9th Conference on Industrial Computed Tomography, e-Journal of Nondestructive Testing, available at: http://www.ndt.net/iCT2019, last access: 29 September 2019a. a
Müller, A. M. and Hausotte, T.: Utilization of single point uncertainties for geometry element regression analysis in dimensional X-ray computed tomography, in: 9th Conference on Industrial Computed Tomography, e-Journal of Nondestructive Testing, available at: http://www.ndt.net/iCT2019, last access: 29 September 2019b. a
Müller, A. M. and Hausotte, T.: About the need for optical gear measurements using a beam diversion mechanism in order to obtain truthful surface texture parameters/Beurteilung der Notwendigkeit einer Strahlumlenkung für optische Zahnradmessungen zur Bestimmung korrekter Oberflächentexturkennwerte, tm – Technisches Messen, 86, 87–91, https://doi.org/10.1515/teme-2019-0044, 2019c. a
Müller, A. M., Wohlgemuth, F., and Hausotte, T.: Simulation-based correction of systematic errors for CT measurements, in: 8th Conference on Industrial Computed Tomography, e-Journal of Nondestructive Testing, available at: http://www.ndt.net/iCT2018 (last access: 29 September 2019), 2018. a
Müller, A. M., Oberleiter, T., Willner, K., and Hausotte, T.: Implementation of Parameterized Work Piece Deviations and Measurement Uncertainties into Performant Meta-models for an Improved Tolerance Specification, Proceedings of the Design Society: International Conference on Engineering Design, 1, 3501–3510, https://doi.org/10.1017/dsi.2019.357, 2019. a
Piorkowska, E. and Rutledge, G. C.: Handbook of Polymer Crystallization, in: Handbook of Polymer Crystallization, 1–481, https://doi.org/10.1002/9781118541838, 2013. a, b
Raymond, C. and Ronca, S.: Relation of Structure to Electrical and Optical Properties, in: Brydson's Plastics Materials: Eighth Edition, 103–125, https://doi.org/10.1016/B978-0-323-35824-8.00006-2, 2016. a
Richaud, E.: Polyoxymethylene Additives, in: Polyoxymethylene Handbook: Structure, Properties, Applications and their Nanocomposites, 53–105, https://doi.org/10.1002/9781118914458.ch3, 2014. a, b, c, d, e
Schubert, D., Hertle, S., and Drummer, D.: Influence of titanium oxide-based colourants on the morphological and tribomechanical properties of injection-moulded polyoxymethylene spur gears, J. Poly. Eng., 39, 8, https://doi.org/10.1515/polyeng-2019-0170, 2019. a
VDI/VDE 2630-2.1: Computed tomography in dimensional measurement: Determination of the uncertainty of measurement and the test process suitability of coordinate measurement systems with CT sensors, 2015. a
Volume Graphics GmbH: VGSTUDIO MAX, available at: https://www.volumegraphics.com/de/produkte/vgstudio-max.html (last access: 26 September 2019), 2019. a
Wacharawichanant, S., Sangkhaphan, A., Sa-Nguanwong, N., Khamnonwat, V., Thongyai, S., and Praserthdam, P.: Effects of particle type on thermal and mechanical properties of polyoxymethylene nanocomposites, J. Poly. Sc., 123, 3217–3224, https://doi.org/10.1002/app.34984, 2012. a, b, c
Wallner, G. M., Geretschläger, K. J., Hintersteiner, I., and Buchberger, W.: Characterization of polyoxymethylene for backsheets of photovoltaic modules, Journal of Plastic Film and Sheeting, 33, 345–360, https://doi.org/10.1177/8756087916666624, 2017. a
Yousef, S., Visco, A., Galtieri, G., and Njuguna, J.: Flexural, impact, rheological and physical characterizations of POM reinforced by carbon nanotubes and paraffin oil, Polym. Advan. Technol., 27, 1338–1344, https://doi.org/10.1002/pat.3801, 2016. a
- Abstract
- The concept of the single point uncertainty
- The gear wheel measurement object
- Measurement setup and data processing
- Results
- Discussion and summary
- Data availability
- Author contributions
- Competing interests
- Special issue statement
- Acknowledgements
- Financial support
- Review statement
- References