the Creative Commons Attribution 4.0 License.
the Creative Commons Attribution 4.0 License.
 | 20 Mar 2020
Model-based analysis of constructional steel structures exemplified by dimensional checking on railway car shells using 3D scanning
Uwe Jurdeczka
The analysis of constructional steel structures (such as car shells for rail vehicles) in terms of
-
dimensional checking according to DIN 25043-2:2012 (presented here) and
-
completeness checking (investigated in Jurdeczka, 2017)
represents a challenge because of the dimensions of the test object () and because of the number of mounted parts (several hundred).
As presented here and in former publications, the use of 3D scanners allows us to obtain sufficiently comprehensive information about the actual configuration (dimensions and completeness) of the constructional steel structure to be checked. By using an adapted algorithm, the respective 3D model as the target state is superimposed with difference images.
These difference images show possible dimensional deviations as well as possible missing parts or, at the least, suspect points. For dimensional checking, there are advantages in the inspection process. In addition, a detailed image can be obtained, which can be used for later evaluations.


The process of the 3D scanning of car body shells is described in a former publication (Jurdeczka, 2017). There is given also the use of 3D scanning for completeness checking. Since then, the already-presented algorithm (Jurdeczka, 2018a) has been able to be extended for dimensional checking. This dimensional checking will be described here. Three-dimensional scanning by a terrestrial 3D laser scanner (TLS) results in point clouds. Besides the information about the scanned object, the point cloud contains so-called pseudo points. For completeness checking, pseudo points could be rendered harmless by an algorithm. For the dimensional checking, pseudo points are quite irritating, since they distort the position of a real item. In this publication, it is pointed out how to decrease the disturbing effect of pseudo points for the process of dimensional checking.
About 100 discrete dimensions have so far been captured per car body shell (CBS) by a laser tracker or a batter board or string line device, added to by further measurements using an angle meter and an inner calliper gauge. Thus, the formal requirements of DIN 25043-2:2012 have been securely met. However, the analysis in the event of unexpected assembly problems has not been supported. It is especially this analysis of criteria at a later point in the ongoing assembly that has potential. Besides that, the statistical process control can thus also be fed with sufficient input information.
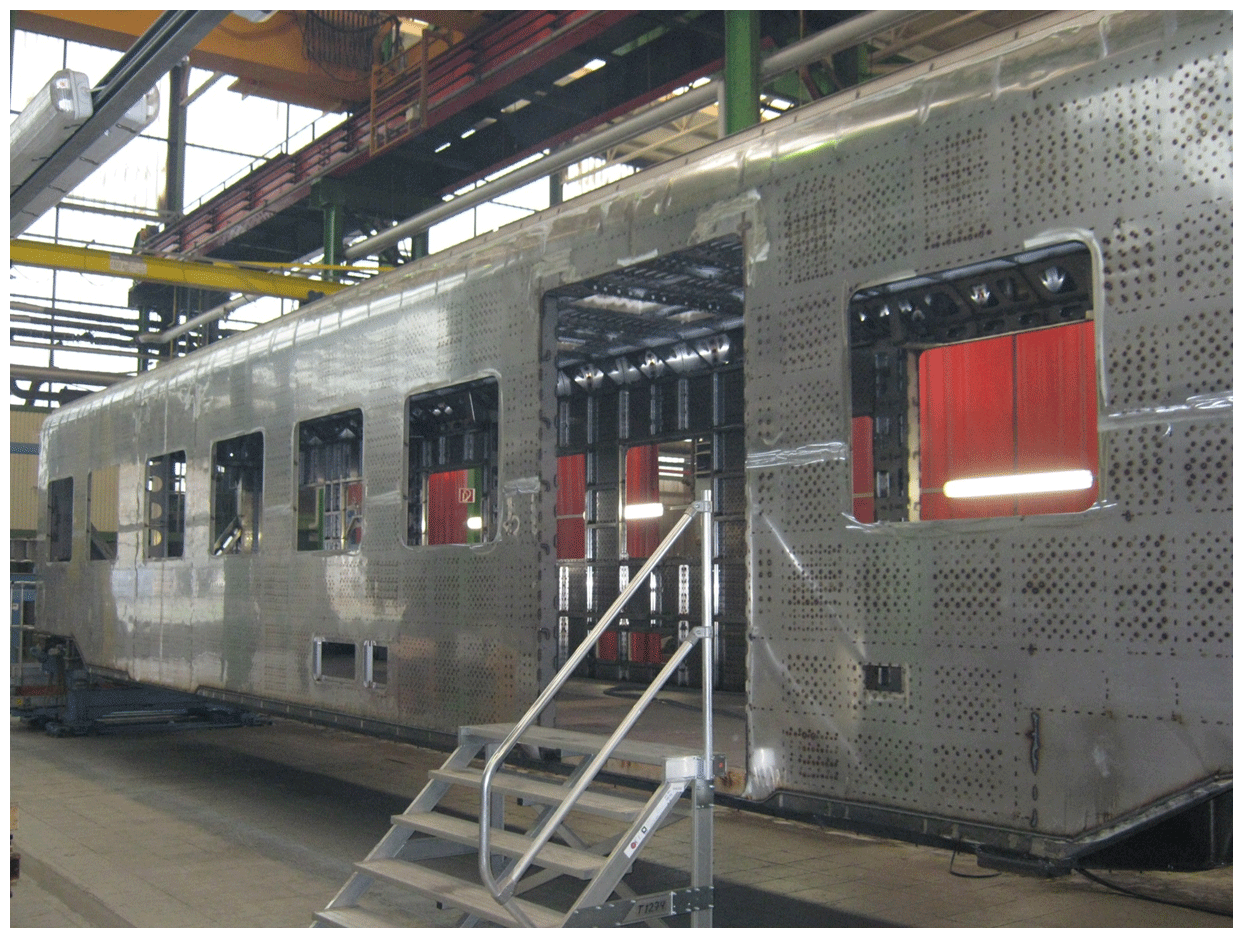
Cycle time and constructional variant diversity with a small quantity of completely identical car shells represent the motivating basic conditions for completeness measurement. This variant diversity is managed in production by MESs (manufacturing execution systems). The production-accompanying checks also require attention. The variant diversity is based on the type of mounted parts, their number and their positions. About 300 mounted parts (holders, lugs, earthing connections or the like) are to be checked for completeness within the cycle time per shift (about 8 h). A car body shell in a test rig is shown in Fig. 1. The development of equipment-based analyses of structures is ongoing. Progress reports of the first developments in equipment- and model-based completeness checking – for smaller inspection volumes than those presented here – are available (Berndt and Warnemünde, 2012; Kelch, 2015; Anonymous, 2015; Tarih, 2016). This development is added to by handling instructions for the assembly staff and the inspectors, where target positions of criteria are indicated by laser light at the mounting position or by a monitor in a CAD data set (Drechsel, 2016; Optimum GmbH, 2019). The known approaches for the measurement of constructions with main dimensions larger than 10 m and for completeness checking should therefore be continued. Model-based checking now promises the possibility of considering the variant diversity of design and production by means of easily adaptable test plans and criteria lists.
Schmitt et al. (2016) provide an overview of the measurement procedures presently available for large test objects (large scale). Kersten et al. (2018) as well as Lichtenberger and Wintjens (2017) expand upon this subject for terrestrial laser scanners. Jurdeczka (2016a, 2017) describes the generation of difference images from the comparison between the 3D CAD model (target) and actual 3D data, with the allowed manufacturing tolerances and their utilization also being considered. There is the basic problem that the real length of the car shell differs in the range of specified tolerance by up to ±14 mm. A comparison of the real car shell with the nominal 3D model will display the deviation. Since the size of the mountings (i.e. ) is in the same range as the specified tolerances, a simple comparison of the complete 3D scan against the complete 3D model will not display the deviation of delicate mountings. A solution is developed (Jurdeczka, 2018a) for the basic problem that the real length of the car shell only complies with the nominal size of the CAD data set within the tolerances of several millimetres. Thus, a length deviation of the real steel construction from the data set, for example, is indicated in the difference image. However, such a deviation would not necessarily be a fault but a variation in production evaluated as still being okay. A whole side of a cubic steel construction (e.g. sidewall of a rail vehicle) might therefore be presented as missing or deviant although there is no fault except the tolerance is used up to the nominal size.
In Jurdeczka (2018a) it is explained how to modify the available equipment class of terrestrial laser scanners, 100HSX-SR (Surphaser.com, 2018), and analyse the methods of PolyWorks Inspector Premium (Duwe-3d.de, 2020).
Compared with completeness checking, the use of 3D scanners for the generation of dimensional statements leads to additional difficulties, which are listed at the end of the next chapter.
1.1 Capture of the as-is state and dimensions
A terrestrial 3D laser scanner (TLS, also called HDS – high-definition surveying) is used for data acquisition (3D scan, point cloud). The advantages of using a TLS for the generation of an image of the test object are speed, a comparatively easy operation and manageable point clouds.
A typical car shell of a regional train can be completely scanned with four sensor positions outside and another five to six sensor positions inside, such that shadowing by pillars is avoided in the interior.
As scanning takes place from various sensor positions, first the individual scans should be registered and summarized in one joint point cloud. The points can be reasonably thinned out, and individual erroneous scans of the hall ceiling, inter alia, can be eliminated by meshing. For this purpose, the point cloud of the individual 3D scans is to be prepared, i.e. by registration (consolidation) of the individual scans of the different sensor positions and by meshing. Example parameters for meshing are a mesh size of maximally 4 mm and single-point deviation of 0.1 mm. The points can also be evaluated optionally according to the scanner distance and particularly to the probing angle.
The point cloud obtained using the scanners and the following preparation is a detailed image of the actually built state (as-is state).
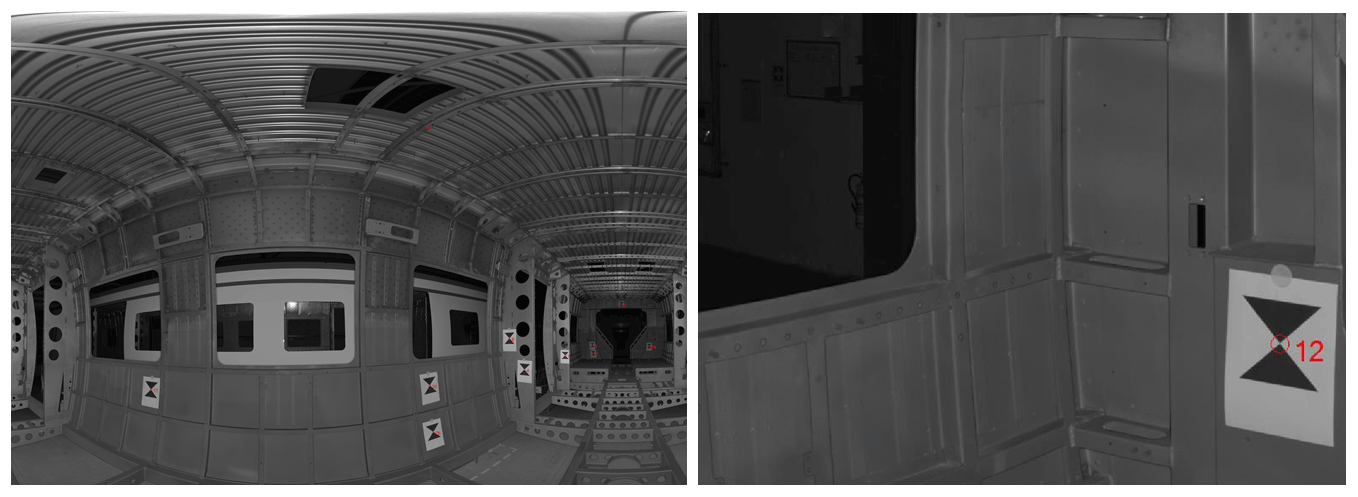
Figure 2Example of a point cloud. The intensity of reflection (remission) is shown as a grey value, which results in a photo-realistic view of the point cloud (Jurdeczka, 2017). A detailed section is on the right.
A preliminary investigation was carried out for the reproducibility of the measurements. When automatically registering the scans by means of target marks (target mark example in Fig. 2), the software provides statistics for 3D accuracy. The maximum deviation for 20 scans was at about 0.5 mm, and the standard deviation was at about 0.25 mm.
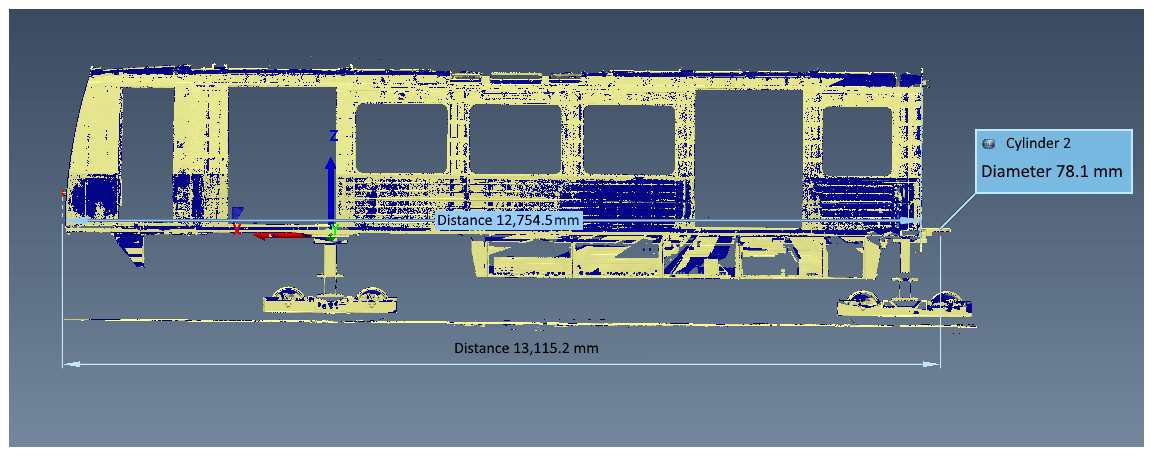
Figure 3Complete point cloud of a car shell. Derivation of two length values and of the diameter of a bearing bore are shown.
Figure 3 shows the registered complete point cloud of a car shell. Figure 3 also contains dimensions, i.e. length values, with the reference points of
- i.
rear wall and
- ii.
centre of the bearing bore.
The latter is also determined from the point cloud. As in the measurement sheets, the evaluation is performed according to DIN 25043-2. First, it was necessary to define planes as reference planes in the registered scan data. An example of reference planes is shown in Fig. 4.
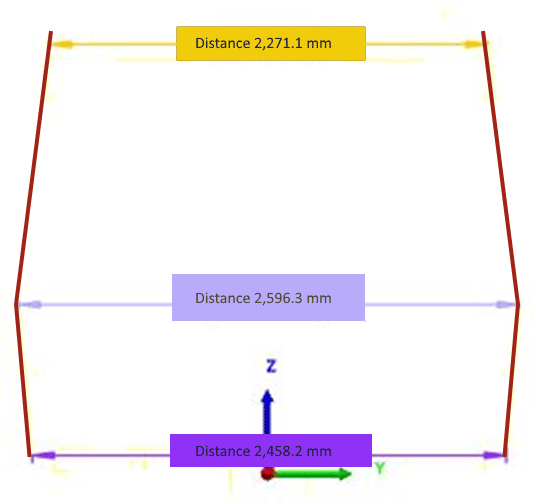
Table 1 lists examples of dimensions in the three reference planes (Fig. 4), according to DIN 25043-2:2012, of the complete point cloud (Fig. 3).
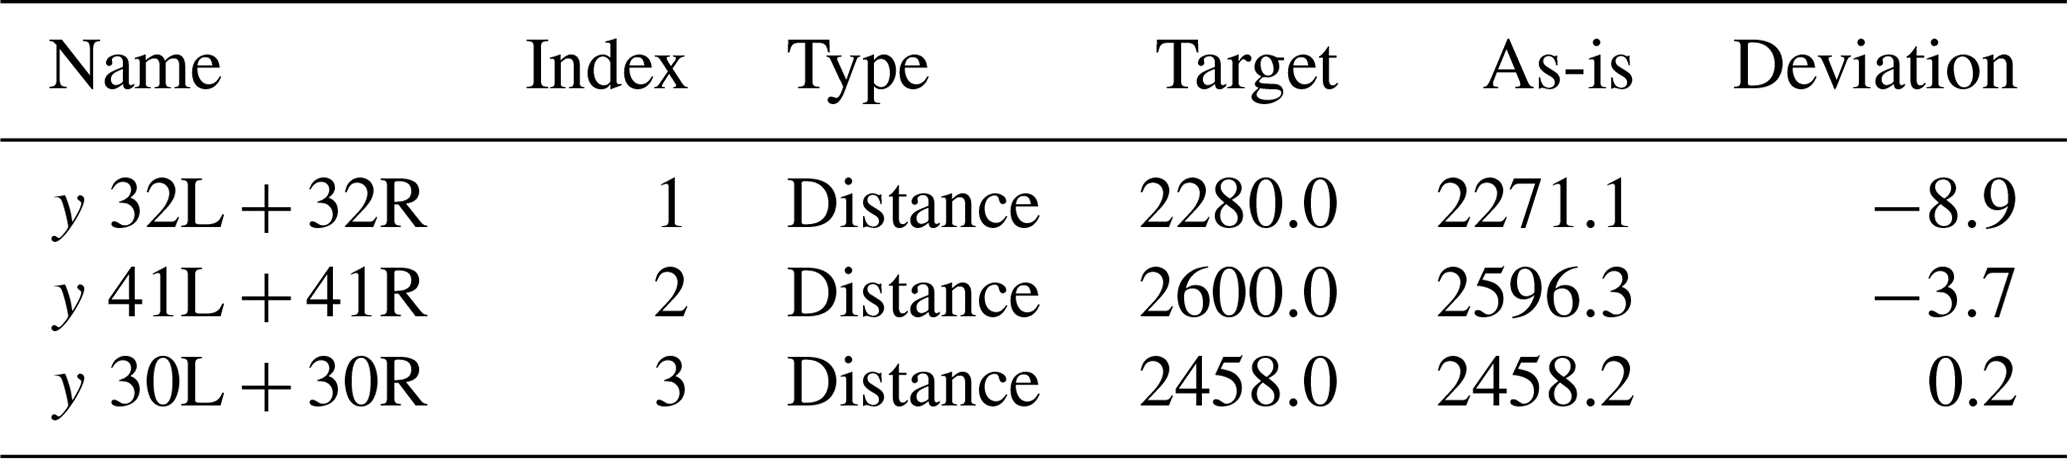
In addition to the main dimensions (length, width, height), Fig. 5 also shows other dimensions, i.e. x and y dimensions of a door cutout.
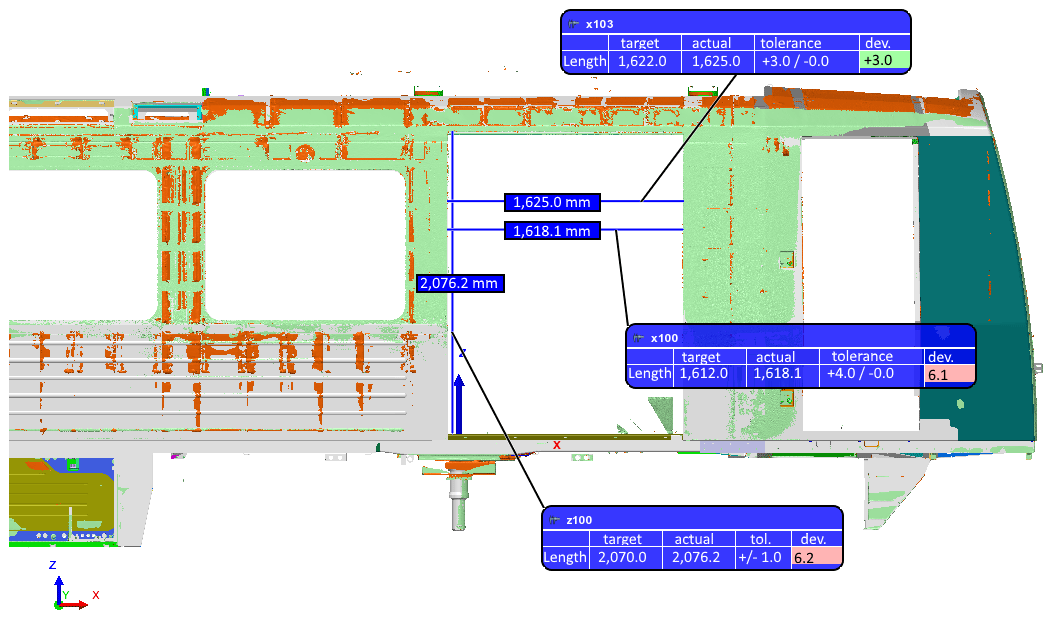
Figure 6 shows an additionally calculated vehicle's central plane (plane of symmetry) and the related width dimensions, i.e. y dimensions. The y 41L and 41R dimensions of Table 1 and Fig. 4 can be used for comparison.
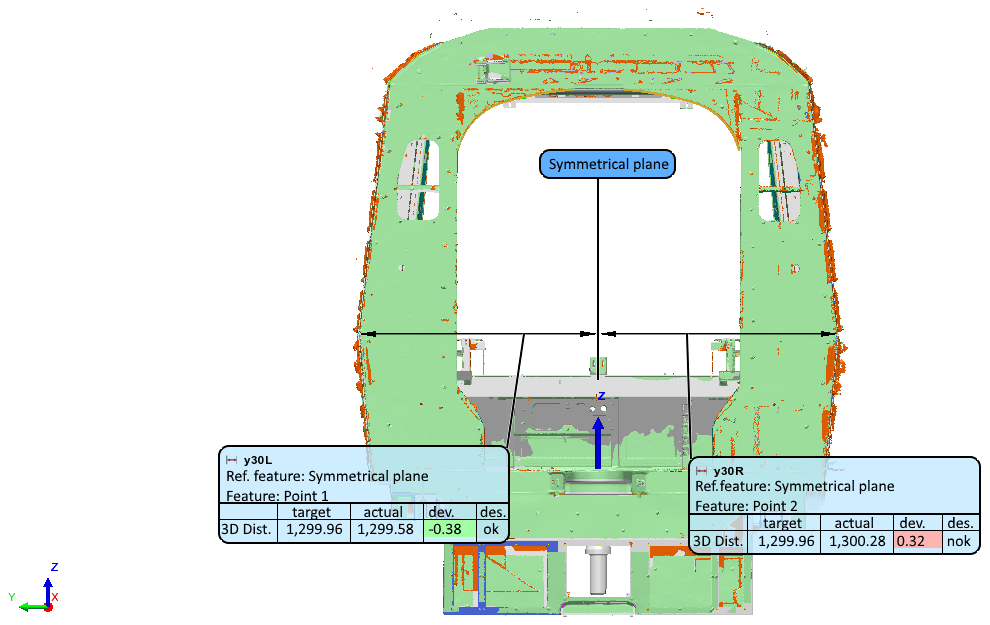
Figure 6Additionally calculated vehicle's central plane (plane of symmetry) and the related width dimensions, i.e. y dimensions.
By means of the filter setting on the scanner, the acquisition of the point clouds can be influenced such that pseudo points (so-called curtains) can largely be excluded. Remaining pseudo points do not seriously affect the algorithm for completeness checking (described in the following section). However, they are very disturbing in dimensional checking. Attention should therefore be paid to their suppression. Examples of pseudo points are shown in Fig. 7:
- a.
rough surface instead of flattened surface area, and
- b.
so-called curtains of pseudo points in the opening for a window.
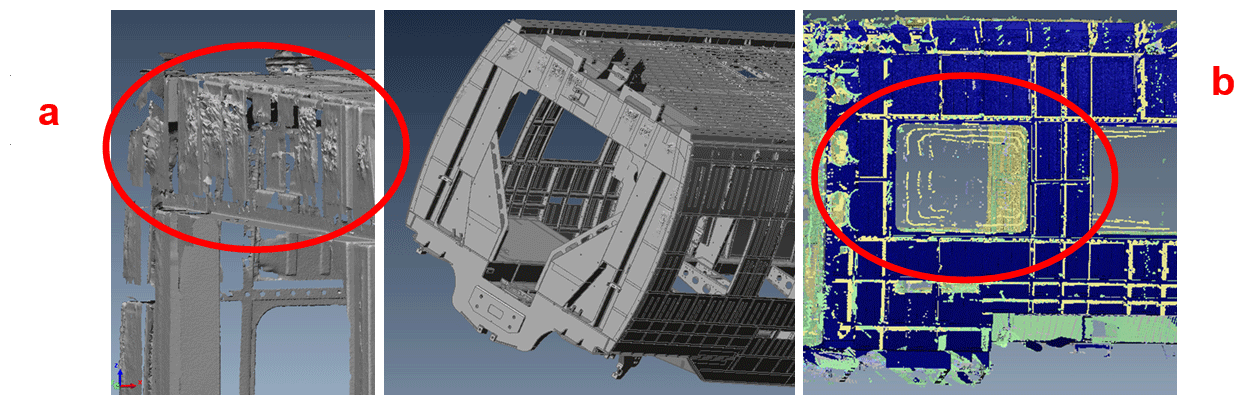
Figure 7Examples of pseudo points at the rear wall and in window cutouts of a car shell (software process, C3D Shell).
1.2 Achieved reproducibility of measurements
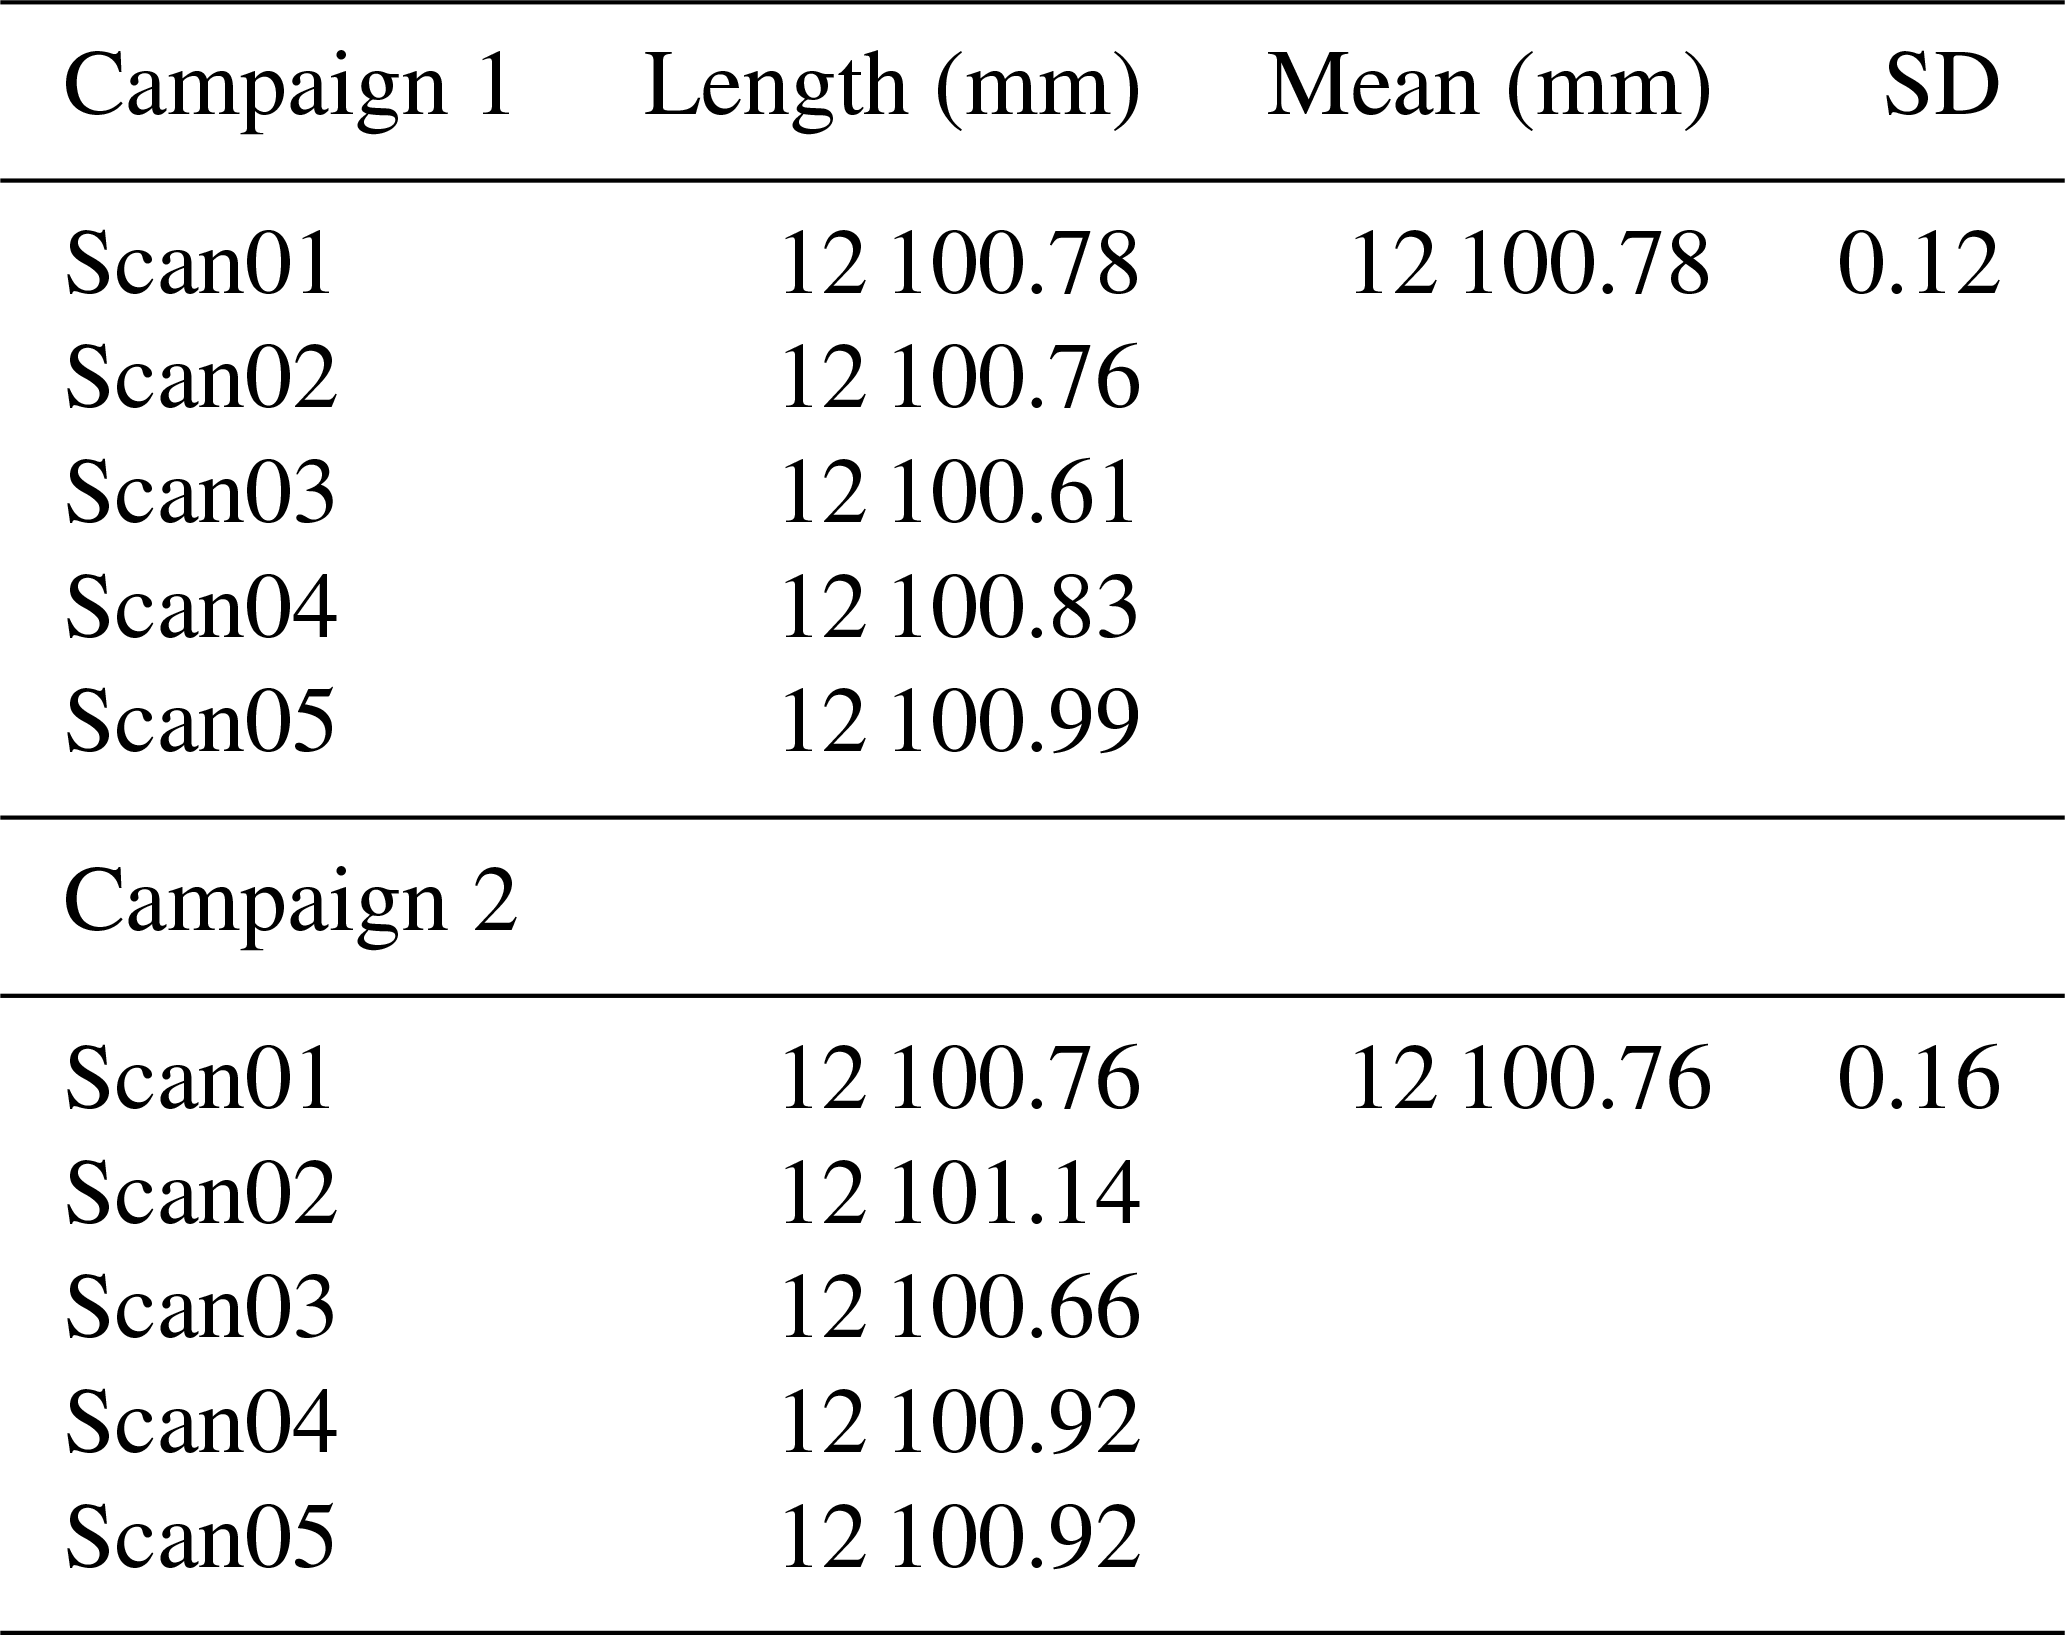
There were two campaigns performed. In Table 2, the campaigns were compared using the example of the length of the car body shell (CBS). The values were scanned by probing black and white targets at the rear walls of the CBS. Each sensor position differs by approximately 1 m from the sensor position before. The standard deviation in Table 2 is calculated before any alignment.
To get a general point cloud over all sensor positions, the point cloud from each sensor position needs to be registered. For the registration of automatically detected b and w targets, a standard deviation of 0.3 mm and a maximum of 0.7 mm for a single deviation are calculated. This fits the needs of later meshing. In the numbers, provided in Table 2, a random error is included. Systematic deviations which have to be analysed in addition to the random deviations, were investigated in NIST, 2006. Holst et al. (2014) categorized the systematic deviation in
- i.
deviations, coming from inside the TLS, like distance measurement or beam steering and deflection;
- ii.
atmosphere, like temperature, barometric pressure or solar irradiation;
- iii.
configuration, like angle of impact or distance; and
- iv.
surface properties, like roughness, reflectivity or colour.
It is obvious that (ii) to (iv) are caused externally, and (i) is caused internally in the TLS device. Wujanz (2020) describes the sources of uncertainty for 3D scanning by TLS as
- i.
uncertainty in probing,
- ii.
uncertainty inside the TLS, and
- iii.
uncertainty caused by the registering (alignment) of individual scans to one general point cloud.
The range uncertainty of the used TLS (results in Tables 1 and 2) is given with <0.3 mmat3 m (http://www.surphaser.com, last access: 13 March 2020).
1.3 The algorithm for completeness checking
The algorithm for completeness checking has been described before by Jurdeczka (2017, 2018a, b). Please refer to these references for further explanations. The algorithm contains an estimation of a value for ε. This is the distance between the CAD model and overlaid point cloud. If there are points closer then ε around the CAD model, it is assumed that there is a relation between CAD element and point cloud. Elements with point distances larger than ε are colour marked in Fig. 8. A look at the sidewall near the real wall shows red points in Fig. 8. These are protective plugs of plastic which had already been mounted at the time of scanning and which do not belong to the design data set of the car body shell, of course.
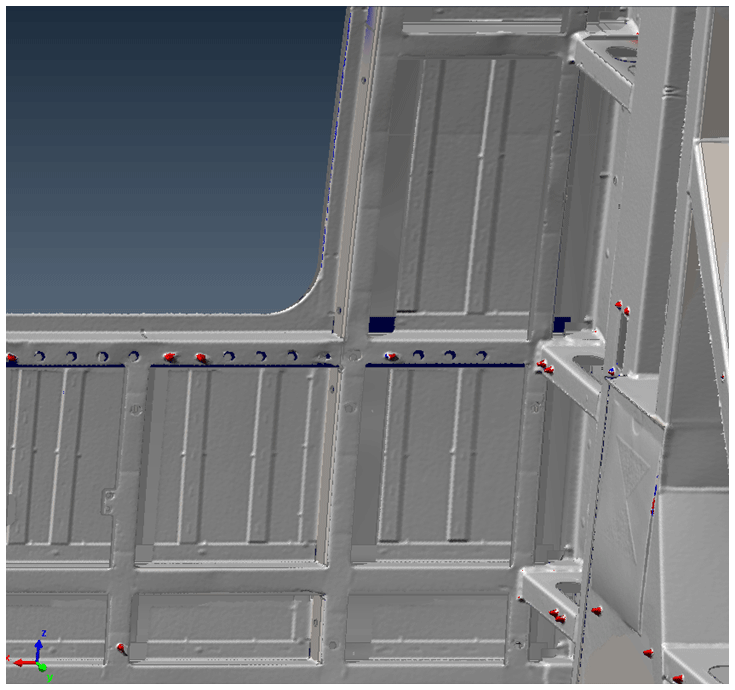
Figure 8Sidewall section. Presentation of the 3D data set, the colour marking encodes the distance of the corresponding points of the point cloud (software, PolyWorks).
The detection of these ∅ 8mm×20 mm or ∅ 10mm×20 mm large criteria demonstrates the potential sensitivity of the test system. Differences between the 3D model and the point cloud are made detectably visible by the application of the algorithm so that such small criteria are captured and analysed.
With the use of a TLS with an adapted focus range for the acquisition of point clouds and the subsequent processing of the point clouds using an adapted algorithm, there is now another measurement method available for constructional steel structures of up to 20 m. A proof of concept has been validated positively.
The issue of difference images with missing parts marked therein allows for completeness checking that is largely independent of the inspector's tiredness and experience (Jurdeczka, 2016b, c, 2019). Many of the approximately 300 mounted parts are recognized as being correct and present. Detected defaults are presented in the model in a traceable and clearly visible way. Manual rechecking of these comparatively few places then separates real fault displays from occasional faults of a higher order.
The model-based target description (by means of a 3D CAD data model) leads to high flexibility in changes to the test objects (car shells) and is therefore especially suitable for varied assembly processes. Constructional changes in the CAD model can therefore also be integrated into the test plan (list of criteria to be checked) in the short term. The structure of the 3D model data is of special importance for the scope of the calculation operations. As far as it is possible by reasonable structuring to issue a so-called light model with the mounted parts, separate from the complete design data set, suitable input information about the target state will be available. The light model can be considered as an extract from the parts list, i.e. it lists all mounted parts. The import and export of test criteria plans of the light model can then be supported very well. Thus, test criteria plans can largely be automated (name of the mounted part, identification number, etc.).
A classification of the test object in areas, both in the data set and in the point cloud, is part of the testing process. For these geometric areas, optimum geometric area sizes can be determined to obtain minimum noise. Additional investigations are required here.
The described solution of the implementation of a second coordinate system (a local one for the area of the considered mounted parts in addition to the global coordinate system for the complete car shell) provides generally sufficient degrees of freedom for orientation, which are also required for orientation procedures between the work steps of additive manufacturing (Penchev, 2019). Even if the actual dimensions are within other value ranges, the procedure can be transferred to minimize the inaccuracy and scattering of such orientation procedures.
Research data are available upon request to the author.
The author declares that there is no conflict of interest.
I would like to thank Rainer Tutsch for fruitful discussions of the algorithm and Pavel Penchev for fruitful discussions of the orientation procedure.
This research has been supported by the European Union's Horizon 2020 research and innovation programme (grant no. 723826).
This paper was edited by Gerald Gerlach and reviewed by two anonymous referees.
Anonymous: Carl-Hanser Verlag München: Bevor Fehler entstehen, 3D Bildverarbeitungssystem prüft Schaumstoffteile, QZ Jahrgang 60 (2015) 11, p. 64, 2015.
Berndt, D. and Warnemünde, R.: Flexible modellbasierte Montageprüfung, available at: https://www.iff.fraunhofer.de/content/dam/iff/de/dokumente/publikationen/flexible-modellbasierte-montagepruefung-fraunhofer-iff.pdf (last access: 13 March 2020), 2012.
Drechsel, T.: Laserprojektion im Lokomotivbau. Positionieren von Anbauteilen in der Produktion der Lokomotive Vectron, DVV Media Group/Eurailpress, EI-Eisenbahningenieur Jahrgang 67 (2016) 04, p. 16, 2016.
Duwe-3d.de: Erfassung und Auswertung von 3D-Messdaten mit PolyWorks Inspector, available at: http://www.duwe-3d.de/de/products/polyworks-inspector, last access: 13 March 2020.
Holst, C., Tegelbeckers, J., and Kuhlmann, H.: Erkennung und Erklärung von systematischen Effekten beim TLS, Proceedings of 139th DVW-Seminar in Fulda, ISBN 978-3-95786-010-1, p. 51, 2014.
Jurdeczka, U.: Vollständigkeitsprüfung an Schienenfahrzeug-Wagenkästen, Tagungsband der 3D-Nordost 2016, Berlin Adlershof, ISBN 978-3-942709-16-3, 2016a.
Jurdeczka, U.: Optisches Prüfsystem für variantenreiche Montageprozesse. Carl-Hanser Verlag München, QZ Jahrgang 61 (2016) 07; p. 46, 2016b.
Jurdeczka, U.: Konzeption zur Vollständigkeitsprüfung von gefügten Strukturen am Beispiel Schienenfahrzeugwagenkästen, poster presentation at the 18, GMA/ITG-Fachtagung Sensoren und Messsysteme 2016, Nürnberg, https://doi.org/10.5162/sensoren2016/P7.8, 2016c.
Jurdeczka, U.: Concept for completeness checking of joined structures exemplified on rail vehicle car body shells, J. Sens. Sens. Syst., 6, 53–63, https://doi.org/10.5194/jsss-6-53-2017, 2017.
Jurdeczka, U.: Beitrag zur modellbasierten Vollständigkeitsprüfung von Anbauteilen an Stahlbau-Strukturen, vertieft an Schienenfahrzeug-Wagenkästen mit ca. 300 Haltern, Laschen und Erdungskontakten, Messvolumen , Dissertation an der TU Braunschweig, Shaker Verlag, ISBN 978-3-8440-5801-7, 2018a.
Jurdeczka, U.: Modellbasierte Analyse von Stahlbau-Strukturen, am Beispiel Maßprüfung und Vollständigkeits-prüfung an Schienenfahrzeug-Wagenkästen, Tagungsband der 3D-Nordost 2018, Berlin, GFaI, Berlin Adlershof, ISBN 978-3942709194, 2018b.
Jurdeczka, U.: Modellbasierte Analyse von Stahlbau-Strukturen, am Beispiel Maßprüfung und Vollständigkeits-prüfung an Schienenfahrzeug-Wagenkästen mittels 3D-Scan und Software-Algorithmus, Posterpresentation 20, GMA/ITG-Conference Sensors and Measurementsystems 2019, Nürnberg, https://doi.org/10.5162/sensoren2019/P3.3, ISBN 978-3-9819376-0-2, 763–768, 2019.
Kelch, J.: Vollautomatisierte 100 % Inspektion von Karosserieteilen – Aus allen Perspektiven, Carl-Hanser Verlag München, QZ Jahrgang 60 (2015) 05; p. 62, 2015.
Kersten, T., Przybilla, H.-J., Lichtenberger, R., and Wintjens, P.: Zum Genauigkeitspotential der terrestrischen 3D-Nahbereichscanner Surphaser 75USR und 100HSX-SR, in: Beiträge der Oldenburger 3D-Tage 2018, Oldenburg, Wichmann Verlag, ISBN 978-3-87907-643-7, 2018.
Lichtenberger, R. und Wintjens, P.: Laserscanner Surphaser – effiziente und präzise Digitalisierung für Qualitätskontrolle und Reverse Engineering, Proceedings of Oldenburger 3D-Tage 2017, ISBN 978-3-87907-625-3, Oldenburg, Wichmann Verlag, 2017.
NIST: Proceedings of the 3rd NIST Workshop on the Performance Evaluation of 3D Imaging Systems – March 2–3, 2006 NISTIR Publication 7054, Gaithersburg, USA, available at: https://nvlpubs.nist.gov/nistpubs/Legacy/IR/nistir7357.pdf, last access: 14 October 2019.
Optimum GmbH, Karlsruhe: Der “Schlaue Klaus” Anwendungen für intelligente Bilderkennung, available at: https://www.optimum-gmbh.de/der-schlaue-klaus.html, last access: 29 July 2019.
Penchev, P., Essa, K., Jurdeczka, U., Mehmeti, A., Adkins, N., Carter, L., Dimov, S., Maurath, J., Maillol, N., Bajolet, J., and Bhaduri, D.: System-level integration tools for hybrid laser-based powder bed fusion manufacturing platforms, J. Manufact. Syst., 50, 87–102, https://doi.org/10.1016/j.jmsy.2018.12.003, 2019.
Schmitt, R., Peterek, M., Morse, E., Knapp, W., Galetto, M., Härtig, F., Goch, G., Hughes, B., and Estler, W.: Advances in large scale metrology – review and future trends, CIRP Annals – Manufact. Technol., 65, 643–665, https://doi.org/10.1016/j.cirp.2016.05.002, 2016.
Surphaser.com: available at: http://www.surphaser.com/pdf/Surphaser/100HSX.pdf, last access: 30 October 2018.
Tarih, C.: Aktueller Stand der Automatisierung von Sichtprüfungen, speziell Vollständigkeitsprüfungen an großen Stahlbaustrukturen am Beispiel Schienenfahrzeugwagenkästen, Study paper at the Ostfalia Braunschweig/Wolfenbüttel, 2016.
Wujanz, D.: Berücksichtigung der Registrierung im Unsicherheitsbudget der Deformationsmessung basierend auf terrestrischen Laserscans, in: Photogrammetrie – Laserscanning – Optische 3D-Messtechnik: Beiträge der Oldenburger 3D-Tage 2020, Oldenburg, Wichmann Verlag, ISBN 978-3879076888, 2020.