the Creative Commons Attribution 4.0 License.
the Creative Commons Attribution 4.0 License.
 | 18 Feb 2019
A study of hand-movement gestures to substitute for mouse-cursor placement using an inertial sensor
Reyna Marsya Quita
Rhesdyan Setiawan
Chikamune Wada
This paper examines the new study of hand orientation as a substitute for computer-mouse movement and is evaluated based on ISO/TS 9241 part 411: Ergonomics of human–system interaction-evaluation methods for the design of physical input devices. Two pairs of hand-orientation candidates were evaluated, using, for example, pitch–roll and pitch–yaw to substitute for up–down and left–right mouse-cursor movements. The up–down cursor movement was generated from the pitch orientation, while the left–right cursor movement was generated from the roll or yaw orientation, depending on the evaluation of the proposed gesture. The research employed a standard computer mouse as a baseline comparison for the study. The empirical study was conducted to evaluate quantitative performance such as throughput and movement time. The best impression resulted when the throughput had the greatest value as well as the shortest movement time. The performance test was based on Fitts's law using a multi-directional tapping test as suggested by ISO/TS 9241-411. The test was divided into several levels of difficulty, including high, medium, low, and very low. The other assessment is qualitative and was performed using the comfort-rating scale questionnaire and rating of perceived exertion of comfortability and fatigue. The quantitative results show that pitch–yaw throughput is slightly higher than for the pitch–roll gesture, and that the movement time in pitch–yaw is slightly less than in pitch–roll, although there is no statistically significant difference between the two. We also found that pitch–yaw movements have a higher level of comfort based on the comfort-rating scale test. Since the test was divided into levels of difficulty, we identified those gestures suitable for the task with a low and very low level of difficulty based on throughput, movement time, and error-rate results. Finally, this study suggests that pitch–roll and pitch–yaw movements of the hand can be used as substitutes for the mouse, and that pitch–yaw movements are superior in regard to causing less fatigue than pitch–roll movements. Furthermore, this study provides a new suggestion for a suitable level of difficulty when using an inertial sensor as an emulator for the movement of a mouse cursor in the field of human–computer interaction.


A computer mouse's main function is as a pointing device for the user to navigate, target, and command execution through mouse movement and button-clicked action (Lazar et al., 2017; Natapov et al., 2009). The mouse as a pointing device could not be used by someone who is disabled for certain reasons. (1) The fingers' impairment caused by a malfunction of the sensoric system and congenital disorder; (2) the person's difficulty operating a computer in a sitting position. Therefore, a study of the suitable hand gestures or hand movement or hand orientation which serve as a substitute for a conventional mouse is needed.
Some research found that a mouse replacement could be categorized into some groups, for example handglove, grasping, and optic types. The material used in the handglove type using an acceleration sensor was introduced in Perng et al. (2002); an acceleration sensor was also used in edutainment as a control (Kranz et al., 2010); fiber optic in Zimmerman et al. (1986); a flexible plastic resistive ink sensor as in Power Glove by Mattel, Inc. (Sturman and Zeltzer, 1994); and ultrasonic and magnetic hand position tracking technology as in Data Glove (Zimmerman et al., 1986) and Zimmerman and Lanier (1989). The grasping type as in a Wii remote, GyroPoint, and RemotePoint was discussed and studied in Natapov et al. (2009), MacKenzie and Jusoh (2001), and Norman and Norman (2010). The use of optic types such as a laser pointer as a pointing device has been discussed in Myers et al. (2002) and Oh and Stuerzlinger (2002). Much of the current literature on pointing devices pays particular attention to others evaluating and comparing pointing devices; however, the investigation of gestures has not been highlighted in those studies.
One of the most significant parts that can be used to emulate the movement of a mouse is a limb, due to its ability in multi-directional movement. The wrist movement in the tri-axial plane, such as the frontal, median, and transverse planes, represents the orientation of roll, pitch, and yaw, respectively. The wrist movement consists of flexion–extension and radial–ulnar deviation; the forearm movement consists of forearm pronation and forearm supination as in Gates et al. (2016) and Nelson et al. (1994). In this paper we relate those movements to the orientation axis, in which flexion–extension represents pitch, pronation–supination represents roll, and radial–ulnar deviation represents yaw. Figure 1 illustrates the wrist and forearm movement. The range of motion related to these movements reported in Gates et al. (2016) and Nelson et al. (1994) for wrist flexion and extension is 38 and 40∘; wrist radial and ulnar deviation: 28 and 38∘; and forearm pronation and supination: 13 and 53∘.
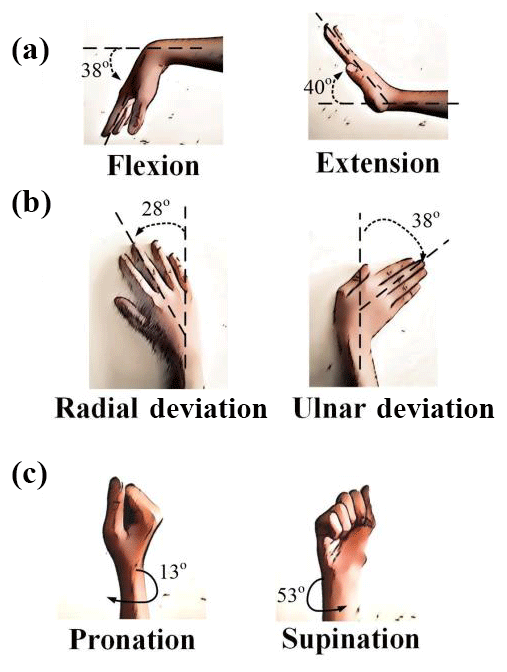
Figure 1Wrist and forearm movement: (a) flexion–extension represents pitch; (b) radial–ulnar deviation represents yaw, and (c) pronation–supination represents roll. The angle value is the normal value based on the previous study.
Inspired by Perng et al. (2002), Zimmerman et al. (1986), Sturman and Zeltzer (1994), and Zimmerman and Lanier (1989), and evaluated by Natapov et al. (2009), MacKenzie and Jusoh (2001), Norman and Norman (2010), MacKenzie et al. (2001), and Widodo and Matsumaru (2013), this study set out to clarify several aspects of the two candidates of movement gestures: pitch–roll and pitch–yaw, to substitute the movement of the mouse cursor. We worked on comparing the performance of pitch–roll and pitch–yaw quantitatively and qualitatively based on ISO/TS (International Standards Organization/Technical Specification) 9241 part 411: evaluation methods for the design of physical input devices.
The rest of the paper is organized as follows: Sect. 2 discusses ISO/TS 9241 related to the evaluation procedure and Fitts' formula, Sect. 3 discusses the research methodology, Sect. 4 presents the experiment results, and Sect. 5 elaborates on the results as a discussion. Lastly, Sect. 6 presents the conclusion of the study.
ISO 9241 is a standard used for human-system interaction (International Organization for Standardization, 2012). ISO 9241 part 411 (ISO/TS 9241-411) discusses the evaluation methods for the design of physical input devices. The quantitative assessment of performance was measured by throughput and movement time, as well as using a comfort-rating scale to assess comfort qualitatively. The dependent measure of Throughput (TP) defined in ISO was based on Fitts' law model. Fitts' law proposed an index of difficulty of a movement based on the relationship between distance (amplitude), movement time (duration), and distance variability. The TP is the index of difficulty (ID) divided by movement time (tm) (Fitts, 1954; Mackenzie, 2018). Based on the Shannon–Hartley theorem, the formulation of the ID is in Eq. (1):
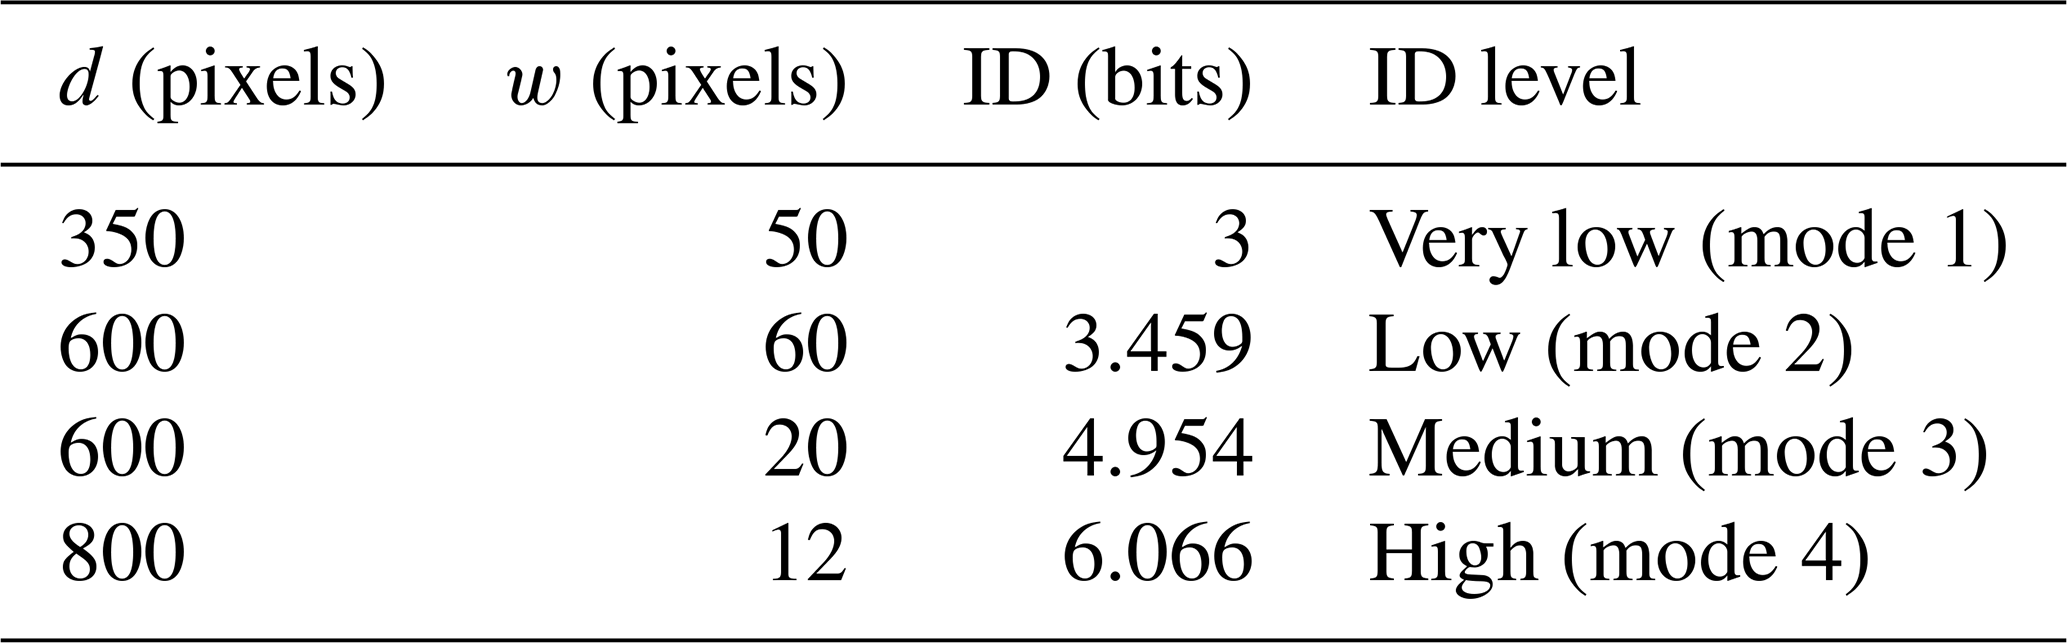
where d is the distance of movement and w is the target width. The ISO procedure includes the four levels of difficulty (ID), that is, high (ID > 6); medium (4 < ID≤6); low (3 < ID≤4); and very low (ID≤3).
The tapping coordinates to a user spreading around the target's center. Therefore, the scatter data should be used to adjust the accuracy of each user as suggested in Mackenzie (2018). The ISO standard dependent measurement, throughput, was calculated using this adjustment for accuracy. Equation (1) was modified to be in Eq. (2):
where we is the effective target width and sx is the standard deviation of the clicked target's coordinate. The movement time (tm) was calculated from one target to the other target in seconds. Finally, the TP is the effective index of difficulty (IDe) divided by tm results in bits per second (bps).
The one-directional tapping task as in Fitts (1954) does not concern the angle of movement in the performance assessment; therefore ISO 9241-411 recommends a multi-directional tapping task. The evaluation using the multi-directional tapping task was used in Norman and Norman (2010), MacKenzie et al. (2001), and Douglas et al. (1999). The pattern of the multi-directional tapping task is illustrated in Fig. 2.
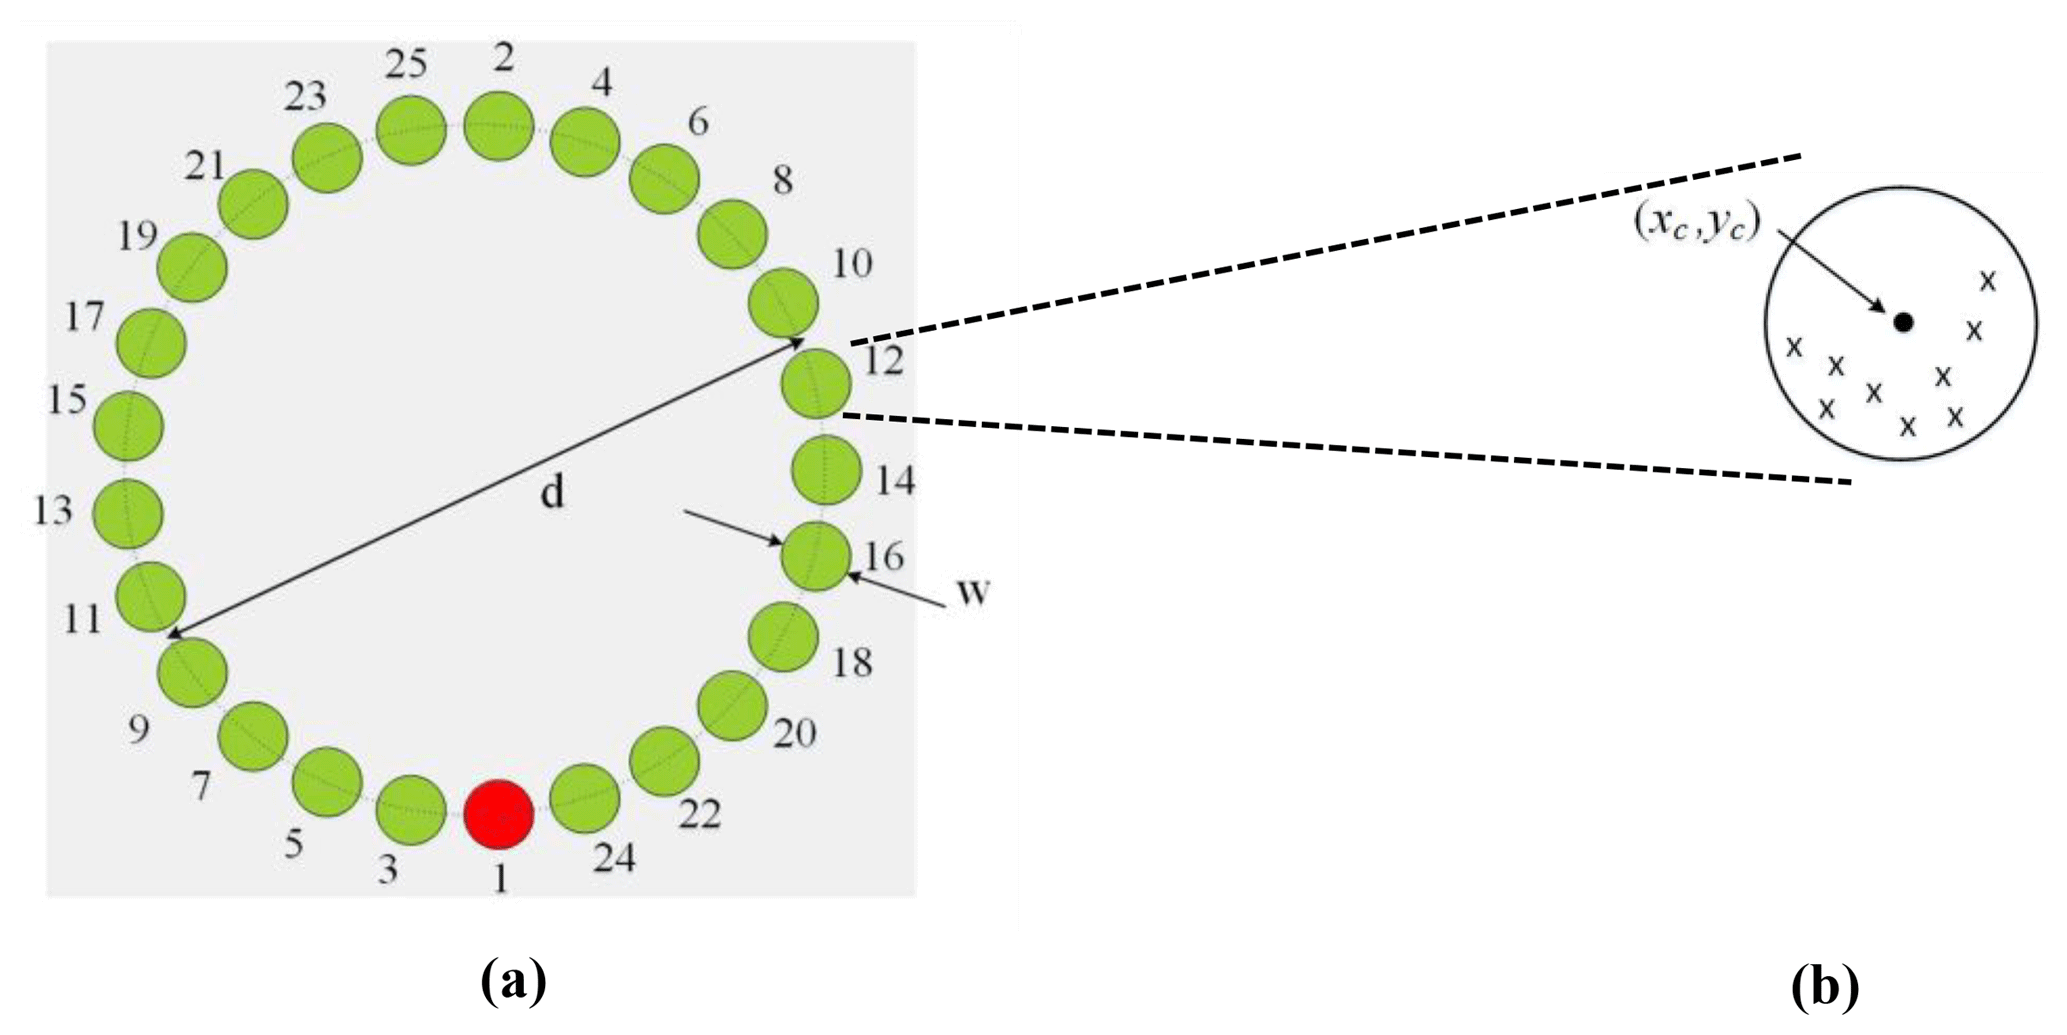
Figure 2(a) Pattern of the multi-directional tapping task: d = distance of movement; w = target width. (b) Enlargement of one target circle; (xc, yc) is the actual clicked target; “x” indicates the clicked-coordinate spreading of each target circle.
The target consists of 25 small circles, which are tapped sequentially according to the number or color changes as illustrated in Fig. 2a. The actual clicked target in each small circle is the center of coordinates of the circles; however, spreading tapping by each subject in each experiment caused the effective target and standard deviation (sx). Figure 2b illustrates spreading tapping coordinates by each subject, symbolized by x, spread around the center of the circle (xc,yc). Every clicked coordinate out of the circle will be recognized as an error.
In the beginning, the IDe in Eq. (2) was reserved for a one-directional tapping task; the IDe for a multi-directional tapping task was calculated based on the extended Eq. (2) as in Norman and Norman (2010) and the International Organization for Standardization (2012). For the calculation conducted in each small circle, all clicked coordinates are analyzed relative to (xc,yc) and finally will be averaged. Hereafter, all equations are for the multi-directional tapping task. Equation (4) calculates the mean of the clicked coordinates and, then in Eq. (5), the subtraction for each x and y coordinate.
The two-dimensional standard deviation is as in Eq. (6).
The distance d is formulated as in Eq. (7).
The calculation of the effective target width (we) is the same as in Eq. (2), rewritten in Eq. (8). The effective index of difficulty is written in Eq. (9).
Finally, the throughput (TP) as in Eq. (3) is rewritten in Eq. (10) as the performance value of the device.
3.1 Participants
Nineteen right-handed subjects, 15 males and 4 females, who were an average of 27.1 years old, standard deviation (SD) = 6.2, were recruited from university students and staffs. All subjects were informed about the procedure before the experiment began.
3.2 Experiment design
The experiment was conducted using a within-subject experimental design. The learning effect was reduced by two ways: (1) randomizing the order of experiment based on index of difficulty level (ID level), and (2) conducting a sufficient session for practice until the subject could get used to operating the evaluation software and experimental apparatus. Every subject used two devices: a standard mouse and an inertial sensor. The inertial sensor was used in two ways: pitch–roll and pitch–yaw gestures; therefore, in this paper we treated the sensor as two devices; the total number of devices was three, including the standard mouse. There are four levels of difficulty: (1) mode 1 is very low level of difficulty; (2) mode 2 is low level of difficulty; (3) mode 3 is medium level of difficulty; and (4) mode 4 is high level of difficulty. Table 1 describes the design of ID levels using a computer display resolution of 1280×1024 pixels; the d and w indicate the distance of movement and target width, respectively (see Fig. 2a). The number of blocks are three and three trials per block. Therefore, for 19 subjects, the design is ; the number of trials was 2052.
Table 1Index of difficulty design (the range of ID is recommended by ISO).
The design for statistical analysis is as follows. First, the data for TP and tm were investigated using the Shapiro–Wilk test to determine whether they represented normality data. A non-parametric test using the Kruskal–Wallis H test was employed to determine whether the data deviated significantly from a normal distribution, followed by the Mann–Whitney U post hoc test. For normal data, the homogeneity of variance test was employed. One-way ANOVA was applied if the assumption of homogeneity of variances was fulfilled, and this was followed by a post hoc test. If the data failed the assumption of homogeneity, we employed Welch's ANOVA instead of ANOVA.
3.3 Apparatus/materials
The experiment involves the measurements of three components of rotation as independent parameters, namely pitch, roll, and yaw. The number of independent parameters referred to as degree of freedom (DOF) defines the configuration of the analysis of the system's bodies. The experiments used 3 DOF tracking InertiaCube 4™ to record the orientation angle such as pitch, roll, and yaw. The manufacturer's accuracy specification: 1∘ in yaw, 0.25∘ in pitch and roll at 25 ∘C. The other input device is a standard mouse (Microsoft® Basic Optical Mouse v2.0) as a baseline condition. The C# software was developed to record orientation data, emulate the mouse-cursor movement using the orientation angle data, and display the multi-directional tapping task simultaneously. Software specification was designed to fulfill Annex B of ISO/TS 9241-411 which consists of (1) four levels of difficulty; (2) movement time recording, (3) clicked coordinate recording, and (4) an error count indicator, which is accompanied by sound feedback when a subject clicks an area outside the target. The qualitative assessment of comfort and fatigue was conducted using the comfort-rating scale questionnaire and rating of perceived exertion (RPE), as suggested by Annex C of ISO/TS 9241-411.
3.4 Procedure
The system is illustrated in Fig. 3. A subject sits about 0.9 m from the display, the forearm resting on the chair armrest when using the 3 DOF sensor for testing. However, the hand is normally on the desk when operating a mouse test. The 3 DOF tracking sensor was mounted on the back of the dominant hand, which is the middle part of the dorsal surface. The right and left mouse click events were the same for all levels of the test. Subjects used a conventional mouse grasped with the dominant hand as the clicking part by employing the mouse's left button. The PC monitor displays the multi-directional tapping task. The sound speaker gives a warning when the subject misses the target; the sound speaker is not shown in the figure. Figure 4 illustrates the orientation of the axes of the sensor; θy (pitch), θx (roll), and θz (yaw) are the rotation angles about the y, x, and z axes, respectively. Figure 4 also describes the mapping for a sensor and cursor.
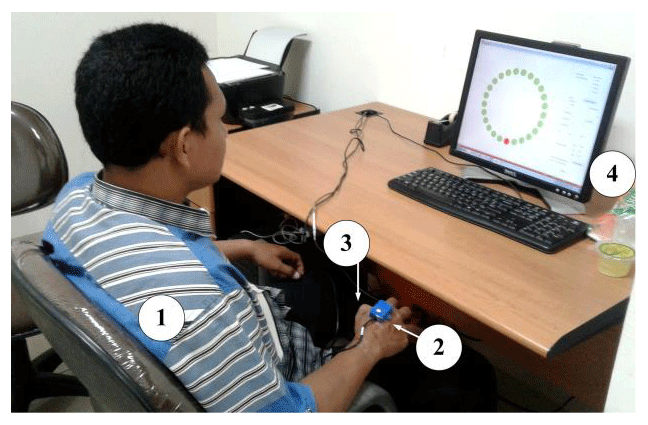
Figure 3Illustration of experimental conditions: (1) Subject (0.9 m from display); (2) Inertial sensor (mounted on the back of the dominant hand); (3) Click part (grasped with the dominant hand); (4) Display (computer monitor).
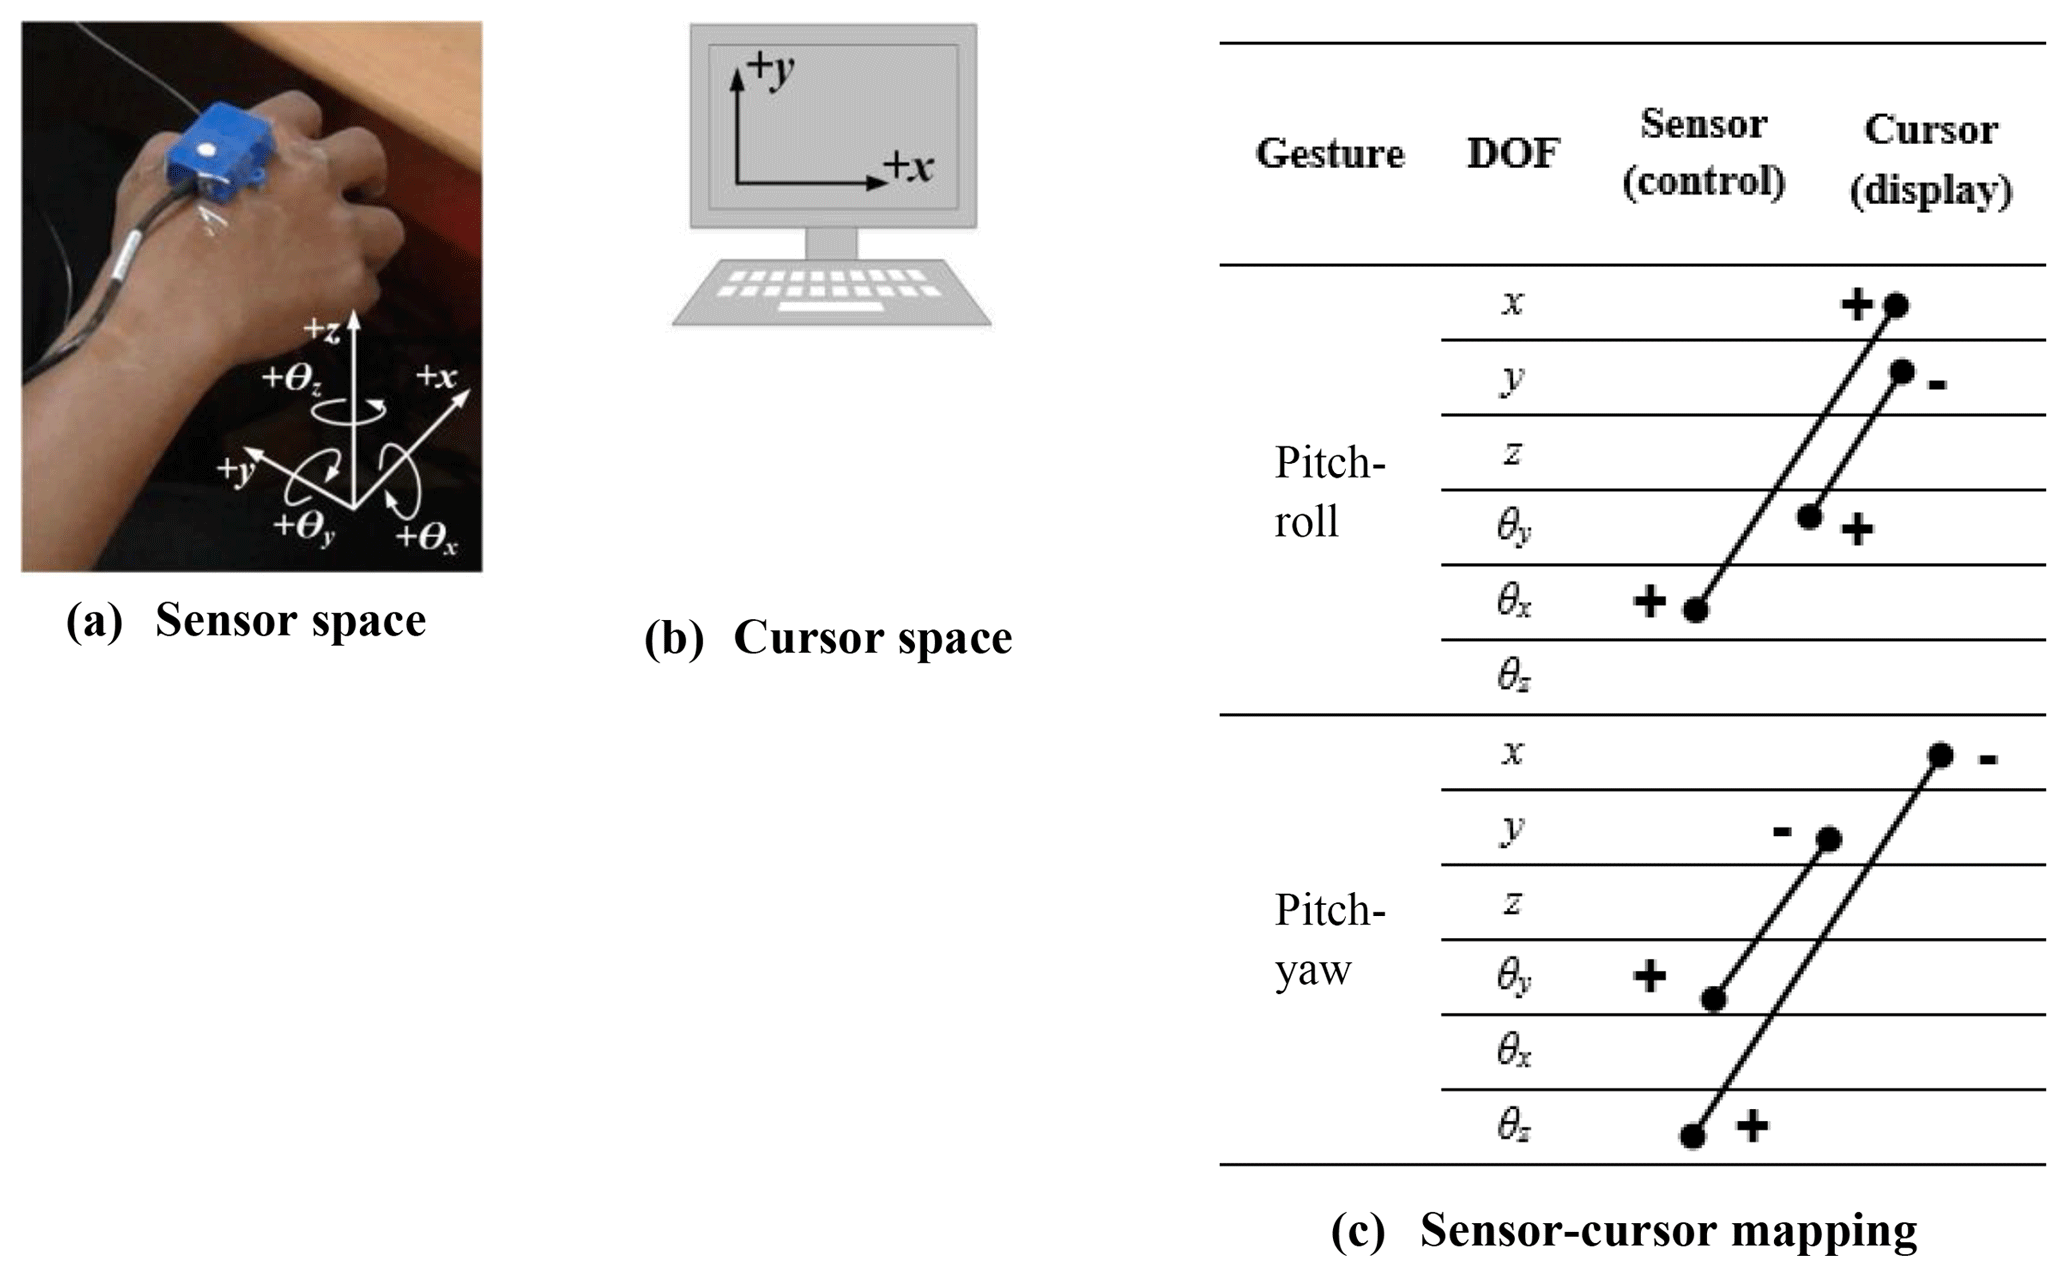
Figure 4(a) Orientation of the sensor; (b) cursor space axes; (c) the sensor–cursor mapping: “+” and “−” signs correspond to the directions in (a) and (b).
Table 2Experiment results (in detail).
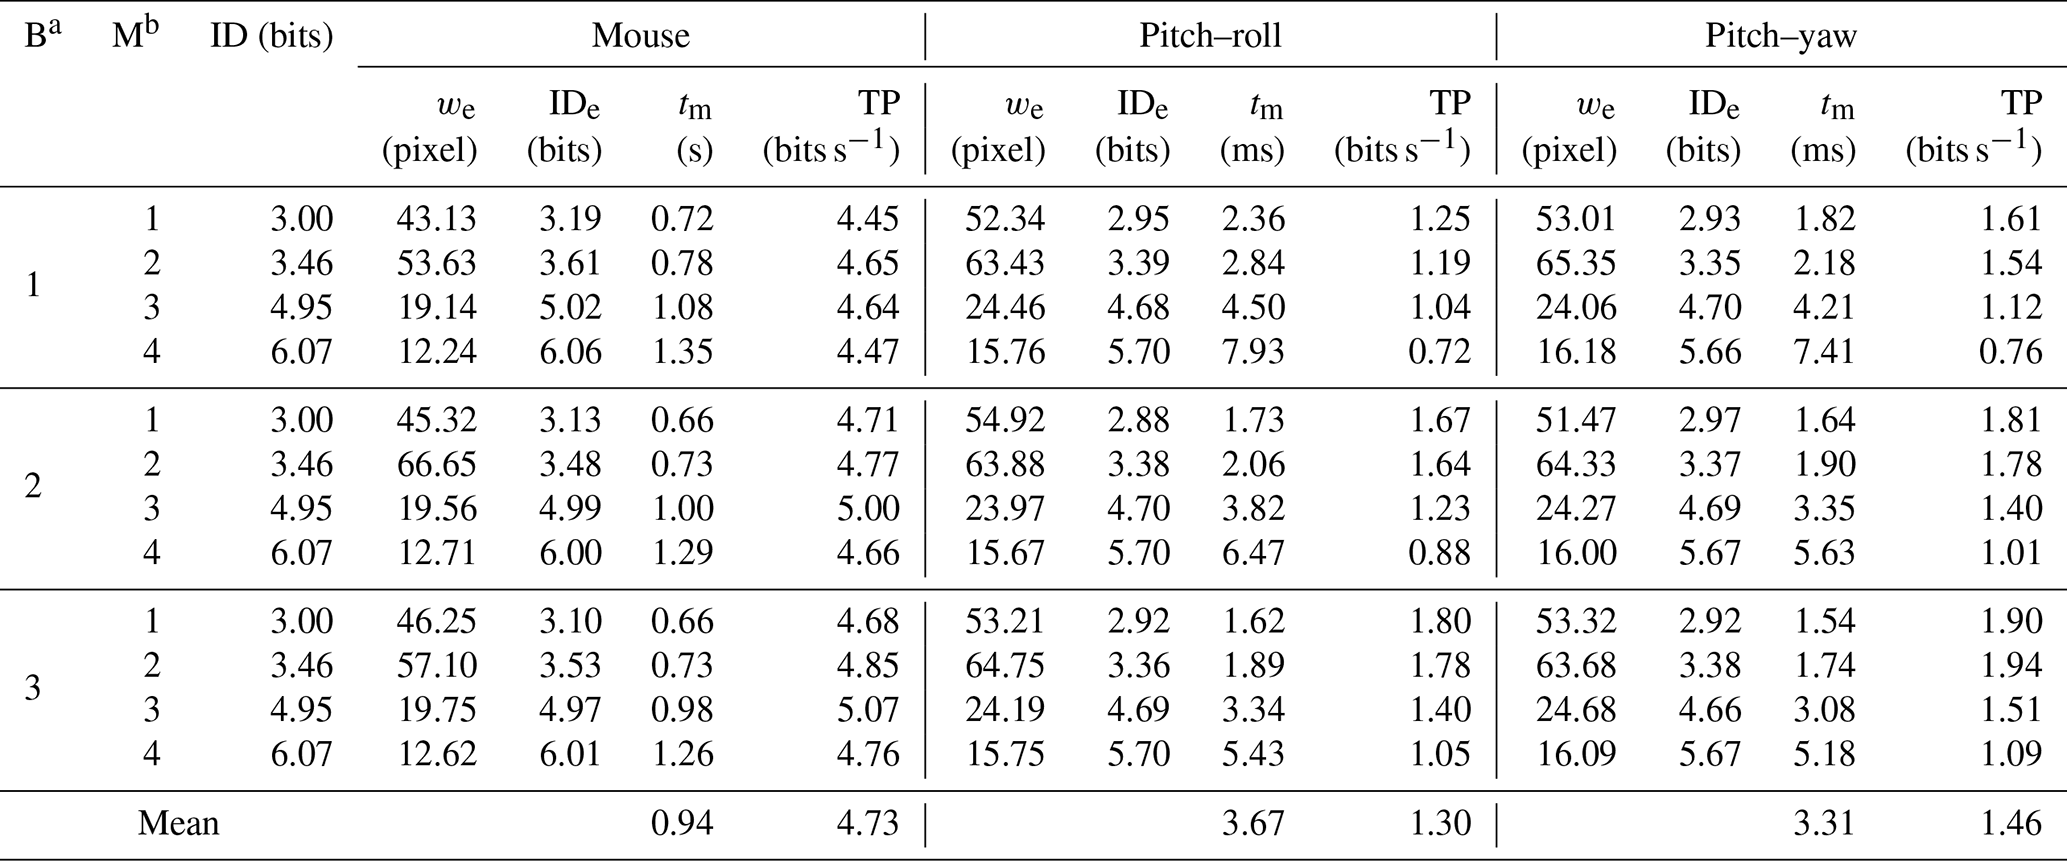
a B stands for block. b M stands for mode.
Before the experiment began, the purpose and experiment procedure were explained to every subject. Also, the subject practiced the task until the speed did not show any improvement. The sequence of the index of difficulty level was randomized, as well as the sequence of the devices. The multi-directional tapping is a point-and-click task, and each session consists of 25 clicked targets, which are indicated by 25 small circles (see Fig. 2a). The movement time was recorded starting when they clicked the first target until when they clicked the last one, as well as the clicked coordinates and the number of errors. For the “pitch–roll” gesture, a subject moved his wrist flexion–extension and forearm pronation–supination. The “pitch–yaw” gesture is a movement of wrist flexion–extension and radial–ulnar deviation.
4.1 Throughput (TP) and movement time (tm)
Throughput provides a measurement of speed and accuracy. Table 2 describes the experiment results for throughput (TP) and movement time (tm) in detail. The summary of the results includes the error rate in Table 3 presented in “mean (standard deviation)” and will be used for further discussion. The result of the error rate comes from the average number of errors of all blocks and modes for 19 subjects.
Basic descriptive statistics were conducted; deviation from the normal distribution or tests of normality were conducted using the Shapiro–Wilk test; the null hypothesis is the data from a normally distributed population. Figure 5 describes the boxplot of all data distributions related to throughput and movement time.
The Shapiro–Wilk testing for normality indicated that the TP was normally distributed for the mouse, pitch–roll, and pitch–yaw device group (p > 0.05). Next, the test of homogeneity of variances using Levene's test yields significance at p=0.025, meaning that variances of TP categories in devices are not equal. The assumption of homogeneity of variances is not met. The Welch ANOVA was used to understand whether there is a difference in mean of throughput value in all devices. The null hypothesis: all TP value means are equal (i.e., ). The alternative hypothesis (HA) is that at least one category mean is different. The Games–Howell post hoc test shows that the multiple comparison table revealed that there are statistically significant differences between the mouse and the two other devices (p < 0.05), but there is no statistically significant difference between pitch–roll and pitch–yaw.
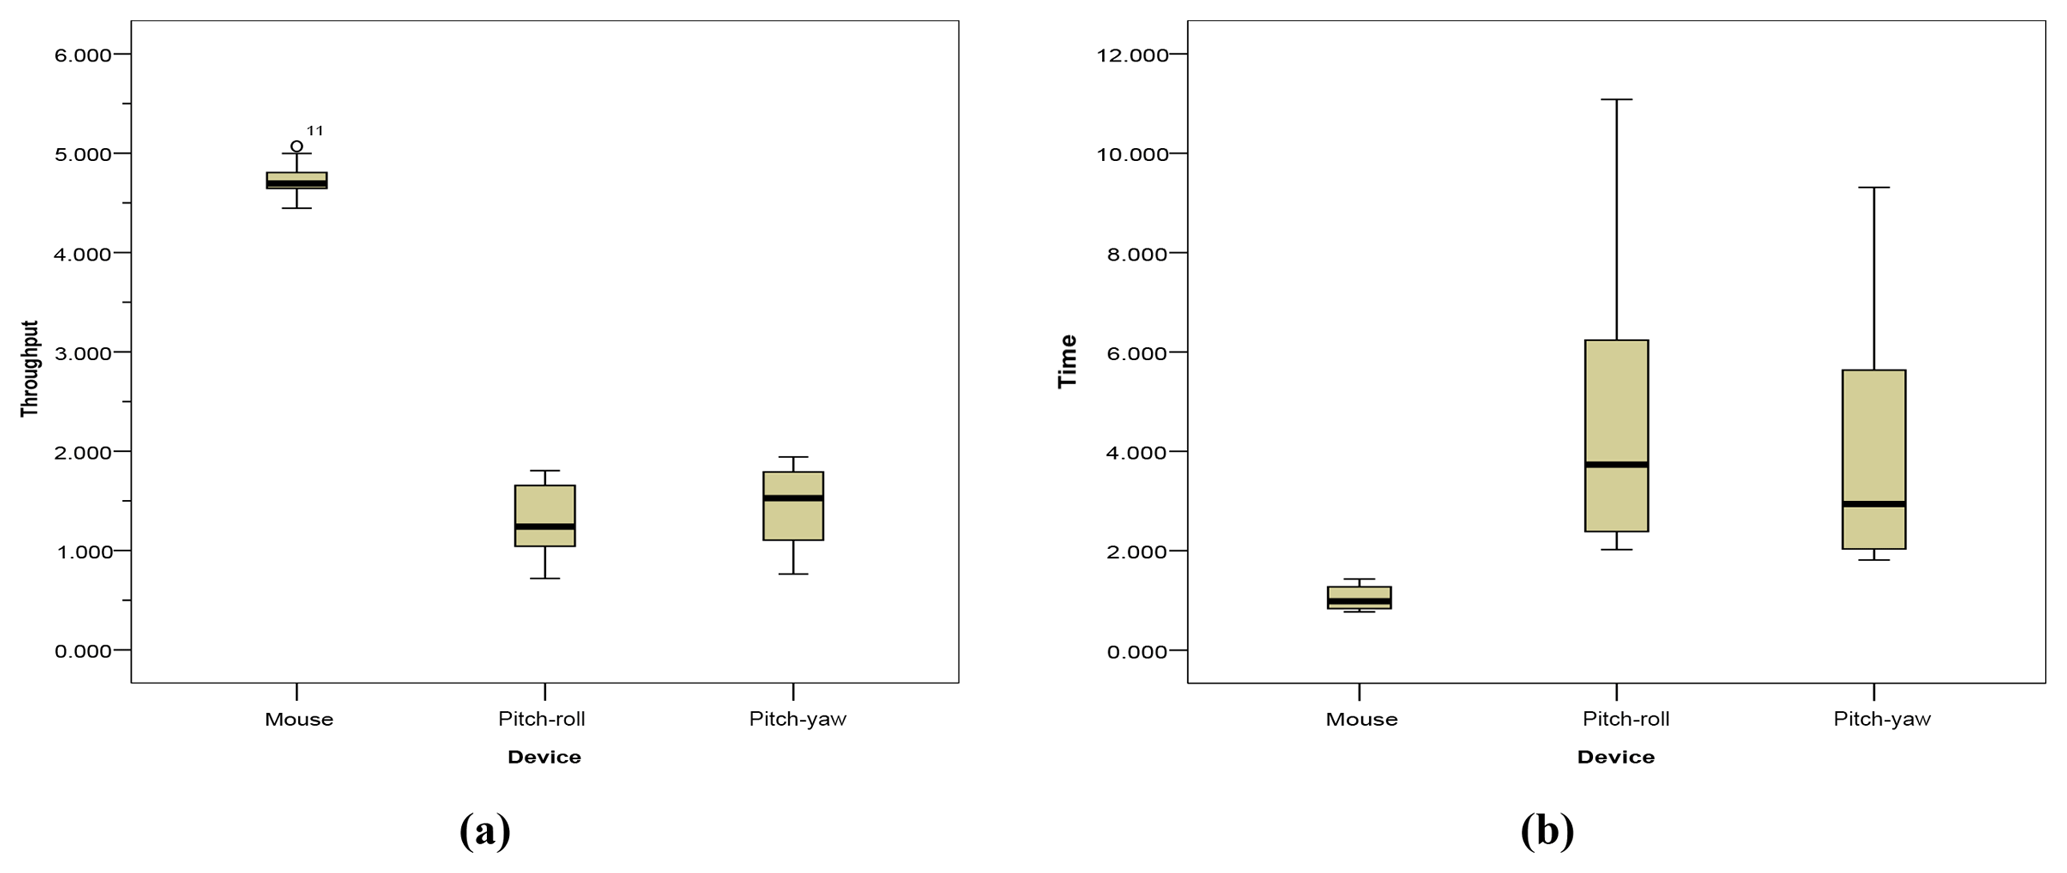
Figure 5The boxplot of all data distribution related to (a) throughput (in bps) and (b) movement time (in seconds).
The test for tm indicates that pitch–yaw is p=0.046, suggesting evidence of non-normality. The independent Kruskal–Wallis test is summarized as follows: the mean ranks of tm values were statistically significantly different between categories (χ2(2) = 23.473, p=0.0005). The Mann–Whitney U post hoc test using multiple comparisons was conducted to interpret all pairwise comparisons. The results indicate that the tm in the pitch–roll category was not statistically higher than in pitch–yaw (U=63, p=0.603). However, the tm in the pitch–roll category is significantly higher than in mouse (U=0.0005, p=0.0005) and the tm in the pitch–yaw category is also significantly higher than in mouse (U=0.0005, p=0.0005).
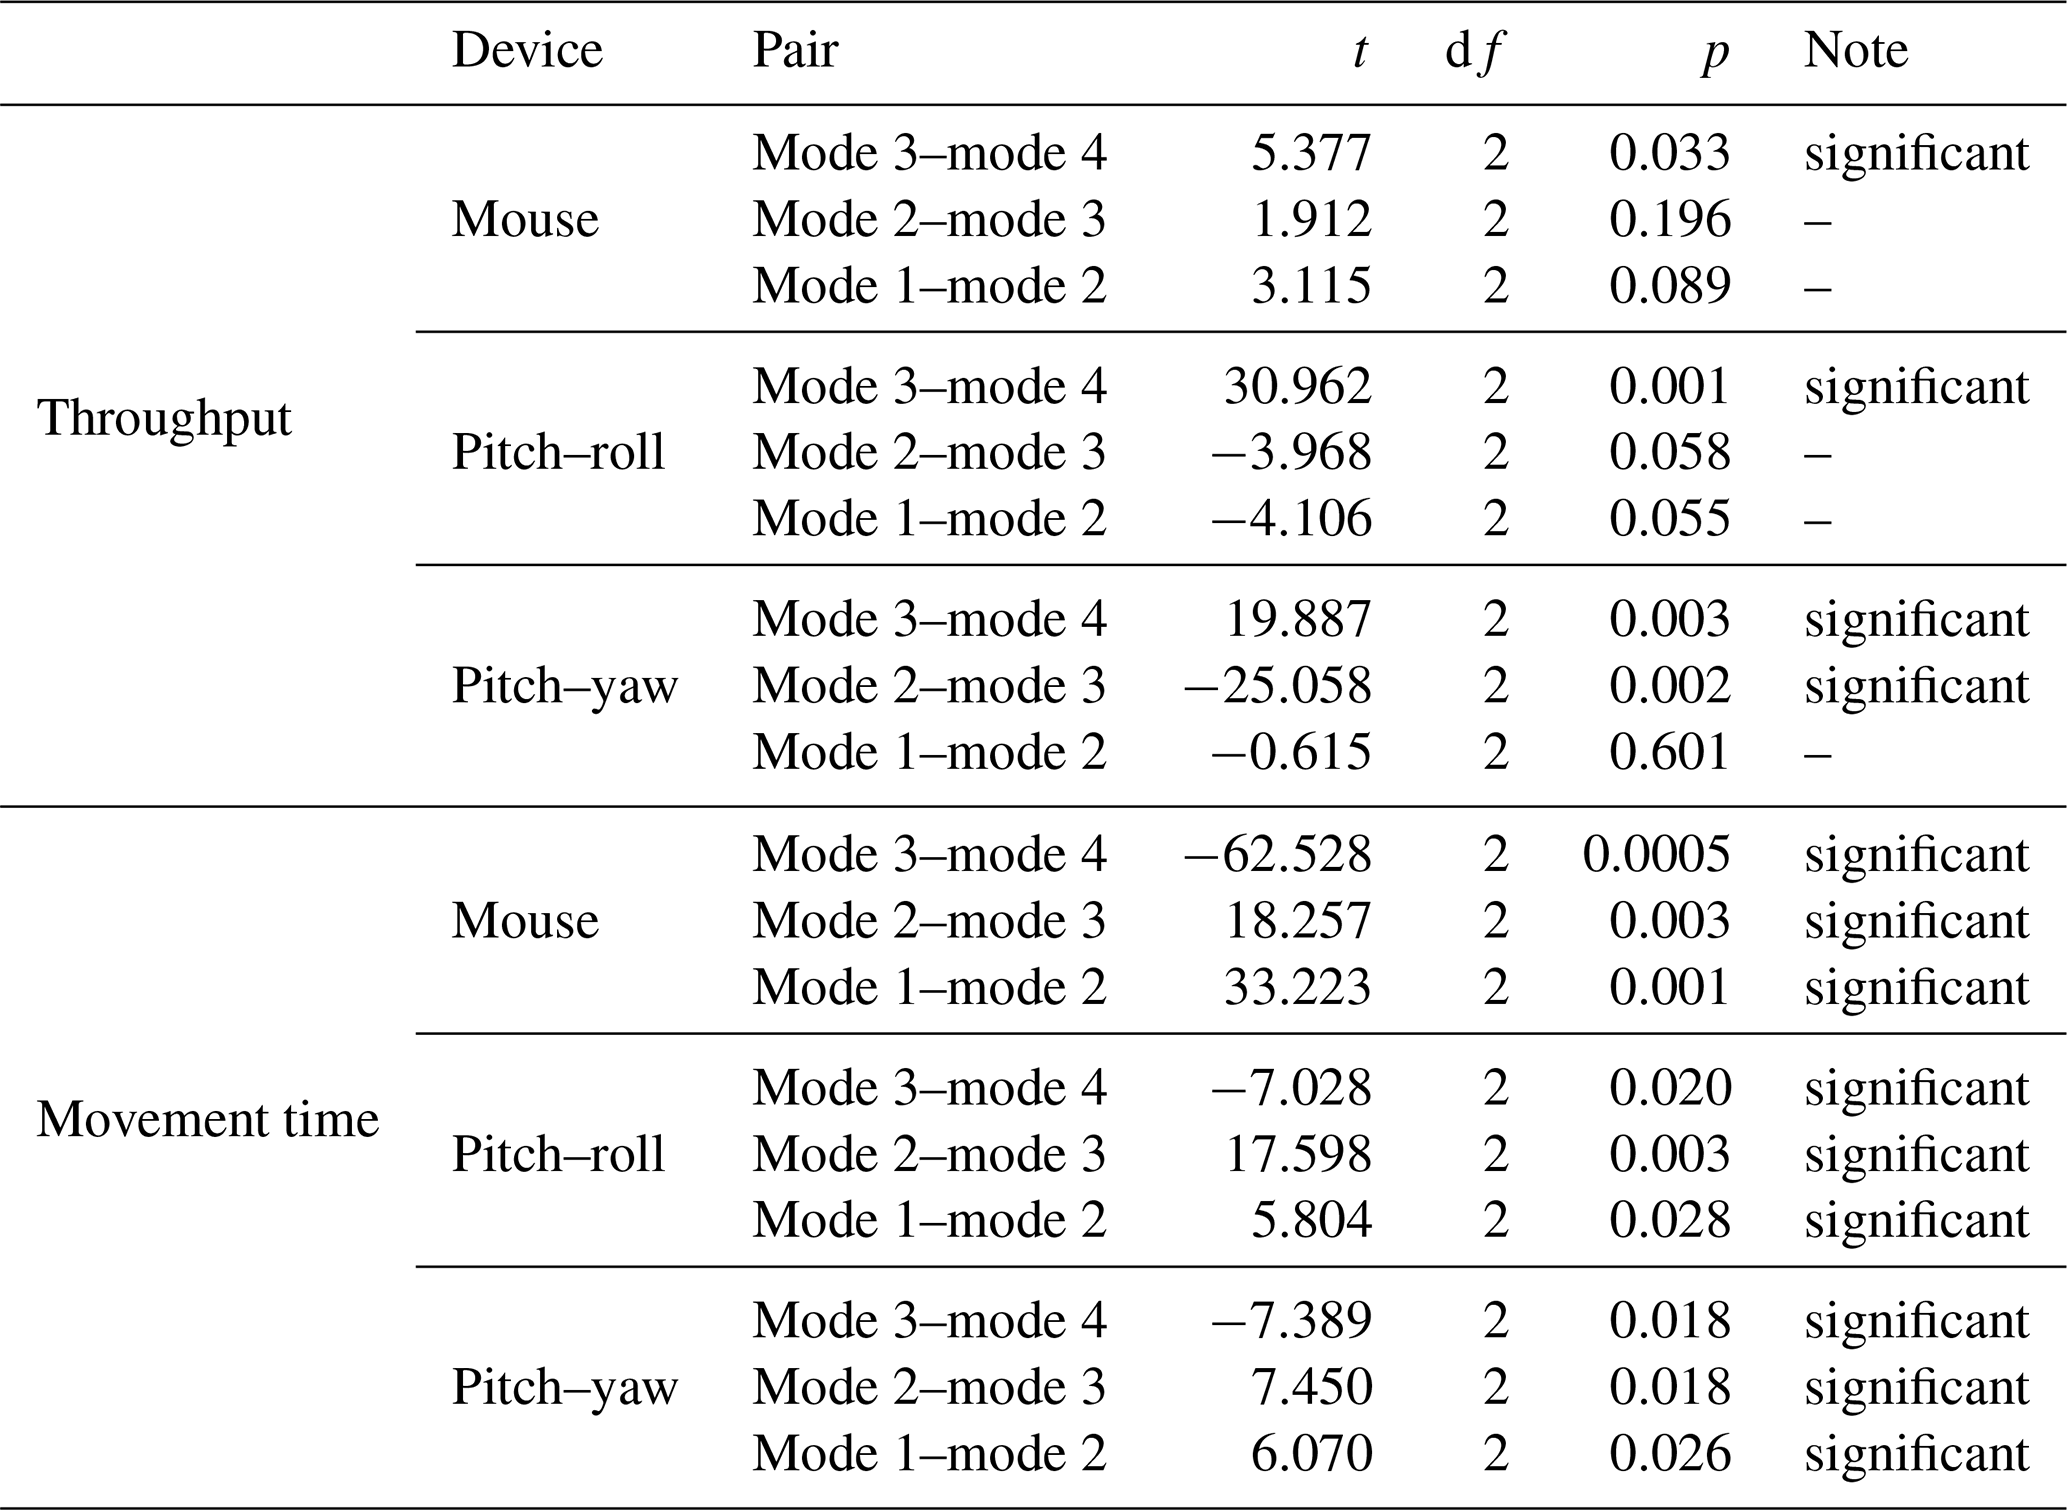
To deeply analyze the influence of the index of difficulty (mode), the dependent-t test was conducted to compare the means between each mode on TP and tm. The dependent variable is the value of TP and tm, while the independent variable is the same subject present on two occasions on the same dependent variable. Table 4 concludes the results of significance levels of each pair. We could see that in all devices, mode 3 and mode 4 have statistically significant difference results. Mode 4 is the most difficult mode, which causes the difference.
Table 4The result of comparison of means (paired samples test).
4.2 Error rate
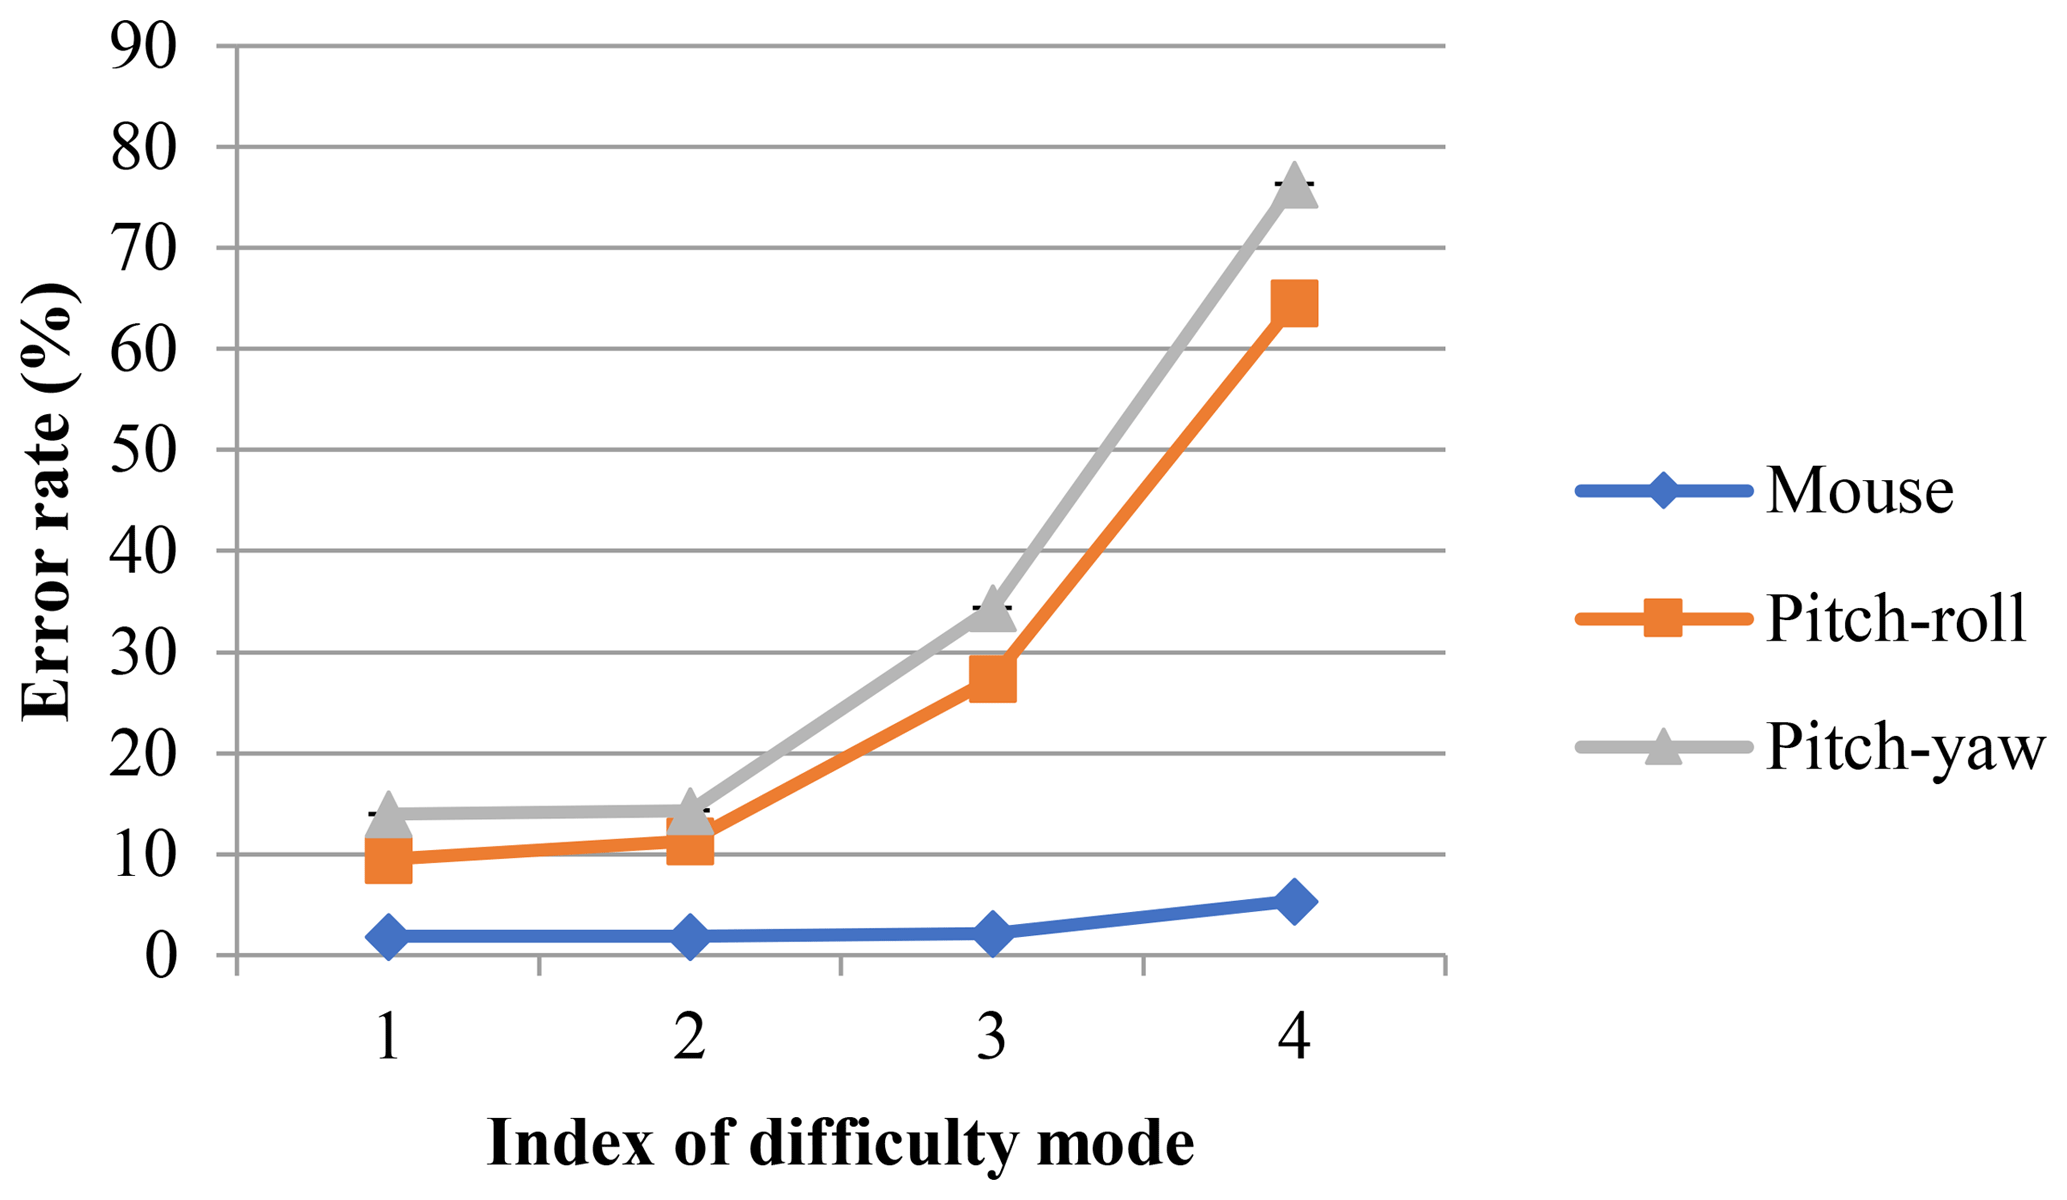
The percentage of clicked coordinates outside the target was calculated and the average is shown in Table 3. Figure 6 shows the graph of error rate using mode as a repetition. The error rate is related to the index of difficulties; as previously mentioned, mode 1 is the lowest level of difficulty and mode 4 is the highest level of difficulty. Therefore, as expected, the error rate of mode 4 is the highest.
As shown in Fig. 6, the error rates of modes 3 and 4 of the sensor's gestures are far above the error rate of the mouse. The error increment from modes 2 to 3 at pitch–roll and pitch–yaw is 59 % and 58 %, respectively. The error-rate increment is very large compared to the increment of the mouse from modes 2 to 3, that is, only 11 %. The huge increment of the error rate also occurs from modes 3 to 4 for pitch–roll and pitch–yaw, which is 58 % and 55 %, respectively.
4.3 Qualitative results
We conducted the assessment of comfort and fatigue using a seven-question questionnaire (α= 0.79) and a five-question questionnaire (α=0.85), respectively. Each question in comfort and fatigue assessment was a seven-point Likert scale from “very low” to “very high” levels of comfort; however, in the fatigue test, the scale is from “very high” to “very low” levels of fatigue; therefore, option 7 is the best impression. Figure 7 shows the results of the comfort questionnaire (items 1 to 7) and fatigue questionnaire (items 8 to 12). Table 5 describes the mean result of the questionnaire.
Table 5Qualitative result.
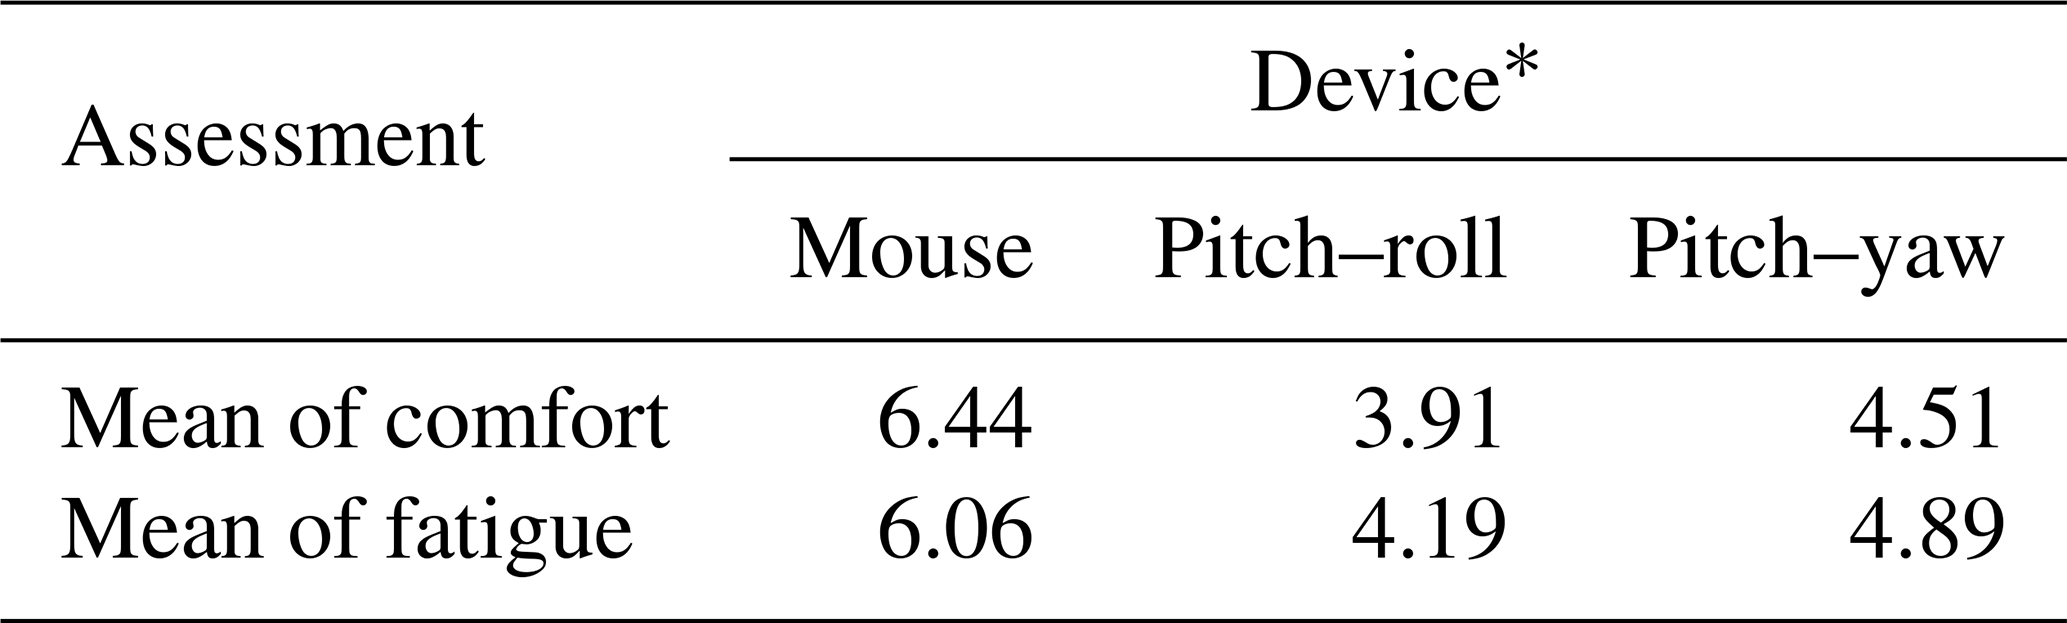
* On average using the seven-point Likert scale; 7 is the best impression.
By far, all subjects were most comfortable with the mouse over the pitch–roll and pitch–yaw in all items. For a representative report, we take item number 7 (“Overall operation of input device”) as an indicator (U=27.5, p < 0.05) of mouse compared to pitch–roll and (U=46, p < 0.05) for mouse compared to pitch–yaw. Another significant difference is in items 10, 11, and 12 (arm, shoulder, and neck fatigue): it was reported that pitch–yaw was less in fatigue than the pitch–roll gesture was (U=89.5, p=0.006; U=107.5, p=0.029; and U=109.5, p=0.035).
The other assessment is RPE by using the Borg scale (0, 0.5, 1–10 scale; from “nothing at all” to “very, very strong (almost max.)”) which is conducted on arm, shoulder, and neck effort assessment. Table 6 describes the details of the RPE assessment result. Spearman's rank-order correlation revealed that the shoulder's effort of the pitch–roll and pitch–yaw relationship had a strong and positive correlation, which was statistically significant (rs=0.77, p < 0.05). We found that the assessment of effort in the arm is superior in all devices: it needs more effort to move the cursor to the targets.
Table 6The result of rating of perceived exertion (RPE) assessment using the Borg scale.

* On average using the Borg scale (0, 0.5, 1–10 scale); 0 is the best impression.
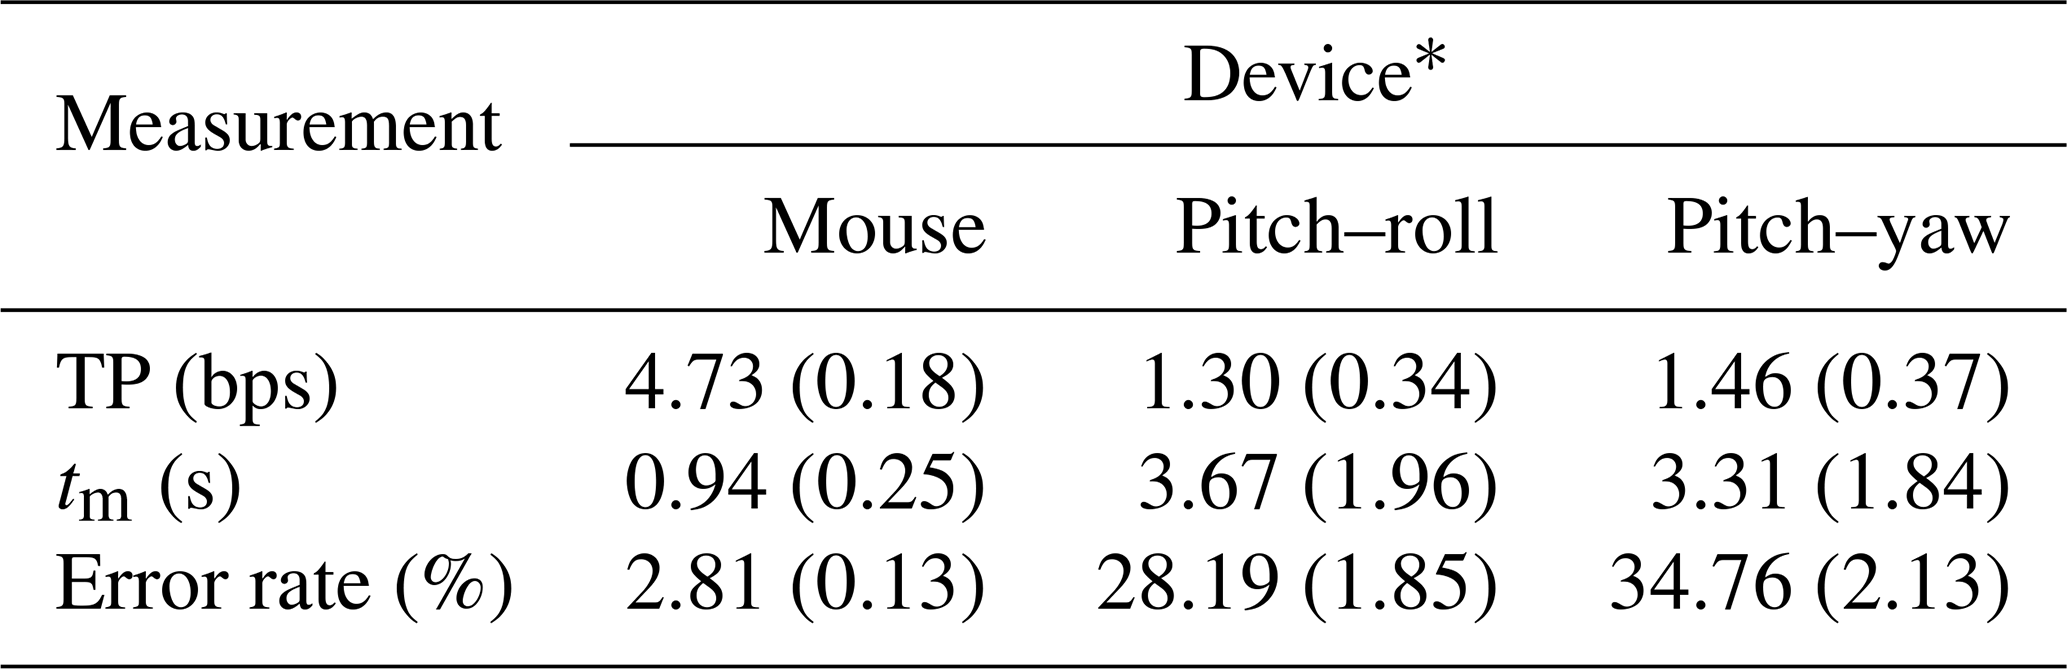
The results of a performance assessment, shown in Table 3 as indicated by throughput, revealed that the TP of the mouse is 4.73 bps. This is in line with prior studies, which have noted the range of the mouse's TP as 3.7–4.9 bps (Soukoreff and MacKenzie, 2004), and in MacKenzie and Jusoh (2001), where the range is 3.0–5.0 bps. The results of the experiment ensure that the methodology, experimental apparatus, data collection, etc., are apparently in alignment with other researchers' techniques.
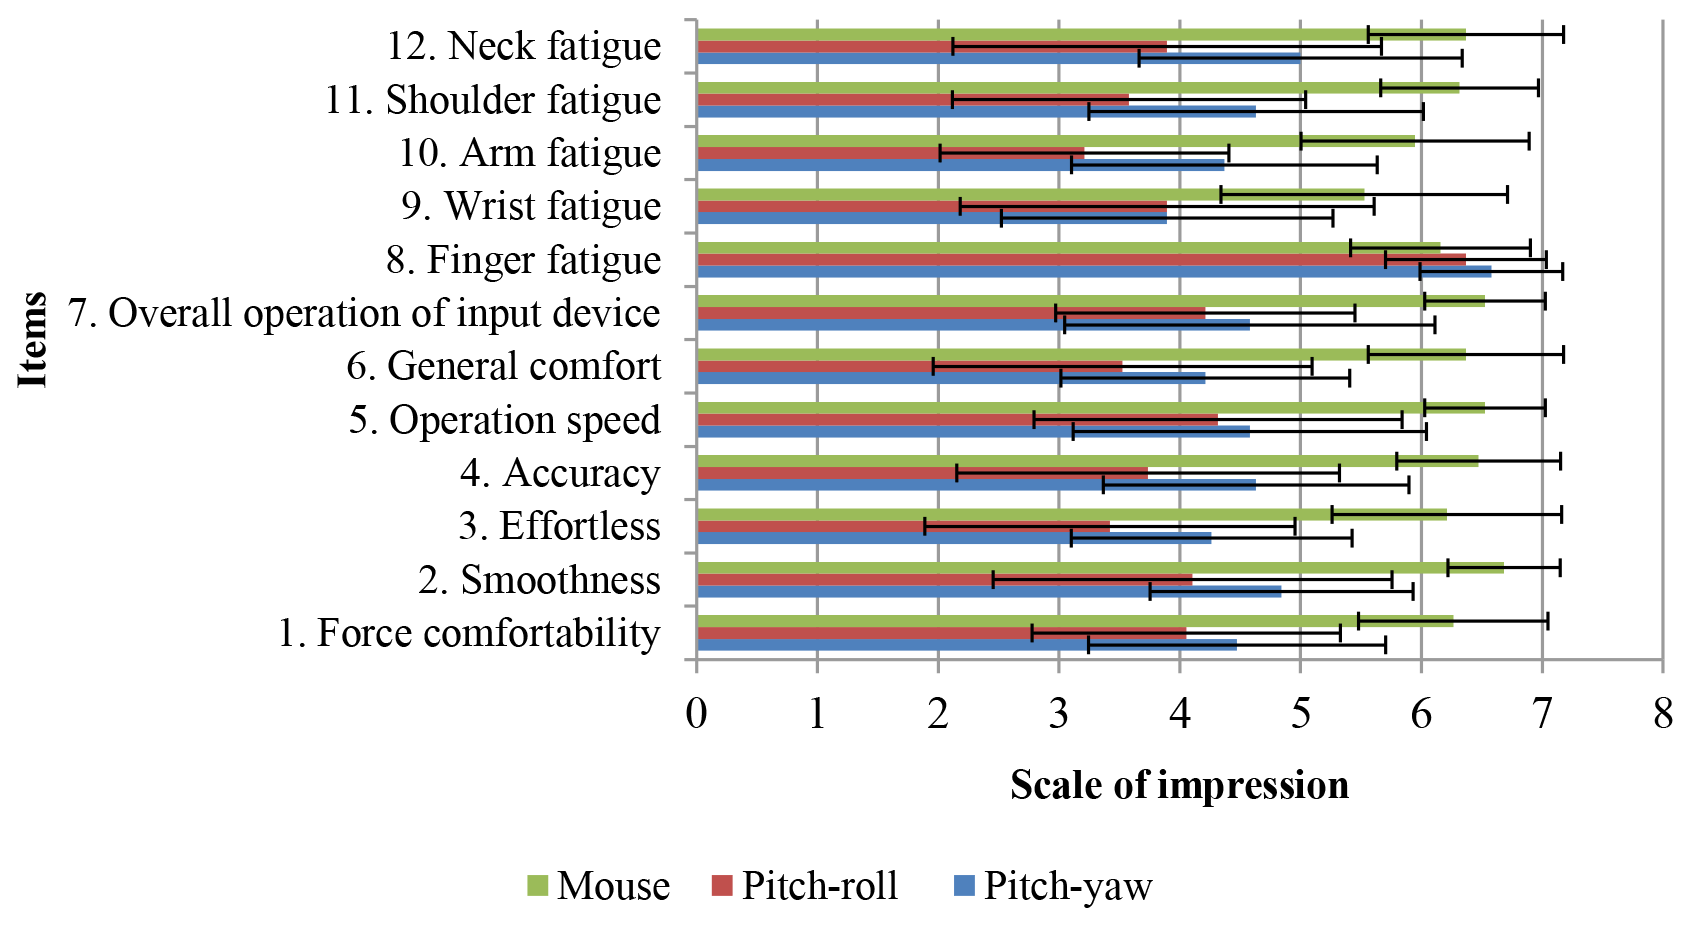
Figure 7Results of the pointing questionnaire, where option 7 on the Likert scale is the best impression.
The results of the TP of two gestures, pitch–roll and pitch–yaw, are different with the TP of the mouse. Since the TP is related to precision and movement time, we found that the error rate between the mouse and the two gestures is also statistically different. However, in the case of TP and movement time between the two gestures, it is not statistically different, although the TP of pitch–yaw is larger than the TP of pitch–roll. To understand which part of the index of difficulty causes the significant difference, we conducted a paired samples test, as shown in Table 4. The results of this study indicate that a comparison of mode 3 and mode 4 is statistically different in TP as well as in tm. Similarly, we found that comparisons of TP in modes 2 and 3 are statistically different. Based on Table 4, we suspect that the level of difficulty in modes 3 and 4, for both the pitch–roll and pitch–yaw, does not represent a suitable task for the sensor. The discussion below includes the error rate and will complete the discussion of the effect of the difficulty level of the task.
The error rate of the mouse is 2.81 %; pitch–roll is 28.19 % and pitch–yaw is 34.76 % (see Table 3). We believe that the large error rates in those gestures are due to the level-of-difficulty factor. Next, we omit the highest level of difficulty (mode 4) and recalculate the average error rate. The average error rate after omitting mode 4 is 1.95 %, 16.06 %, and 20.90 % for mouse, pitch–roll, and pitch–yaw, respectively. This means there is a decrease in the error rate of 31 %, 43 %, and 40 % for mouse, pitch–roll, and pitch–yaw, respectively, after omitting mode 4. At the same time, the influence of mode 3 and mode 4 was investigated by omitting both of them in the analysis. We found that the error rate would be reduced to 33 %, 63 %, and 59 % for mouse, pitch–roll, and pitch–yaw, respectively. The research regarding arm jitter using inertial sensor measurement in Noy et al. (2015) demonstrates that arm jitter ranges from 0.7 to 1.15 Hz. This means that, to reach the 2 % error rate of an underdamped response, a person needs around 0.87 to 1.43 s; relatively speaking, the time to reach the clicked target would be increased due to the number of pixels in the smaller target'. The tasks with medium and high levels of difficulty have only 20 and 12 pixels of target width, respectively (see Table 1); the target's width is too small and almost the same as the target width in the studies by Widodo and Matsumaru (2013) and by Myers et al. (2002). The previous studies used a laser-pointer spot interface to emulate the mouse's cursor, which is also prone to arm jitter, as in our study; in those studies, the subject experienced difficulty tapping the target. This result strengthens our suspicion that the difficulty level, such as in mode 3 and mode 4, is not in accordance with the task of the orientation sensor as a pointing device.
The results of two gestures succeeded as a substitute for the movement of a computer mouse. Despite this improvement, there was a significantly high error rate, especially for the medium- and high-level tasks (mode 3 and mode 4). The natural jitter of the arm, as mentioned in Noy et al. (2015), indicates that people need more time to tap the actual clicked target, such as a point (xc,yc) in Fig. 3b. It is difficult if the diameter of the target is small, as in mode 3 and mode 4 tasks. In the future, a more rigorous pointing device using an inertial sensor needs to be combined with a special filter to dampen the jitter. Filtering methods such as a complementary filter and Kalman filter are important to consider in order to improve accuracy and measurement reliability. Other potential improvements for accuracy may be made by taking a mechanical approach and using, for example, an elbow band, shoulder support, and/or wrist support to dampen arm jitter.
The qualitative results were concluded in Table 5 and Fig. 7; we found that Cronbach's alpha is 0.79 and 0.85 for comfort items and fatigue assessment items, respectively. This indicates that all the items have a satisfactory level of reliability as this research is in the early stage, as stated in Nunnally and Bernstein (1994). The subjects' opinions show that pitch–yaw results in less fatigue in the arm, shoulder, and neck than pitch–roll does (U=89.5, p=0.006; U=107.5, p=0.029; and U=109.5, p=0.035). Overall, pitch–yaw results in less fatigue compared to pitch–roll, and this might be caused by the muscles involved. The pitch and yaw represent the wrist movement that results from flexion–extension and radial–ulnar deviation of the wrist, respectively. However, the roll movement results from forearm movement, called pronation–supination of the forearm. Now, we would like to compare only “roll” and “yaw” since both of them use different gestures in our study. The “roll” range of motion is only 13∘ to the left (pronation) but 53∘ to the right (supination), as stated in Gates et al. (2016). However, we observed that the range of motion of “yaw” is 28∘ to the left (radial deviation) and 38∘ (ulnar deviation) to the right. The pronation and radial deviation results in the cursor moving to the left of the monitor display and in the opposite direction for supination and ulnar deviation. The subject experiences greater exertion caused by the limitation of the left “roll” range of motion, which is only 13∘; the subject might use effort to move above the normal limit of his/her range of motion to attempt to move the cursor to the far left of the monitor display. However, for “yaw,” the range of motion is greater and reaches 28∘. Thus, the pitch–yaw results in less fatigue than the pitch–roll does.
Through the rating of perceived exertion using the Borg scale of perceived exertion, another finding revealed that pitch–roll and pitch–yaw gestures have a strong and positive correlation with shoulder effort. These gestures have the same effect of fatigue on the shoulder due to the position of the forearm during experiments; i.e., the forearm rests on the chair's armrest.
The aim of the present research was to examine the hand orientation to substitute the computer mouse movement; it was evaluated based on ISO/TS 9241 part 411: Ergonomics of the human-system interaction standard. Two pairs of hand orientation candidates were evaluated in terms of pitch–roll and pitch–yaw, by substituting up–down and left–right mouse-cursor movements.
Although almost all the scores of pitch–yaw overpass the scores of pitch–roll, surprisingly, no statistically significant differences were found in throughput and movement time. Perhaps the most important finding was that the significant difference among the index of difficulty is fulfilled. Therefore, the statistical analysis revealed the index of difficulty (ID) of very low and low tasks (ID≤4); in our experiment this is marked by mode 1, and mode 2 is a suitable ID when using the orientation sensor as a cursor emulation. The second major finding was that in terms of fatigue of arm, shoulder, and neck, the pitch–yaw gesture has a lower significance of fatigue than the pitch–roll gesture.
This study provides the first comprehensive assessment of hand gestures, i.e., pitch–roll and pitch–yaw to emulate a mouse for human–computer interaction based on ISO 9241-411 evaluation procedures. The empirical findings in this study provide a new suggestion for a suitable level of difficulty when using an orientation sensor to emulate the movement of a mouse cursor.
The data are available in a shared document. The link is available at https://drive.google.com/drive/folders/1doULNPc33mwuklKcJd1DJ-E2YtZ4DEtX?usp=sharing (last access: 13 February 2019).
RBW, RMQ, and RS carried out the experiment. RBW wrote the manuscript with support from RS. CW helped supervise the manuscript and gave advice during the project. RBW conceived the original idea and performed the analytic calculations.
The authors declare that they have no conflict of interest.
A very special thank you goes out to all students and colleagues in Ma Chung
University and alumni who became subjects in this research and made this
research possible. I am also grateful to Rhesdyan Wicaksono Setiawan and Septian Amrizal for
continued support and patience.
Edited by: Rosario Morello
Reviewed by: three anonymous referees
Douglas, S. A., Kirkpatrick, A. E. A. E., and MacKenzie, I. S.: Testing pointing device performance and user assessment with the ISO 9241, Part 9 standard, Proc. SIGCHI Conf. Hum. factors Comput. Syst., 15–20 May 1999, Pittsburgh, Pennsylvania, USA, 15, 215–222, https://doi.org/10.1145/302979.303042, 1999.
Fitts, M.: The Information Capacity of the Human Motor System in Controlling the Amplitude of Movements, J. Exp. Psychol., 47, 381–391, 1954.
Gates, D. H., Walters, L. S., Cowley, J., Wilken, J. M., and Resnik, L.: Range of motion requirements for upper-limb activities of daily living, Am. J. Occup. Ther., 70, 7001350010, https://doi.org/10.5014/ajot.2016.015487, 2016.
International Organization for Standardization: Technical Specification ISO, Switzerland, 2012.
Kranz, M., Holleis, P., and Schmidt, A.: Embedded interaction: Interacting with the internet of things, IEEE Internet Comput., 14, 46–53, https://doi.org/10.1109/MIC.2009.141, 2010.
Lazar, J., Feng, J. H., and Hochheiser, H.: Research Methods in Human-Computer Interaction, Elsevier Inc., Cambridge, MA 02139, United States, 2017.
Mackenzie, I. S.: Fitts' Law, in: Handbook of human-computer interaction, 1, 349–370, Wiley, Waltham, MA 02451, United States, 2018.
MacKenzie, I. S. and Jusoh, S.: An Evaluation of Two Input Devices for Remote Pointing, Eng. Human-Computer Interact., 2254, 235–250, https://doi.org/10.1007/3-540-45348-2 2001.
MacKenzie, I. S., Kauppinen, T., and Silfverberg, M.: Accuracy measures for evaluating computer pointing devices, Proc. SIGCHI Conf. Hum. factors Comput. Syst., Seattle, Washington, USA, 31 March–5 April, 9–16, https://doi.org/10.1145/365024.365028, 2001.
Myers, B. A., Bhatnagar, R., Nichols, J., Peck, C. H., Kong, D., Miller, R., and Long, A. C.: Interacting at a distance: measuring the performance of laser pointers and other devices, in: Proceedings of the SIGCHI conference on Human factors in computing systems Changing our world, changing ourselves, 20–25 April 2002, Minneapolis, Minnesota, USA, 33, 2002.
Natapov, D., Castellucci, S. J., and MacKenzie, I. S.: ISO 9241-9 Evaluation of Video Game Controllers, Proc. Graph. Interface Conf., 25–27 May 2009, Kelowna, British Columbia, Canada, 223–230, 2009.
Nelson, D. L., Mitchell, M. A., Groszewski, P. G., Pennick, S. L., and Manske, P. R.: Wrist Range of Motion in Activities of Daily Living, in: Advances in the Biomechanics of the Hand and Wrist, NATO ASI Series (Series A: Life Sciences), edited by: Schuind F., An, K. N., Cooney, W. P., and Garcia-Elias, M., 256 pp., Springer, Boston, MA, 1994.
Norman, K. L. and Norman, K. D.: Comparison of Relative Versus Absolute Pointing Devices, Human-Computer Interact. Lab, 11-5-10, 1–17, 2010.
Noy, L., Alon, U., and Friedman, J.: Corrective jitter motion shows similar individual frequencies for the arm and the finger, Exp. Brain Res., 233, 1307–1320, https://doi.org/10.1007/s00221-015-4204-1, 2015.
Nunnally, J. C. and Bernstein, I. H.: Psychometric Theory, McGraw-Hill, USA, 1994.
Oh, J.-Y. and Stuerzlinger, W.: Laser Pointers as Collaborative Pointing Devices, Proc. Graph. Interface Conf., 27–29 May, Calgary, Alberta, Canada, 141–149, https://doi.org/10.20380/GI2002.17, 2002.
Perng, J. K., Fisher, B., Hollar, S., and Pister, K. S. J.: Acceleration sensing glove (ASG), Wearable Computers, 178–180, 18–19 October, San Francisco, CA, USA, 2002.
Soukoreff, R. W. and MacKenzie, I. S.: Towards a standard for pointing device evaluation, perspectives on 27 years of Fitts' law research in HCI, Int. J. Hum. Comput. Stud., 61, 751–789, https://doi.org/10.1016/j.ijhcs.2004.09.001, 2004.
Sturman, D. J. and Zeltzer, D.: A survey of glove-based input, IEEE Comput. Graph. Appl., 14, 30–39, 1994.
Widodo, R. B. and Matsumaru, T.: Measuring the performance of laser spot clicking techniques, in: 2013 IEEE International Conference on Robotics and Biomimetics, ROBIO 2013, 12–14 December, Shenzhen, China, 2013.
Zimmerman, T. G. and Lanier, J. Z.: Computer data entry and manipulation apparatus and method, available at: https://www.google.com/patents/US4988981 (last access: 1 August 2018), 1989.
Zimmerman, T. G., Lanier, J., Blanchard, C., Bryson, S., and Harvill, Y.: A hand gesture interface device, ACM SIGCHI Bull., 17, 189–192, https://doi.org/10.1145/30851.275628, 1986.