the Creative Commons Attribution 4.0 License.
the Creative Commons Attribution 4.0 License.
 | 24 Jan 2019
An autonomous flame ionization detector for emission monitoring
Jan Förster
Winfred Kuipers
Christian Lenz
Steffen Ziesche
Franz Bechtold
Reliable and very sensitive detection of hydrocarbons can be achieved with a flame ionization detector (FID). Due to the required complex gas infrastructure for the operation of an FID, these devices have not been implemented as true field devices yet. Miniaturization by using ceramic multilayer technology leads to a strong reduction of gas consumption and allows autonomous operation of the FID with gas supply by electrolysis and without external gas infrastructure. Therefore, this research enables the use of the FID in the field. Characterization of this miniaturized FID reveals a performance comparable to conventional FIDs.


Reliable and very sensitive detection of hydrocarbons is of high importance in the context of emission control, environment protection, or the monitoring of areas exposed to explosion hazards. For emission control and environment protection small amounts of hydrocarbons on the order of some ppm must be detected to ensure that emissions comply with effective regulations. Thus, a very sensitive measurement method has to be applied to fulfill these needs. In the case of explosion protection the detection of hydrocarbons must be very reliable. Temperature and humidity as well as different substances in the surrounding area must not lead to false measurement results. Therefore, the measurement method has to be insensitive towards environmental conditions but selective towards hydrocarbons at the same time.
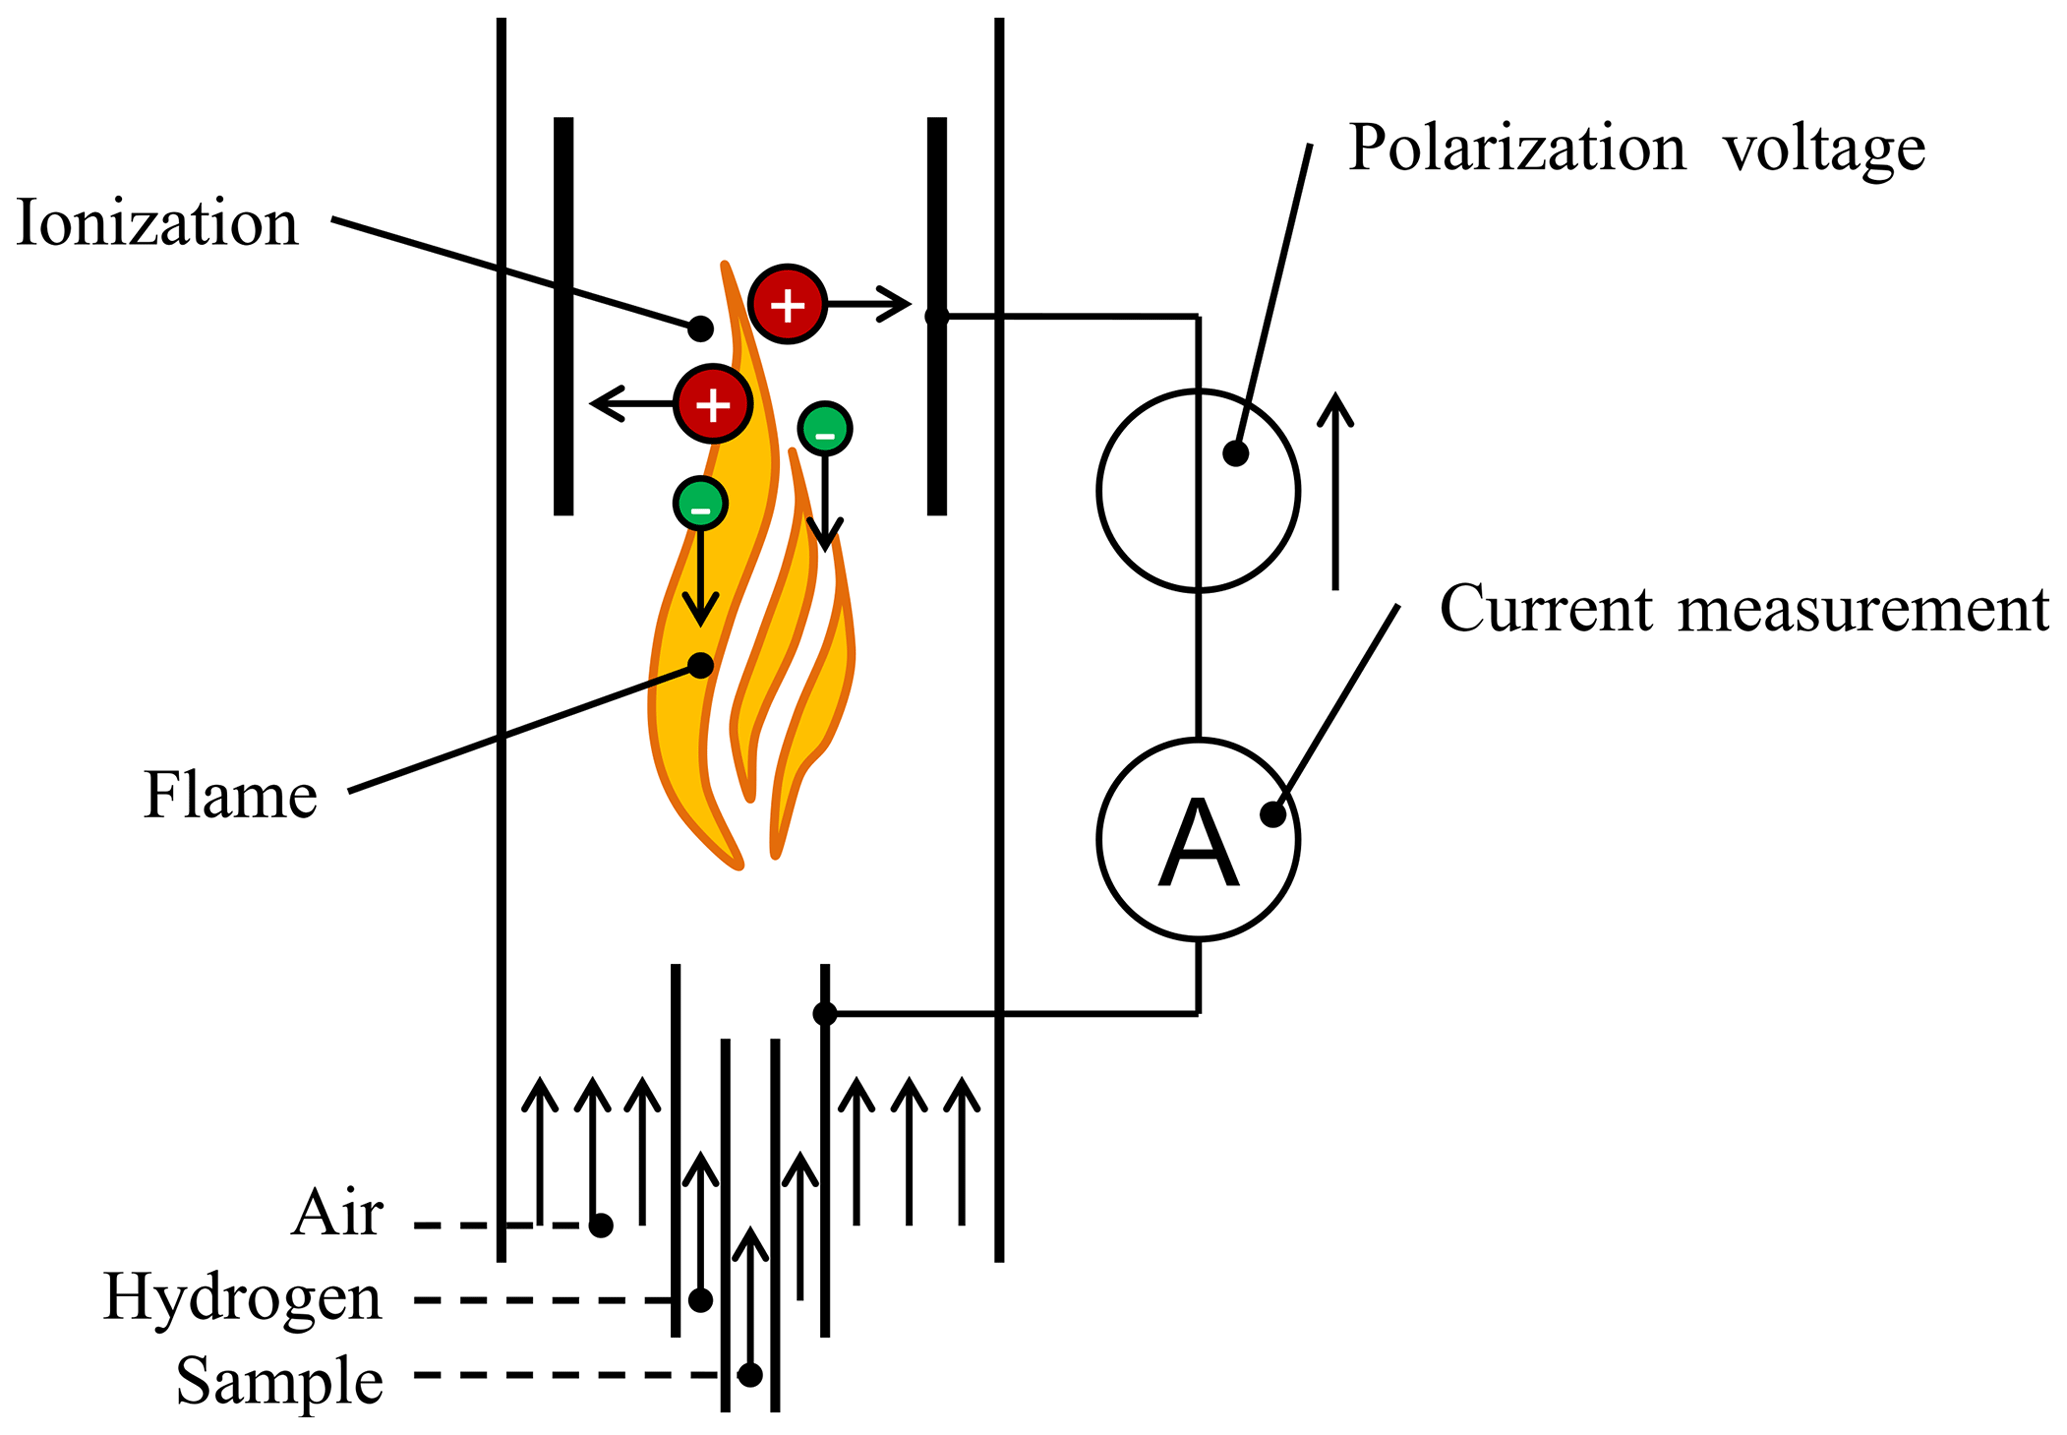
All these requirements are fulfilled by the flame ionization detector (FID) (Förster et al., 2017a). The FID is very sensitive and selective towards hydrocarbons and insensitive towards environmental conditions. In an FID hydrogen is burned in combination with air, as shown in Fig. 1. The sample gas is added to this flame. Hydrocarbons contained in the sample gas are ionized by the flame and can then be extracted by an electrical field. The resulting electrical current is proportional to the carbon content of the sample. The FID has a very low detection limit and a high selectivity towards hydrocarbons. Thus, it can reliably detect extremely small amounts of concentrations in the region of ppm or even ppb of hydrocarbons in the sample (Hill and McMill, 1992).
In the context of emission control, environment protection and explosion protection FIDs have an excellent performance. However, the true potential of FIDs is not leveraged completely due to expensive supply with the necessary pure hydrogen and conditioned air for operating. Until now, this required complex gas infrastructure has impeded the use of FIDs as field devices. Therefore, this work describes an innovative approach to realize the operation of an FID with internal electrolysis using the ceramic multilayer technology.
The electrolysis of water generates pure hydrogen (H2) and oxygen (O2). Both gases shall be used to operate the FID. Thus, the gas consumption of the FID must be reduced to suit the produced gas amounts of the electrolysis and it must be operable on pure oxygen instead of on synthetic or conditioned air. Both requirements are met by miniaturizing the FID realizing an innovative planar counter-current geometry (Kuipers and Müller, 2011), as shown in Fig. 2. The usage of pure oxygen at the high temperature of the hydrogen flame and the humidity of the gases due to the electrolysis require a high corrosion resistance of the miniaturized FID. Conventional miniaturized systems based on silicon MEMS technology (Kuipers, 2011) are not sufficient in this case. Therefore, ceramic multilayer technology LTCC, which is extremely robust towards high temperatures and chemicals, has been used to manufacture the miniaturized FID (µFID) (Lenz et al., 2016).
The ceramic µFID according to Fig. 2 consists of 11 layers, which are separately structured in the green state. First, the green tapes are geometrically structured by punching and laser ablation. Next, the metallization structures are deposited by thick-film processes screen printing and stencil printing using co-fire compatible metal pastes. Afterwards, the green tapes are precisely stacked together and are uniaxially laminated. Subsequently, the structured laminate is co-fired in a box furnace (Lenz et al., 2016).
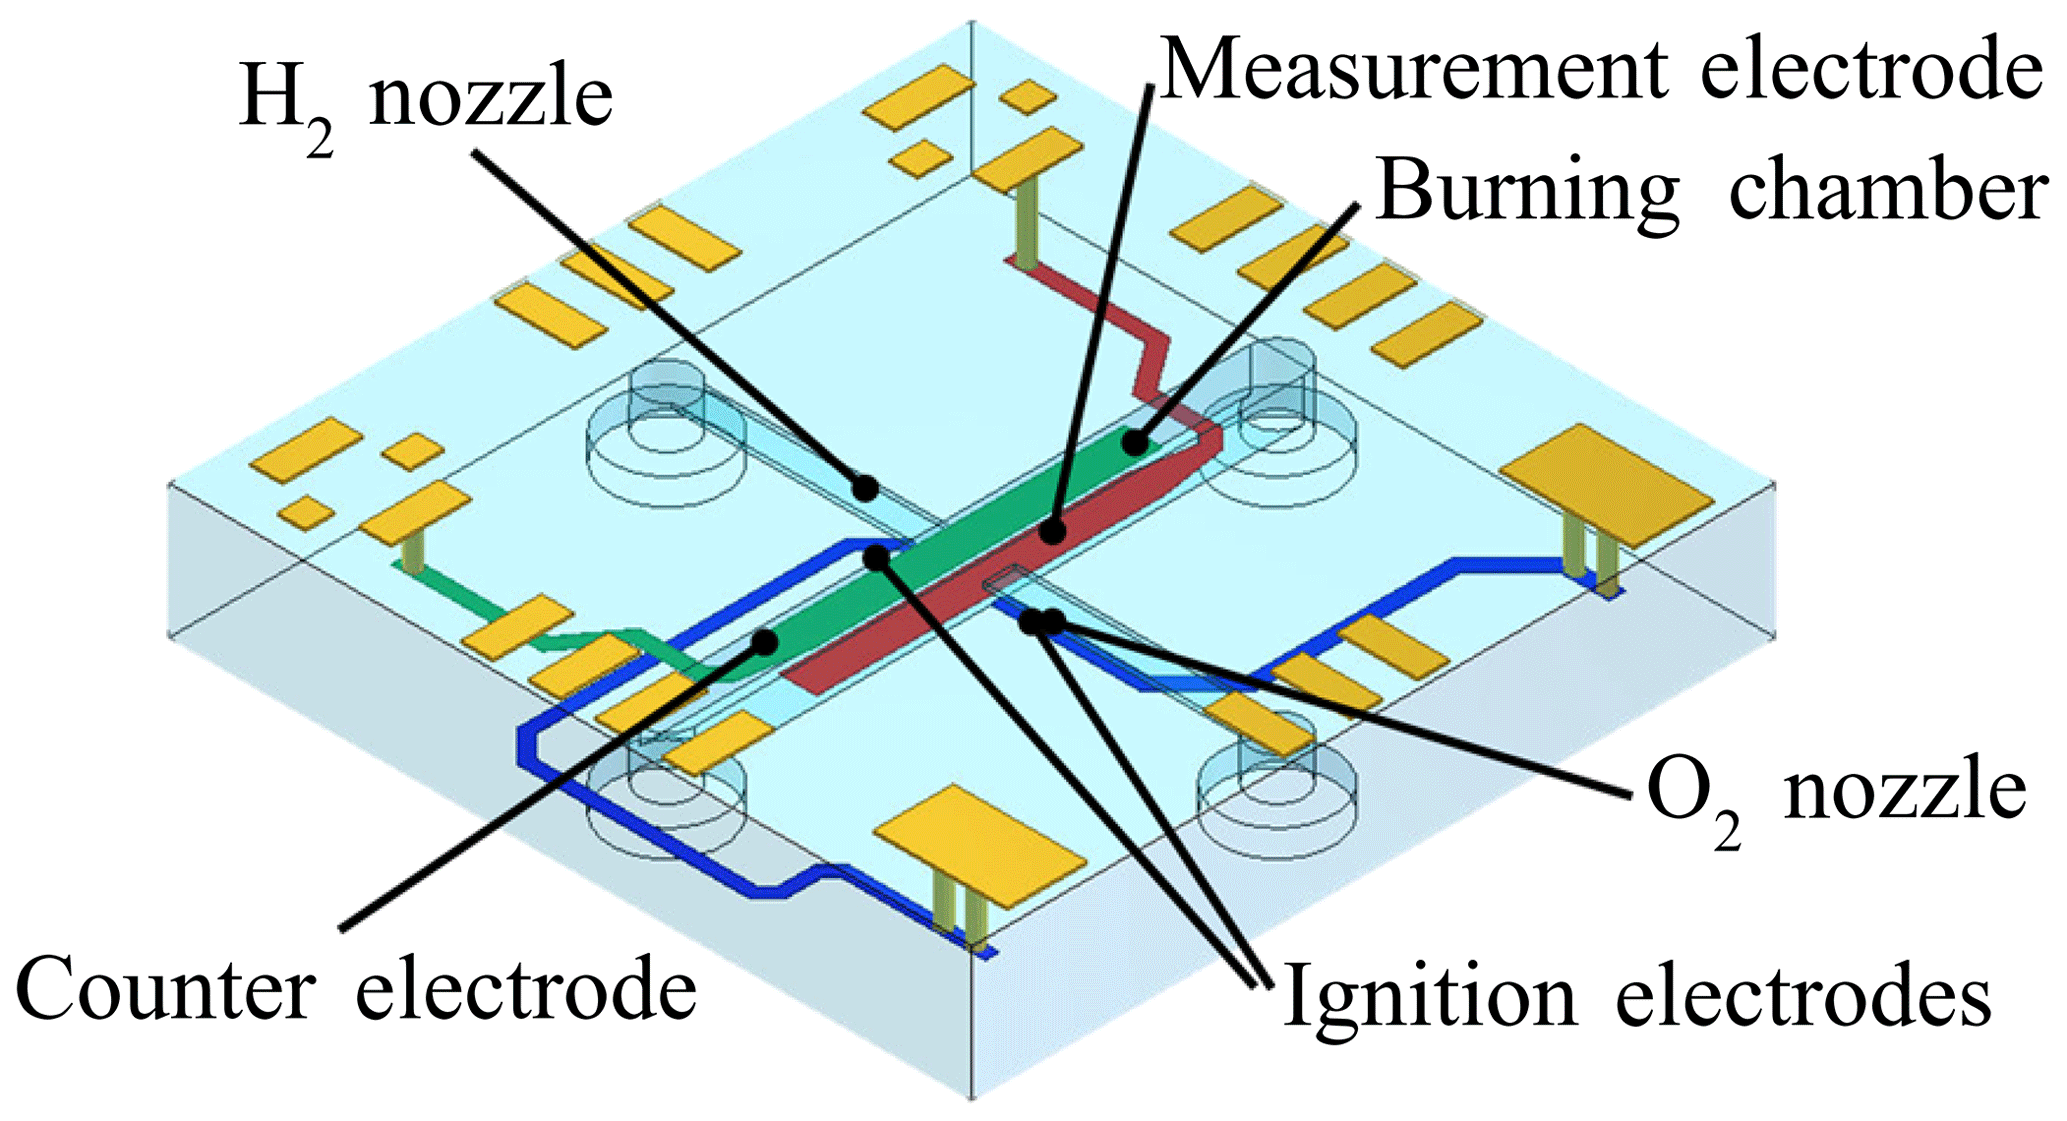
The µFID measures 15 mm × 15 mm × 2.5 mm. It has a small burner geometry in the sub-millimeter regime allowing operation with a small diffusion flame. To supply the µFID with gases and to apply all control and measurement signals, the µFID has several interfaces. All fluidic connections are placed at the rear side of the chip and all electric connections are placed at the upper side of the chip. This enables easy integration of the chip into a measurement system. Not shown in Fig. 2 is the guard electrode which is placed inside the chip to prevent it from measuring a leakage current between counter electrode and measurement electrode.
A basic overview of the peripheral components of the autonomous FID is shown in Fig. 3. The supply with burning gases H2 and O2 is done by electrolysis only. The water for the electrolyzer is stored in an internal water tank with a volume of approximately 200 mL. In general, the autonomous FID is operated below atmospheric pressure; i.e., the sample gas is taken into the FID with the help of a membrane pump and is then added to the hydrogen flow. The operation of the FID as well as of the electrolyzer is controlled by several electric circuits.

Previous characterization of the µFID revealed not only reduced gas consumption compared to conventional FIDs, but successful operation of the µFID with electrolysis only as well (Förster et al, 2017a, b). Furthermore, during these characterizations the sensitivity of the µFID was analyzed as a function of the sample gas flow for different burning gas flows (Förster et al., 2017a). Compendious results of these characterizations are plotted in Fig. 4. It was shown that sensitivity of the µFID increases with rising burning gas flows and that the sensitivity first increases with rising sample gas flow and decreases again with further rising sample gas flows. This behavior indicates a varying efficiency of the burning process due to different mixing of the gas flows in the burning chamber of the µFID (Förster et al., 2017a; Kuipers, 2011).
During the first characterizations the detection limit of the FID was analyzed. It was shown that the guard electrode inside the ceramic body minimizes the leakage currents and thus leads to a good detection limit. It is comparable to conventional FIDs. The current development state of the FID allows detection of concentrations of less than 1.0 mg m−3 carbon or of less than 500 ppb propane (C3H8), respectively. However, to evaluate whether the current development state of the FID is adequate in the context of emission monitoring, environment protection, or monitoring of explosion hazards, additional knowledge of its sensitivity towards diverse environmental influences is essential. Therefore, comprehensive measurements have been performed to evaluate the influence of oxygen and several hydrocarbons on the sensitivity of the FID.
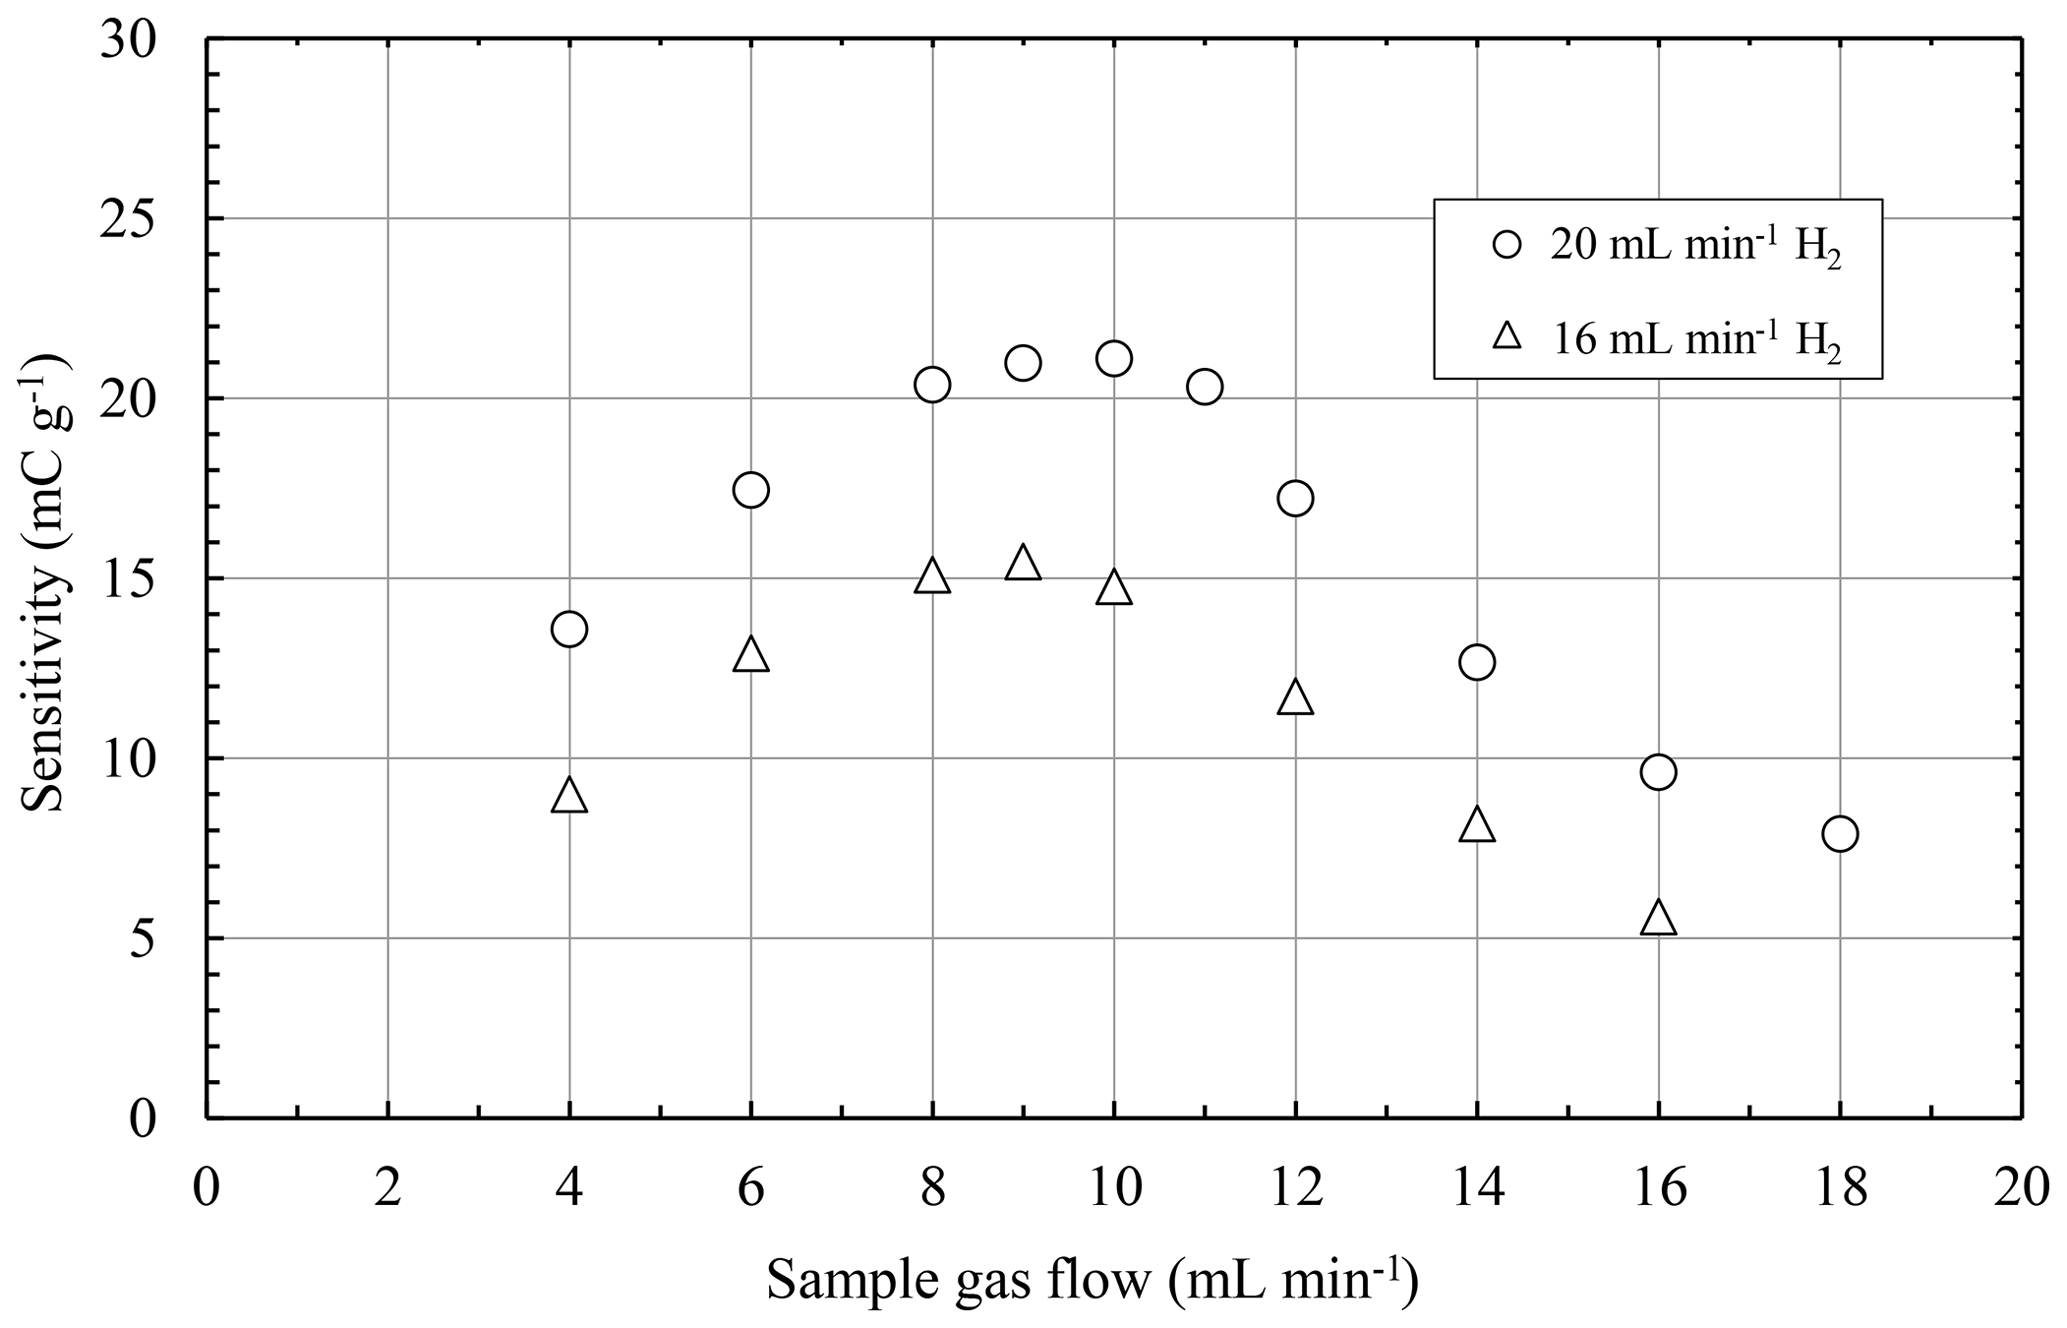
Figure 4Sensitivity of the µFID as a function of the sample gas flow for different burning gas flows.
A critical aspect in the context of emission monitoring is the sensitivity of the FID towards oxygen. As oxygen is necessary for the burning process inside the FID, a change in the oxygen content will alter the flame temperature as well as the oxidation process inside the flame. Thus, it will alter the ionization process of hydrocarbons inside the flame too. The sensitivity towards oxygen (STO) indicates how much the signal of the FID changes due to varying oxygen content in the sample gas despite a constant hydrocarbon content in the sample gas.
The STO for a fixed measurement range of hydrocarbon content is determined by measuring sample gases with different oxygen contents and constant hydrocarbon contents. The difference between these measurements related to the maximum achievable FID signal for the given measurement range of hydrocarbon content is then the STO. Of course, in the context of emission monitoring the STO should be as low as possible. For example, in Germany current regulations require the STO to be less than 2 % (DIN EN 12619:2013-4, 2019; DIN EN 15267-3:2008-03, 2019).
A schematic drawing of the setup to determine the STO of the µFID is given in Fig. 5. Sample gases with 1 % of methane in pure nitrogen (N2) and with 1 % of methane in synthetic air (20.9 % O2, 78.1 % N2) were used to determine the STO. According to regulation DIN EN 12619:2013-4 these sample gases were mixed in a way to achieve oxygen concentrations of 10 % and 20 % in the resulting sample gas. The STO was then calculated from the measurement results using the formula
where Smax represents the maximum achievable signal of FID for the current measurement range of hydrocarbon content, and S10 % and S20 % represent the signals of the FID for sample gases with corresponding oxygen contents. However, it should be noted that the hydrocarbon content of 1 % in the sample gas is much higher than the hydrocarbon content recommended by current regulations (DIN EN 12619:2013-4; DIN EN 15267-3:2008-03). Thus, the results concerning the STO give an insight into the influence of oxygen on the developed FID, but do not state a compliance with actual regulations yet.
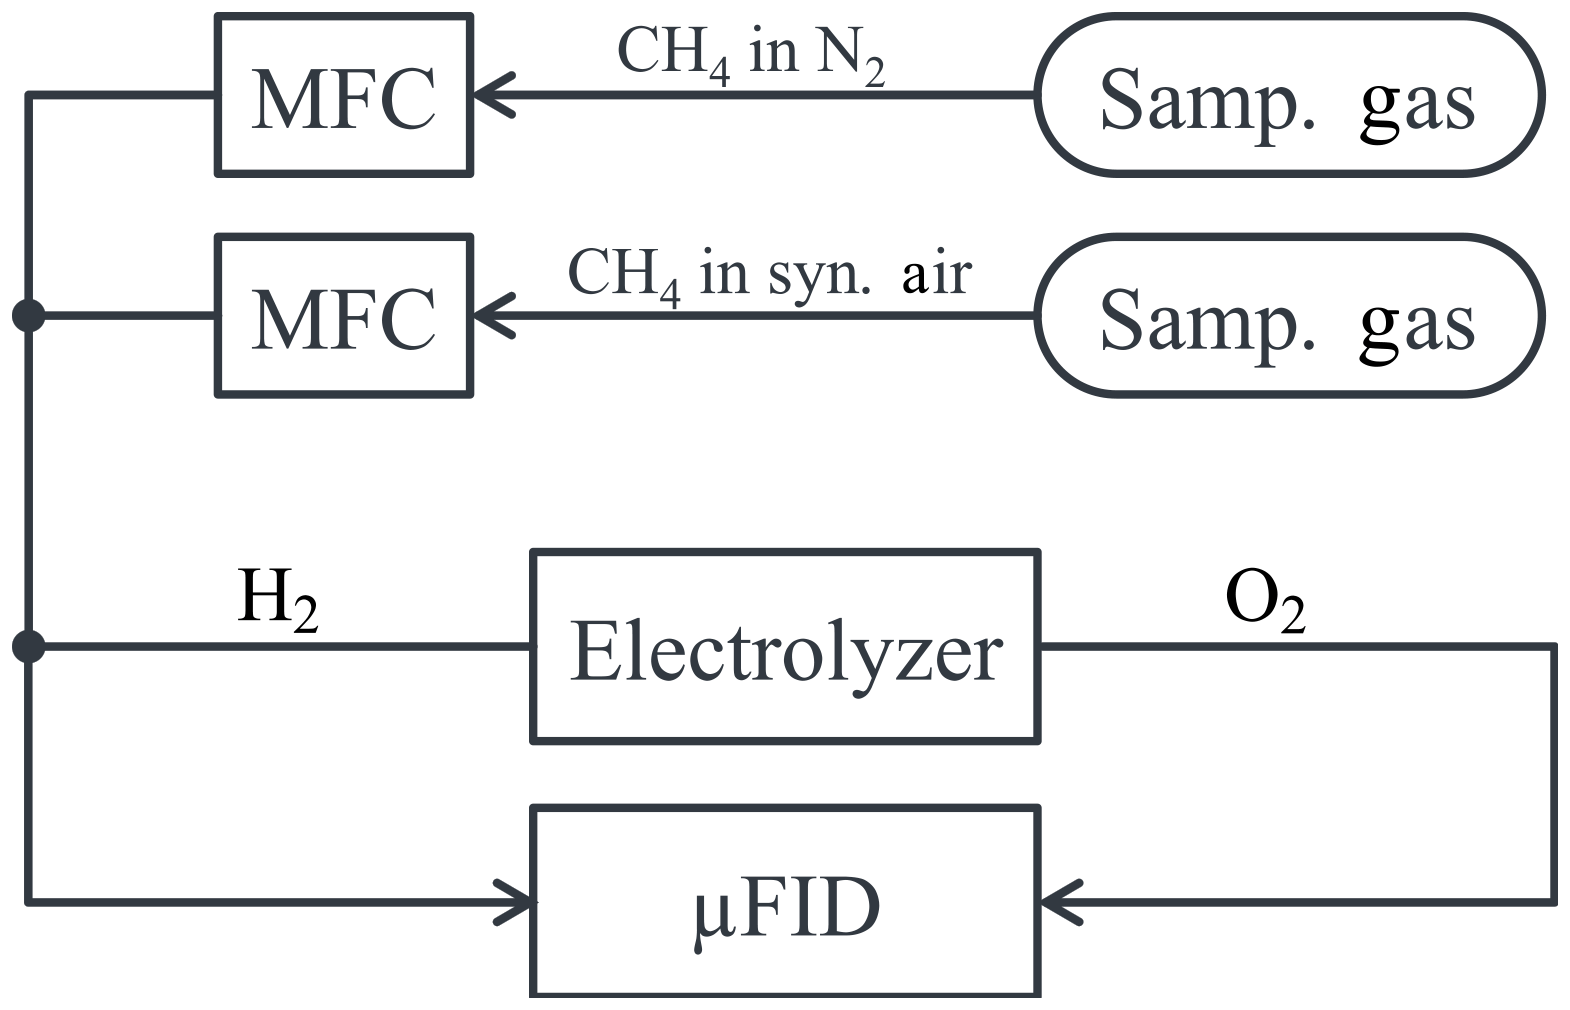
Figure 5Schematic drawing of the setup to determine the sensitivity towards oxygen of the µFID using mass flow controllers (MFCs) to control the sample gas flow.
From the first characterizations of the FID it is known that its sensitivity is a function of the flow of the burning gases as well as of the sample gas (Förster et al., 2017a, b). Therefore, the flow of the burning gases and of the sample gas were varied during the measurements to study their possible influence on the STO. Thus, the burning gas flows were set to values of 20, 16, and 12 mL min−1 H2 as well as 10, 8, and 6 mL min−1 O2, respectively. In addition, the sample gas flow was varied between 30 % and 100 % of the corresponding hydrogen flow to have a stable hydrogen flame in the FID and a wide range of sample gas flows. The STO calculated from the results of these measurements is shown in Fig. 6. The results show a clear dependency on the burnings gas flow as well as on the sample gas flow. The combination of small burning gas flows and small sample flow almost always results in small STO values below 2 %. However, with increasing sample gas flow the STO also increases to values above 2 %. Furthermore, a clear dependency of the STO on the burning gas flows can be observed. Although higher burning gas flows lead to lower STO values for higher sample gas flows, small burning gas flows result in a STO below 2 % for a much wider range of small sample gas flows.
Most likely, the origin of the dependency of the STO on the gas flows is due to the stoichiometric operation of the µFID. As mentioned before, the burning gases are produced by electrolysis; i.e., hydrogen and oxygen are provided in a ratio of 2:1. During the ionization process in the hydrogen flame a part of the oxygen is used for the ion formation (Holm, 1999). Therefore, as most of the oxygen is used by the hydrogen flame due to the stoichiometric operation, only very little of the oxygen is available for ionization. In conventional FIDs this issue is solved by operation with oxygen excess. Thus, despite the oxygen used by the hydrogen flame, there is always enough oxygen present for the ionization process. However, there is no oxygen excess in the µFID. Consequently, additional oxygen will lead to an enhanced ionization process in the µFID as more oxygen is available for the formation of ions. Furthermore, the impact of the additional oxygen is stronger at sample gas flows which correspond to lower sensitivity of the µFID as for these flows the additional oxygen not only directly enhances the formation of ions, but also indirectly increases the ionization due to an improved hydrogen flame.
Another important aspect in the context of emission monitoring is the sensitivity of the FID towards different hydrocarbons. In theory, the signal of an FID is directly proportional to the number of carbon atoms in the sample gas. Precisely, this means that one propane molecule (C3H8) results in a signal of the FID which is 3 times as high as the signal created by a methane molecule (CH4). However, differences between the atomic bindings of these molecules lead to different behavior of oxidation in the hydrogen flame of the FID. These differences result in deviations from the expected directly proportional signal (Scanion and Willis, 1985). This deviant behavior is described by the response factor f. The response factor fi of a hydrocarbon i states how much the signal of this hydrocarbon differs from its ideal direct proportional signal normalized to the signal of propane which is always used as the reference hydrocarbon. It is given by the formula
where Si is the signal of the FID for the hydrocarbon i, Ci is the carbon concentration of the hydrocarbon i, Sref is the signal of the FID for propane, and Cref is the carbon concentration of propane.
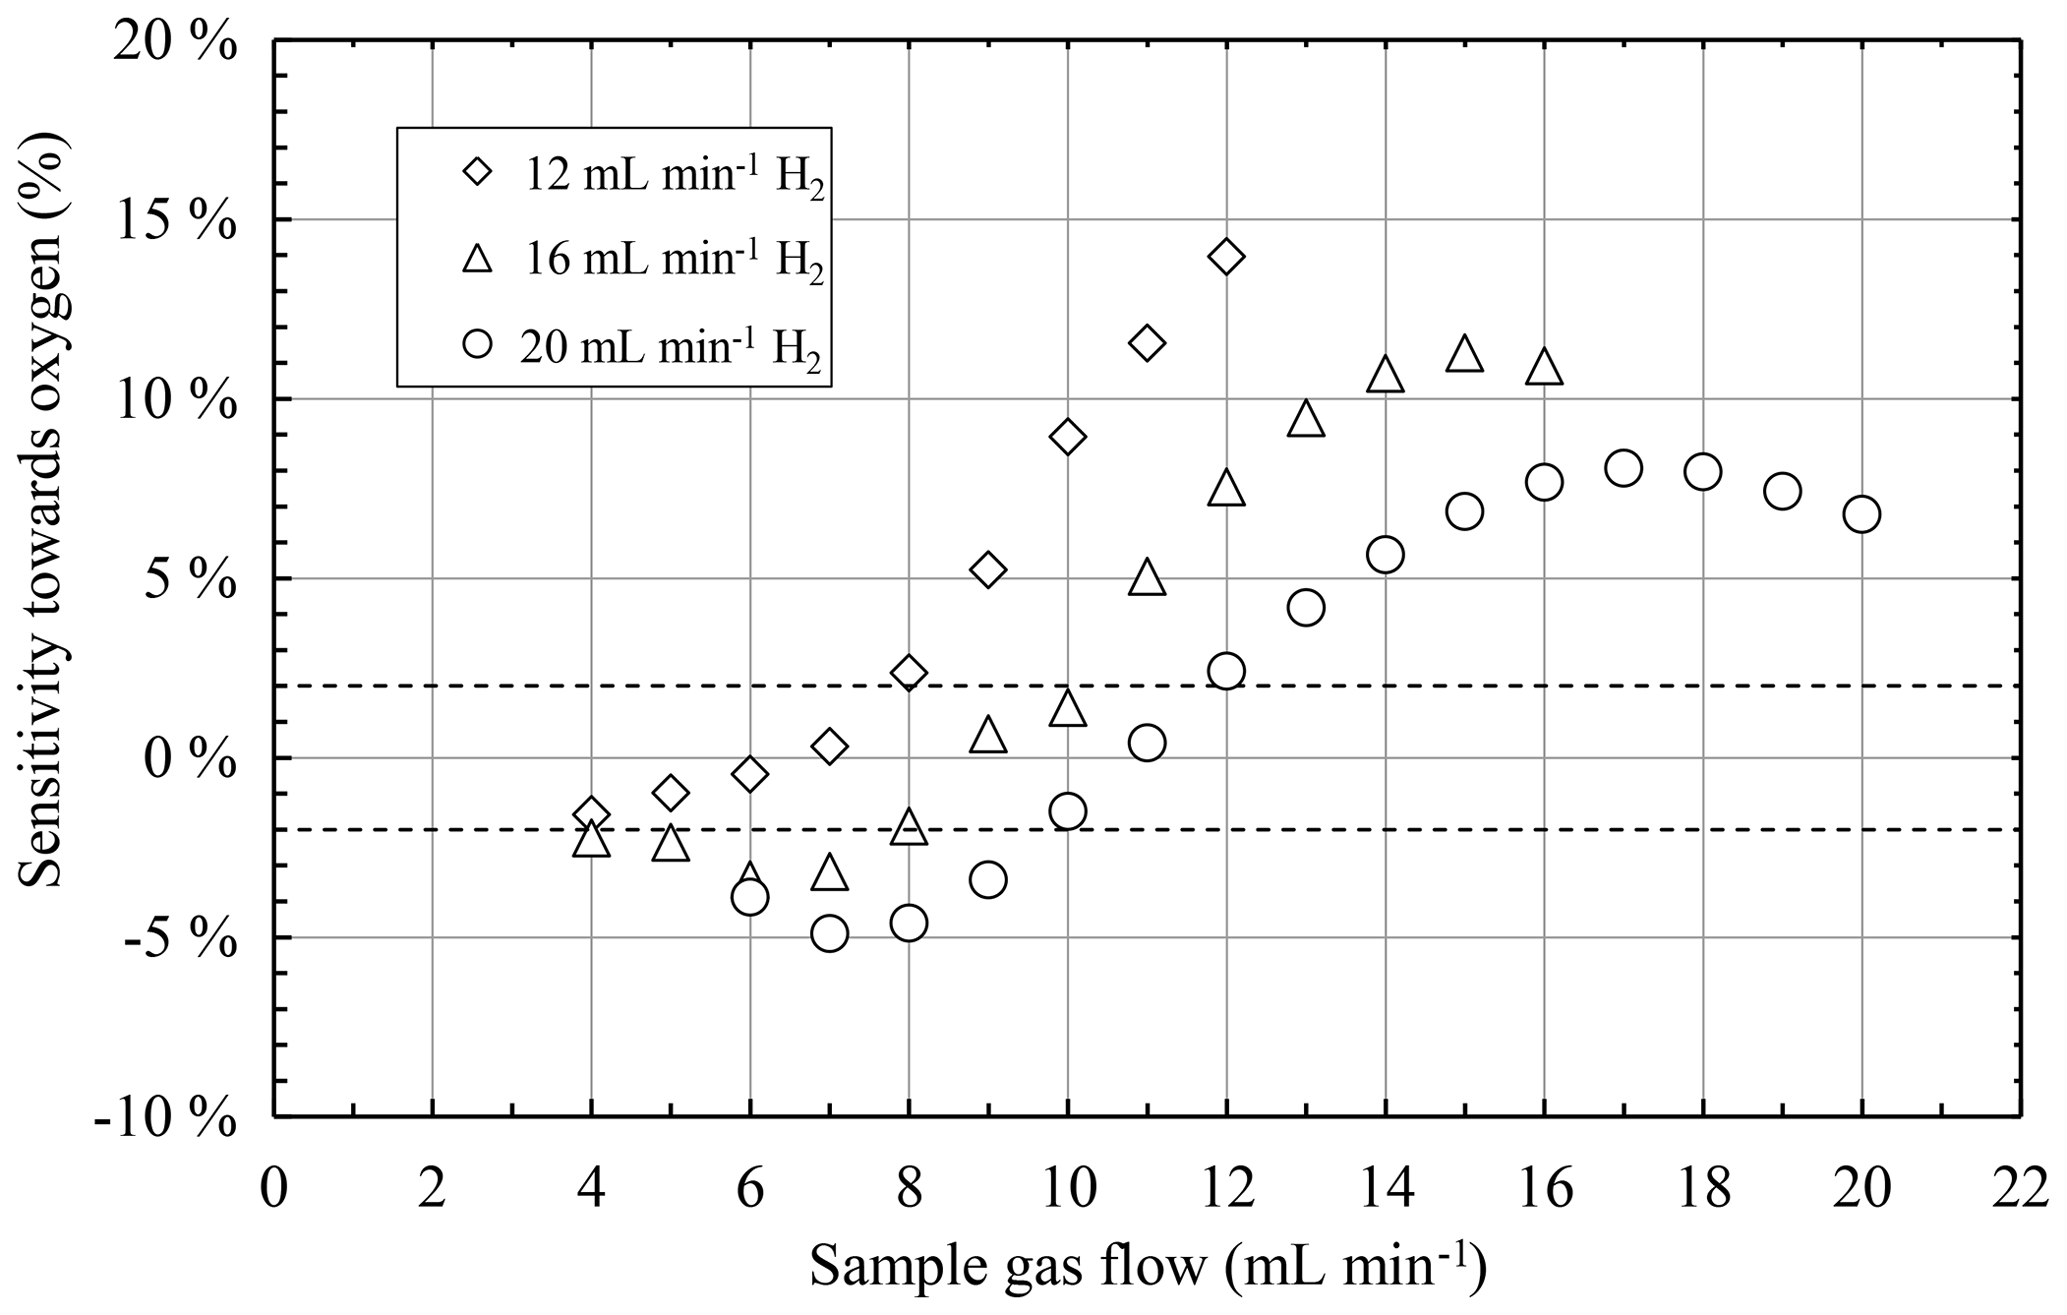
Figure 6Sensitivity towards oxygen as a function of the sample gas flow for different burning gas flows with illustration of the allowed range of the sensitivity towards oxygen for emission monitoring (dotted lines).
In order to determine some response factors of the developed FID, samples with known concentrations of single hydrocarbons were consecutively measured with the FID. A schematic drawing of this setup is given in Fig. 7. Afterwards, the results were normalized to the results achieved with propane. The compositions of the used sample gases are given in Table 1. It should be noted again that the concentrations of hydrocarbons in the sample gases are much higher than commonly used to determine response factors of FIDs and do not comply with the values recommended in corresponding norms (DIN EN 12619:2013-4; DIN EN 15267-3:2008-03) due to the project context in which the FID was first developed (Förster et al., 2017a). Therefore, the determined response factors give a valuable insight into the sensitivity of the FID towards different hydrocarbons, but do not state a compliance with actual regulations yet.
Table 1Sample gases used for determination of the response factors.

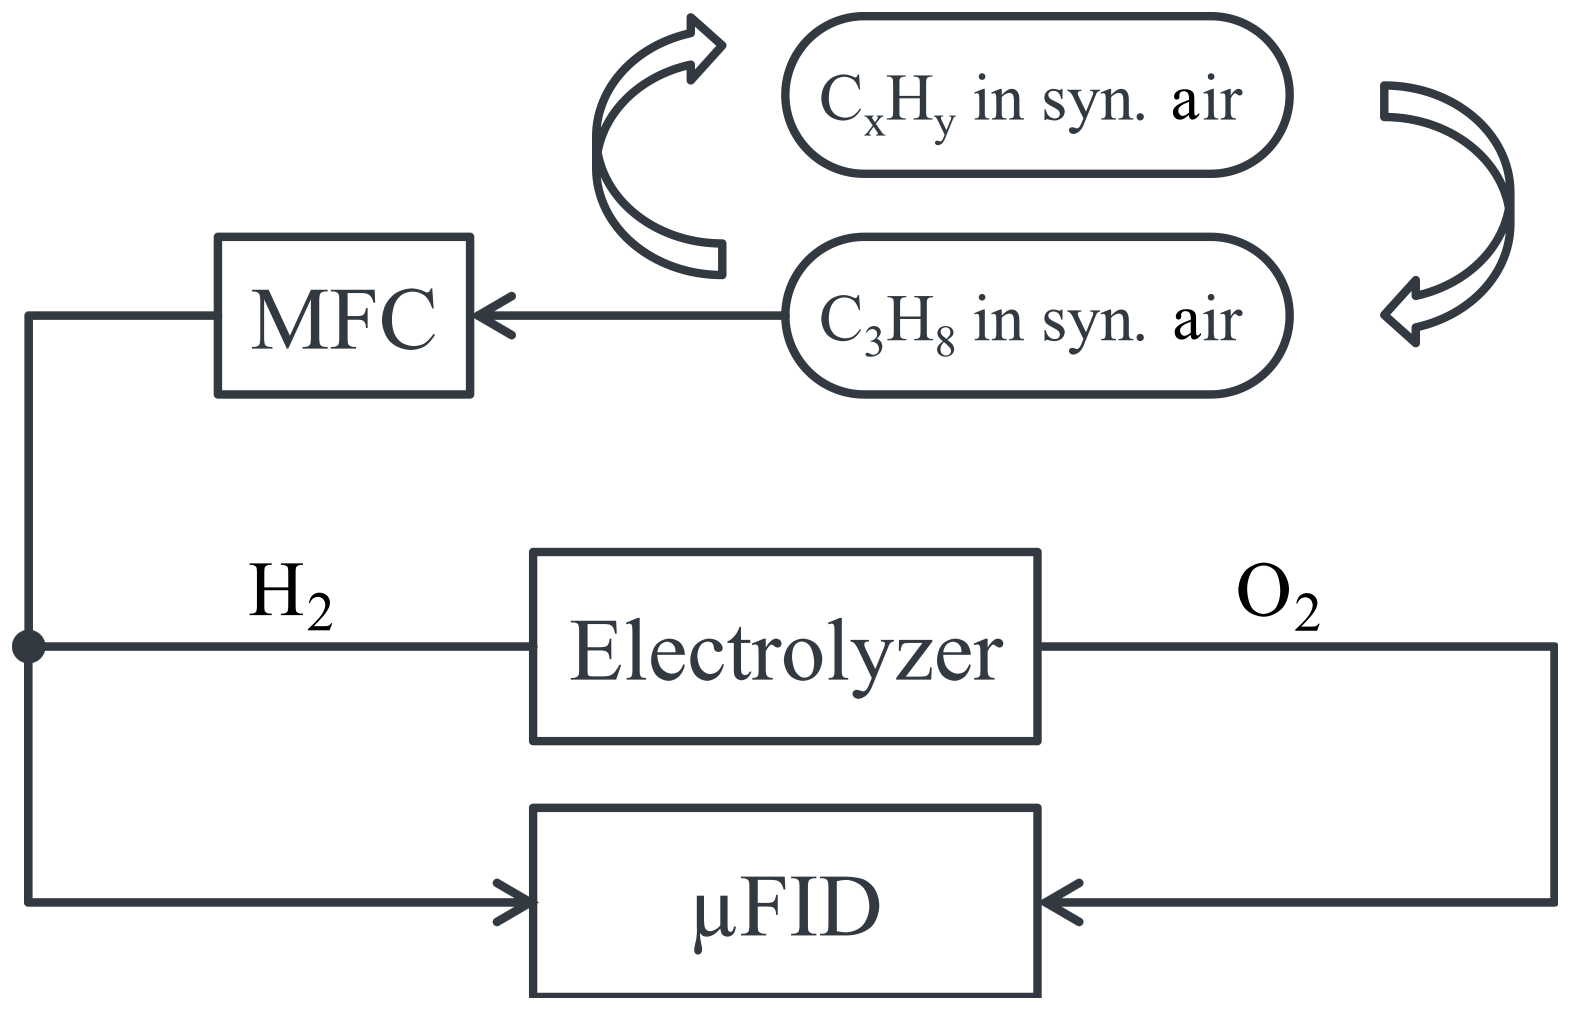
Figure 7Schematic drawing of the setup to determine the response factors of different hydrocarbons of the µFID.
As mentioned before, the sensitivity of the FID is a function of the flow of the burning gases as well as of the sample gas. Therefore, the burning gas flows were set to values of 20 mL min−1 H2 and 10 mL min−1 O2 and to 12 mL min−1 H2 and 6 mL min−1 O2, respectively. The sample gas flow was varied between 4 and 20 mL min−1.
Figure 8 shows the results of the measurements for burning gas flows of 12 mL min−1 H2 and 6 mL min−1 O2. Ethylene, n-nutane, and i-butane have an almost constant response factor for all sample flows. Furthermore, their response factors are very close to the ideal value of 1.0. In contrast to these hydrocarbons, the response factors of acetylene and methane have a clear dependency on the sample gas flow. The response factor of acetylene changes from approximately 0.6 for small sample gas flows up to ca. 1.3 for higher sample gas flows. Even more, the response factor of methane varies between approximately 1.6 and 1.4 for different sample gas flows.
The results of the measurements for burning gas flows of 20 mL min−1 H2 and 10 mL min−1 O2 are shown in Fig. 9. The response factors for these burning gases have a very similar behavior to the response factors of the aforementioned burning gas flows. The response factors of ethylene, n-butane, and i-butane are very close to 1.0 again and have almost no dependency on the sample gas flow. However, the divergence of the response factors of acetylene and methane from the ideal behavior are less strong for these higher burning gas flows than for smaller burning gas flows. The response factor of acetylene starts with a value of approximately 0.7 for small sample gas flows and increases to ca. 1.1 for higher sample gas flows. Furthermore, the response factor of methane is approximately 1.3 for sample gas flows up to 14 mL min−1 and even converges to 1.0 for higher sample gas flows.
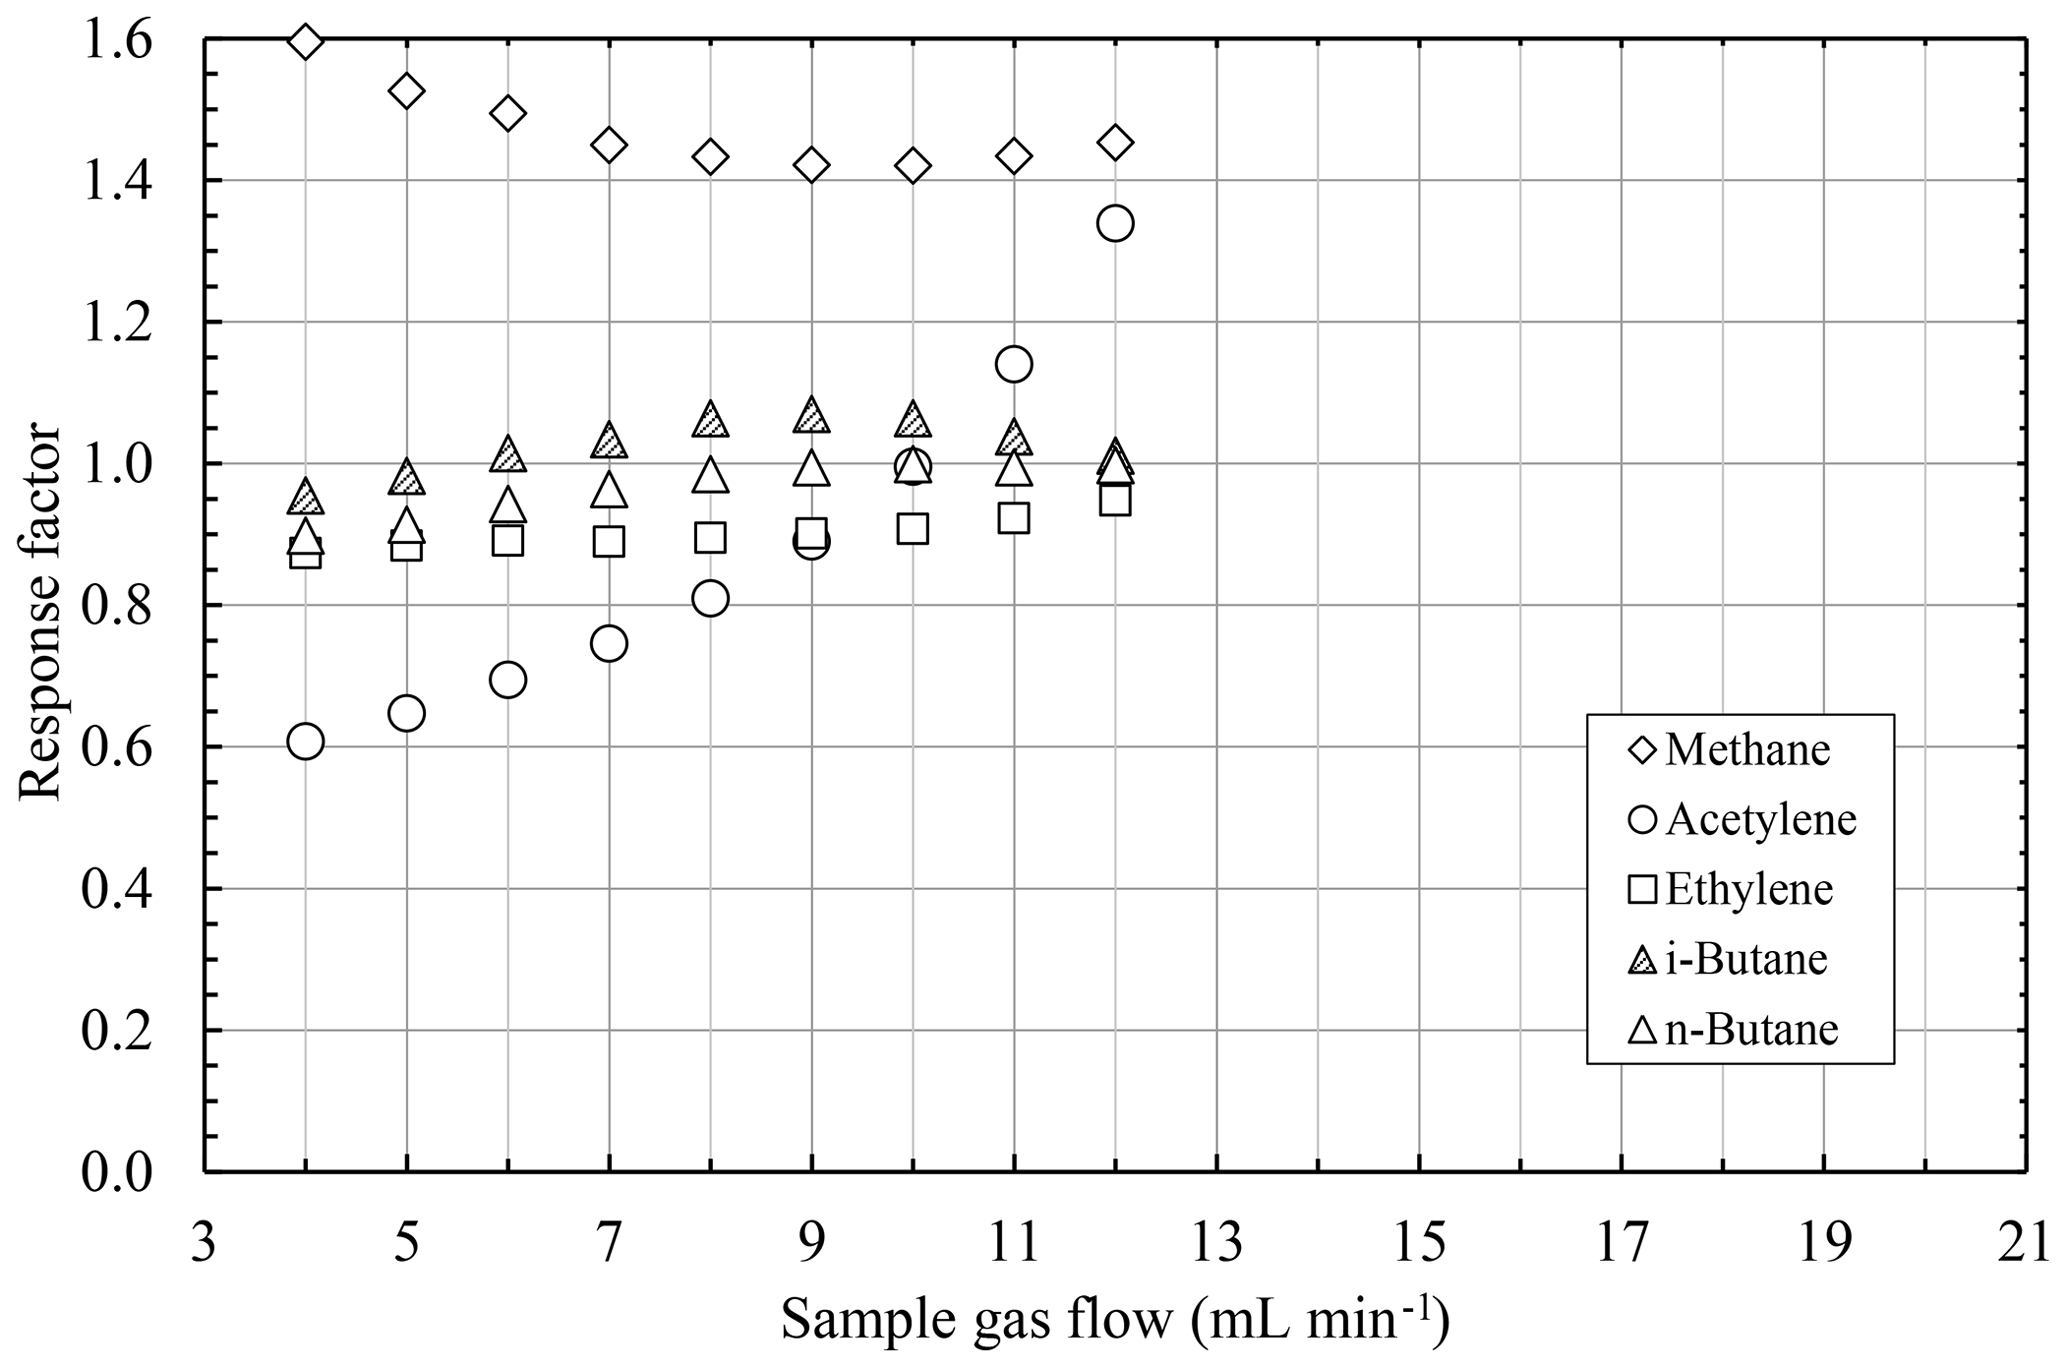
Figure 8Response factors of different hydrocarbons as a function of the sample gas flow at a constant burning gas flow of 12 mL min−1 H2 and 6 mL min−1 O2.
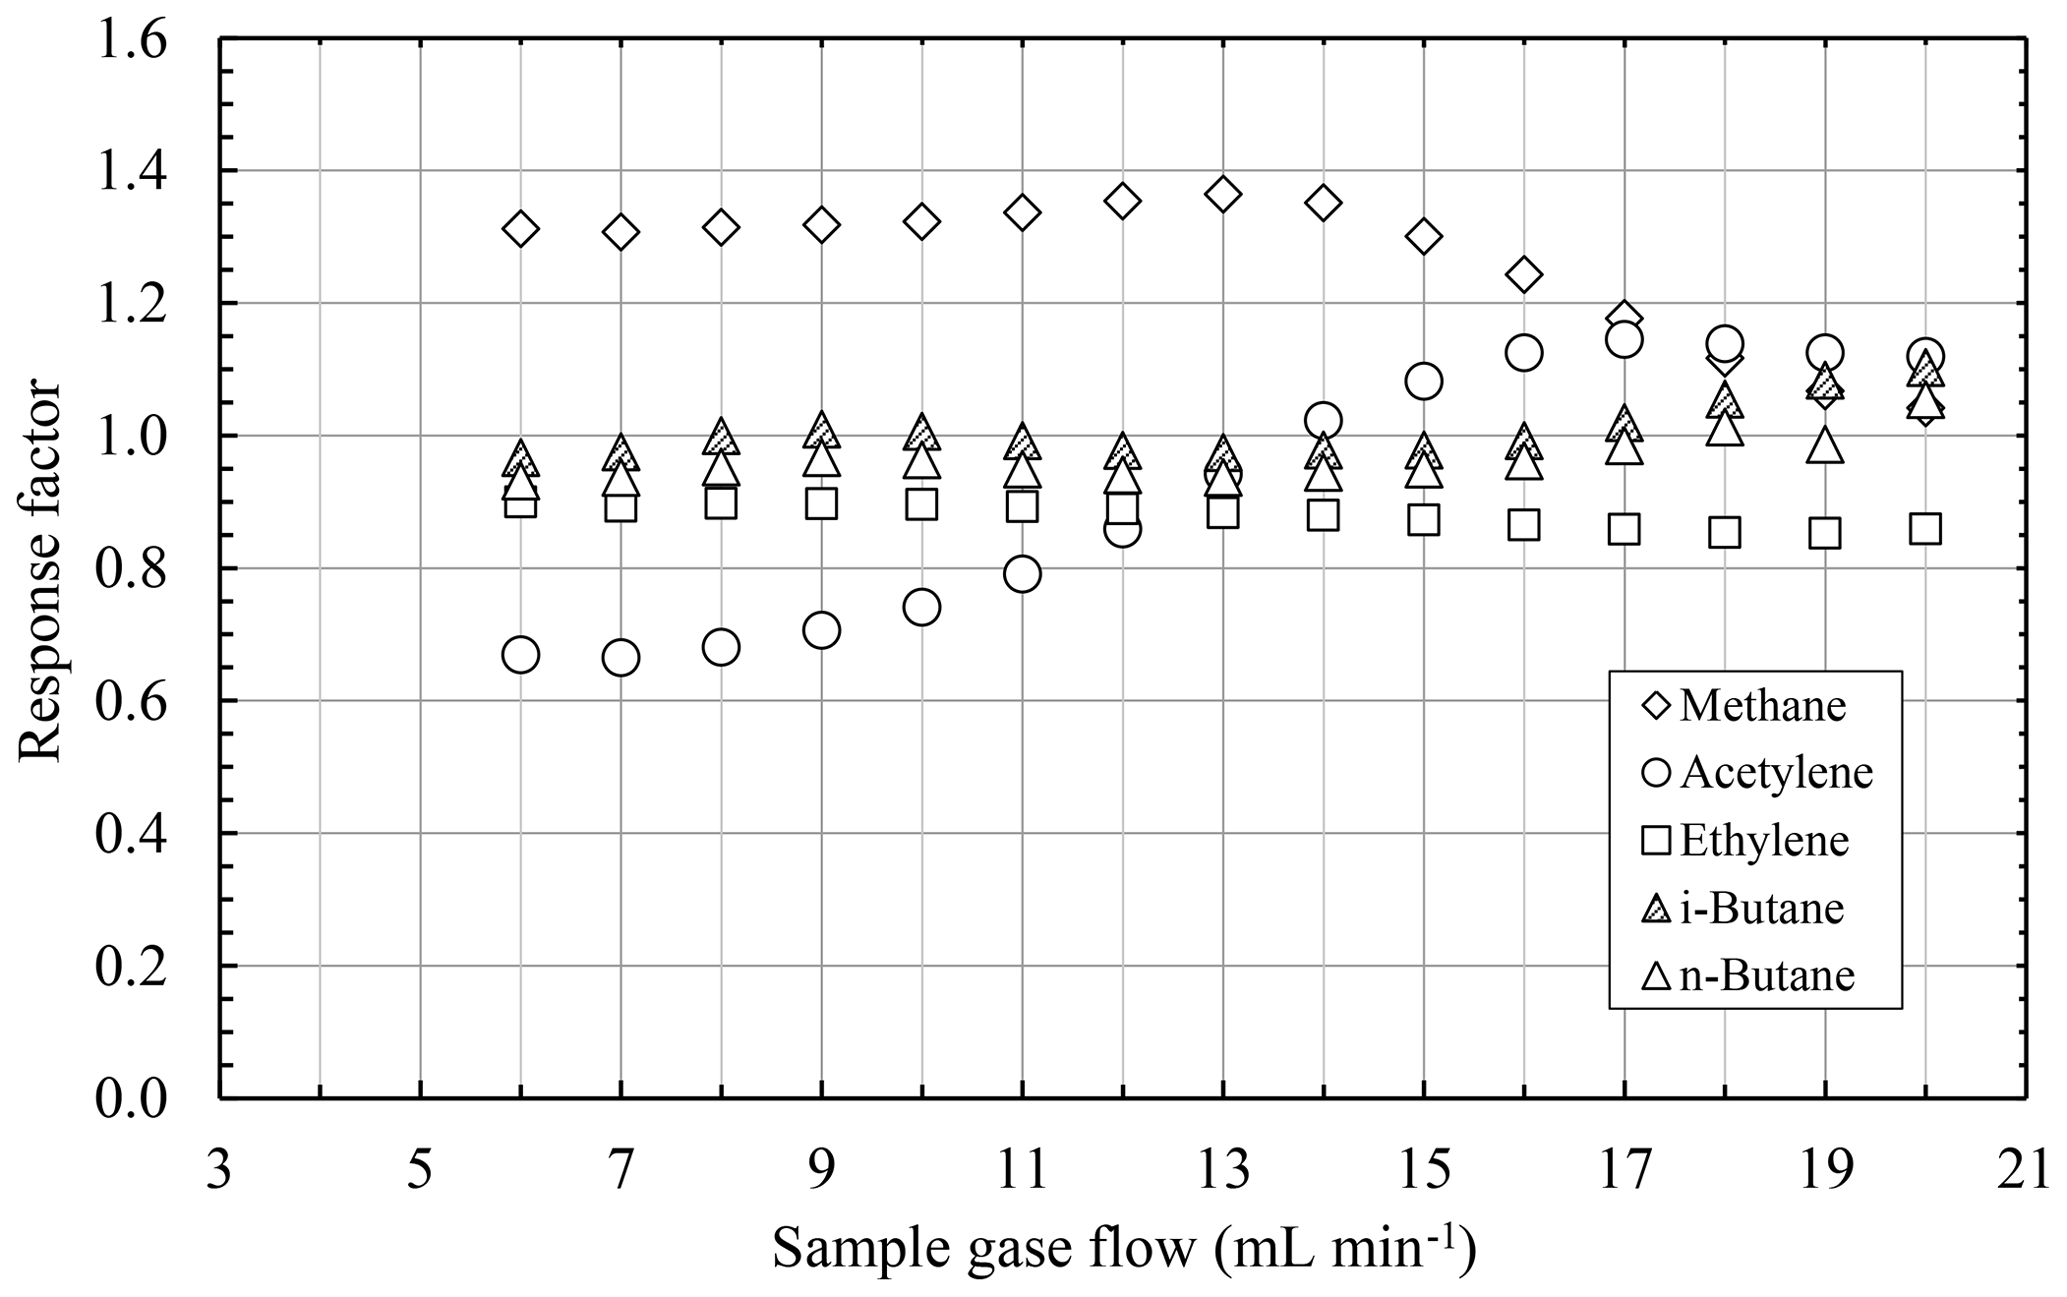
Figure 9Response factors of different hydrocarbons as a function of the sample gas flow at a constant burning gas flow of 20 mL min−1 H2 and 10 mL min−1 O2.
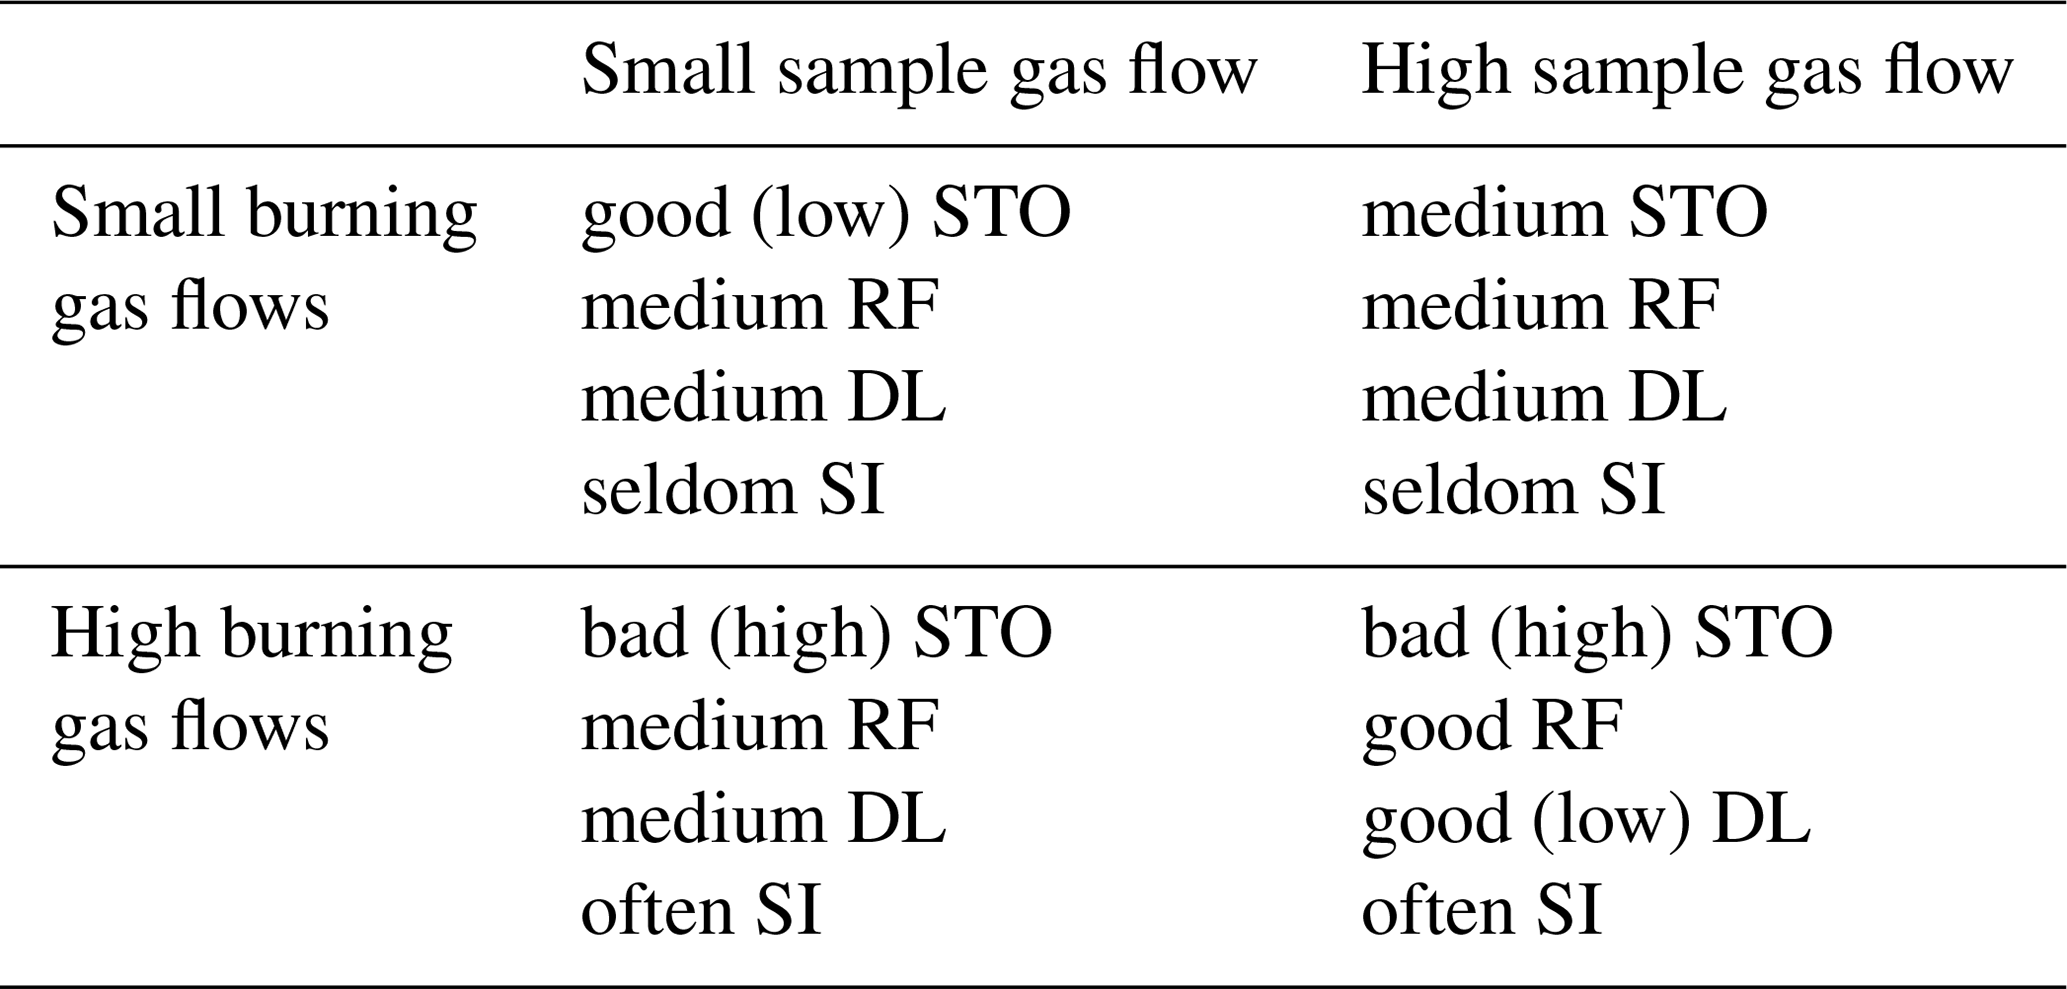
Table 2Dependencies of sensitivity towards oxygen (STO), response factors (RFs), detection limit (DL), and frequency of service intervals (SIs) of the FID on the chosen burning gas flows and sample gas flow.
According to the model of ion formation in an FID as described in the literature, the hydrocarbons are first decomposed to methane and then ionized (Sternberg et al., 1962; Holm, 1999). Thus, the response factor of methane is expected to be slightly higher than 1.0 as the step of decomposition is unnecessary. However, the values reported here differ more than the expectations due to the unnecessary decomposition and are most likely due to the stoichiometric operation of the µFID and its sensitivity towards oxygen. As the STO with methane as sample gas differs from the STO with propane as sample gas, the noticeable STO of the µFID will consequently lead to a huge difference in the response factor for methane (IEC 60079-29-2:2015, 2019).
In the case of acetylene the difference in the response factor is most likely due to its unique behavior of the relative thermodynamic stability compared to other hydrocarbons (Holm, 1999). While the relative thermodynamic stability of hydrocarbons increases with rising temperature, the relative thermodynamic stability of acetylene decreases with rising temperature. In the µFID, different sample gas flows lead to varying flame efficiencies and therefore to different flame temperatures. Thus, due to the differences in their relative thermodynamic stabilities acetylene and propane will then be ionized with different efficiencies for these sample gas flows. As a consequence, the response factor of acetylene shows a strong dependency on the sample gas flow compared to the other hydrocarbons.
To allow a significant interpretation of these results, the findings of the earlier characterization (Förster et al., 2017a, b) must be taken into account too. The earlier characterizations revealed that the sensitivity of the FID is a function of the burning gas flows as well as a function of the sample gas flow. Thus, it is obvious that all significant characteristics of the FID in the context of emission control have a dependency on the sample gas flow and on the burning gas flows. Furthermore, some of these dependencies are opposing each other; i.e., while some of the characteristics of the FID improve with rising sample gas or burning gas flows, other characteristics get worse. These dependencies of the characteristics are concluded in Table 2. The table shows that there will always be a tradeoff between the characteristics for any combination of sample gas flows and burning gas flows. Therefore, the combination of gas flows must always be chosen in such a way that it is the best match for the application.
This can be best explained by the example of the FIDEX project (Förster et al., 2017a). This project dealt with monitoring the sewerage systems for formation of an explosive atmosphere. An early detection of the formation of explosive atmospheres is of high priority. This can be achieved by a medium to low detection limit. Furthermore, due to many installation locations in the sewerage, which are difficult to access, long time durations between service intervals are mandatory. Therefore, the burning gas flows should be kept as low as possible to consume burning gas. However, there will be none or only a little bit of varying oxygen content in the air of the sewerage systems. Thus, the STO is of lower priority. In addition, the formation of explosive atmospheres in the sewerage is most often due to methane accumulation only and not due to hydrocarbon mixtures. Thus, the response factors are of lower priority in this context. Therefore, to meet these requirements as best as possible, a combination of low burning gas flows and high sample gas flow should be chosen.
The miniaturization of an FID was successfully achieved using ceramic multilayer technology LTCC. The performance of the resulting µFID chip at common gas flow rates is comparable to conventional FIDs. In addition, the µFID allows operation at reduced gas consumption. Thus, this µFID does pave the way for the introduction of an FID as a field device for the first time. Depending on the choice of burnings gas flows and sample gas flow, a low detection limit, good response factors close to 1.0 or a small sensitivity towards oxygen can be achieved. This allows for adaption of the µFID to the requirements of diverse applications.
The data that support the findings of this study are available from the authors, but restrictions apply to the availability of these data, which were used under license for the current study and are thus not publicly available. Data are, however, available from the authors upon reasonable request.
The design of the ceramic µFID was a result of discussions between JF, WK, CL, and SZ. The manufacturing of the ceramic µFIDs was done by CL, SZ, and FB. As the main author, JF prepared the measurement setup and performed the measurements. Data analysis and derivation of conclusions were done by JF and WK.
The authors declare that they have no conflict of interest.
This article is part of the special issue “Sensors and Measurement Systems 2018”. It is a result of the “Sensoren und Messsysteme 2018, 19. ITG-/GMA-Fachtagung”, Nürnberg, Germany, from 26 June 2018 to 27 June 2018.
This work was part of project “FIDEX – Autonomer
Mikroflammenionisationsdetektor für den Explosionsschutz in zivilen
Kanalisationsnetzen” and was financially supported by the German
Bundesministerium für Bildung und Forschung – BMBF (no. 13N13271).
Edited by: Peter A. Lieberzeit
Reviewed by: two anonymous referees
DIN EN 12619:2013-4: Emissionen aus stationären Quellen – Bestimmung der Massenkonzentration des gesamten gasförmigen organisch gebundenen Kohlenstoffs – Kontinuierliches Verfahren mit dem Flammenionisationsdetektor, available at: https://www.beuth.de/de/norm/din-en-12619/154950673, last access: 18 January 2019.
DIN EN 15267-3:2008-03: Luftbeschaffenheit – Zertifizierung von automatischen Messeinrichtungen – Teil 3: Mindestanforderungen und Prüfprozeduren für automatische Messeinrichtungen zur Überwachung von Emissionen aus stationären Quellen, available at: https://www.beuth.de/de/norm/din-en-15267-3/100747778, last access: 18 January 2019.
Förster, J., Kuipers, W., Koch, C., Lenz, C., Ziesche, S., and Jurkow, D.: Miniaturised Flame Ionisation Detector for Explosion Protection in Civil Sewerage Networks, Sensor Systems and Software, S-CUBE, Springer, https://doi.org/10.1007/978-3-319-61563-9_14, 2017a.
Förster, J., Kuipers, W., Koch, C., Lenz, C., Ziesche, S., and Jurkow, D.: A Miniaturised Flame Ionisation Detector Applicable in a Field Device, Proceedings Micro Fluidic Handling Systems, EEMCS of the University of Twente, 27–30, 2017b.
Hill, H. H. and McMinn, D. G.: Detectors for Capillary Chromatography, Chemical Analysis, 153, 7–22, 1992.
Holm, T.: Aspects of the mechanism of the flame ionization detector, J. Chromatogr. A, 842, 221–227, 1999.
IEC 60079-29-2:2015: Gas detectors – Selection, installation, use and maintenance of detectors for flammable gases and oxygen, available at: https://webstore.iec.ch/publication/21961, last access: 18 January 2019.
Kuipers, W. J.: Design, Fabrication and Characterization of a MEMS-Based Counter-Current Flame Ionization Detector, Doktor Hut Verlag, Munich, 2011.
Kuipers, W. J. and Müller, J.: Characterization of a microelectromechanical systems-based counter-current flame ionization detector, J. Chromatogr. A, 1218, 1891–1898, 2011.
Lenz, C., Neubert, H., Ziesche, S., Förster, J., Koch, C., Kuipers, W., and Deilmann, D.: Development and Characterization of a Miniaturized Flame Ionization Detector in Ceramic Multilayer Technology for Field Applications, Procedia Engineer., 168, 1378–1381, 2016.
Scanion, J. T. and Willis, D. E.: Calculation of Flame Ionization Detector Relative Response Factors Using the Effective Carbon Number Concept, J. Chromatogr. Sci., 23, 333–340, 1985.
Sternberg, J. C., Gallaway, W. S., and Jones, D. T. L.: The mechanism of response of flame ionization detectors, Gas chromatography, Academic press, New York, 231–268, 1962.