the Creative Commons Attribution 4.0 License.
the Creative Commons Attribution 4.0 License.
 | 05 Nov 2019
Measure particulate matter by yourself: data-quality monitoring in a citizen science project
Aboubakr Benabbas
Martin Geißelbrecht
Gabriel Martin Nikol
Lukas Mahr
Daniel Nähr
Simon Steuer
Gabriele Wiesemann
Thomas Müller
Daniela Nicklas
Thomas Wieland
The concern about air quality in urban areas and the impact of particulate matter (PM) on public health is turning into a big debate. A good solution to sensitize people to this issue is to involve them in the process of air quality monitoring. This paper presents contributions in the field of PM measurements using low-cost sensors. We show how a low-cost PM sensor can be extended to transfer data not only over Wi-Fi but also over the LoRa protocol. Then, we identify some of the correlations existing in the data through data analysis. Afterwards, we show how semantic technologies can help model and control sensor data quality in an increasing PM sensor network. We finally wrap up with a conclusion and plans for future work.
- Article
(2393 KB) - Full-text XML
- BibTeX
- EndNote


Compared to the 1980s, air quality in Germany has visibly improved (Heinrich et al., 2002), but air pollution is still a major health risk for the population. According to the World Health Organization, outdoor air pollution causes 3.8 million deaths in 2016, and around 90 % of the world's population lives in places where the pollution exceeds WHO guideline limits (WHO, 2018). One component of air pollution is particulate matter (PM). PM is a mixture of small solid particles and liquid droplets which can be a result of chemical reactions between pollutants, emitted from power plants, industries, and automobiles (Boubel et al., 2013). PM can also come from natural sources like natural fires, deserts, and open fields and can be generated by tires and brakes (Garg et al., 2000).
Air pollution and PM concentration can vary significantly between different places, depending on the location and strength of emitters like traffic density. Hence, there is a need for good spatial coverage to assess PM levels and to plan and monitor particulate-matter-reducing initiatives (e.g., installation of filters or driving bans for certain types of vehicles, as currently discussed in Germany). However, only few official PM monitoring stations exist, and many cities have only one. While official monitoring stations provide high-quality measuring results (quality aspect: accuracy), the spatial coverage (quality aspect: completeness) is poor. In addition, the PM measurements are only available as average values over a 24 h span. This causes a high delay (quality aspect: latency). Due to limited coverage of official monitoring stations, the citizen science project luftdaten.info put together an assembly kit for low-cost sensors for people to increase the spatial coverage of air pollution measurements and also to reduce the latency. Obviously, these sensors provide less accuracy than high-end official monitoring stations. Since a complete calibration of the low-cost sensors cannot be completed, a lot of work needs to be done in order to use these data collections and to assess their quality.
Particulate matter is often (but not exclusively) generated by combustion processes, mainly in industrial production and from road traffic vehicles. These vehicles cause additional PM by tire abrasion. The PM concentration can be structured in a permanent background concentration and a mutable concentration that is caused by local and/or temporary incidents (Kallweit and Wintermeyer, 2013).
This paper is an extended version of the conference paper (Steuer et al., 2018). It gives a more detailed view on the data-quality observations of the low-cost sensors, and it gives more information about the accuracy of their PM measurements.
The rest of this paper is structured as follows: in Sect. 2, we discuss the related work in the area of PM measurement and data-quality dimensions and processing. Section 3 gives a presentation of the sensors utilized for the project and the extensions made to make the sensors mobile and enable the data collection and processing. Section 4 describes results from the analysis of the sensor data and the correlation analysis between the relative humidity and PM measurements. Section 5 introduces our approach for monitoring the data quality of the sensors by using semantic tools to pair the sensors with air quality monitoring stations to check the sensor values. Section 6 concludes our paper and gives future work plans for follow-up projects.
In this section, we take a look at the achieved work in the area of PM measurements and data quality in data streams.
2.1 Air quality and particulate-matter sensing
In order to assess the air quality, limits, and acceptable values for particulate matter must be set by regulatory authorities. The EU Air Quality Directive introduces the pollution limits and the air quality objectives to set the compliance targets and guidelines1.
Methods to measure concentration of particulate matter are numerous. Some methods rely on gravimetric analysis, where filters are weighed before and after sampling periods (Nussbaumer et al., 2008; Giechaskiel et al., 2014). Optical methods are also used, which perform light scattering (Vincent, 2007), light absorption (Giechaskiel et al., 2014), or light extinction (Mellon et al., 2011). Methods to measure the particle's size include microscopy and impactors (Vincent, 2007).
There are various works that estimate the density of particulate matter. They use different methods and tools. We present here a list of some of the contributions in this research area. van Donkelaar et al. (2015) use a method based on satellite-derived estimates of PM2.5 values to measure the exposure of the human population to particulate matter. Wang et al. (2010) propose a method based on the correlation between aerosol optical thickness (AOT) and the surface-level PM concentrations to estimate the regional PM values. These techniques are mainly used on a global scale and do not focus on the real-time estimation of particulate-matter density in urban areas. To achieve this goal, a lot of projects implemented a combination of reference air quality stations with low-cost sensors to increase the spatio-temporal coverage of air quality monitoring. In the research project SmartAQnet2, an Internet-of-things platform is developed to enable everyone to provide measured environmental data. This platform integrates various data sets (weather, traffic, etc.) and data from stationary and mobile measuring devices (Budde et al., 2017a). The quality of the mobile generated data is investigated in connection with the usability of the cost-effective sensors (Budde et al., 2017b). This makes it possible to better interpret the significance of data from citizen science projects.
Other projects in the field of community sensing are OpenSense and its successor OpenSense2 (Calbimonte et al., 2017). The project is a joint project from the universities ETH Zurich and EPFL and the company nano-tera. It is a public-transport project with the goal of establishing an urban sensor network to measure the air pollution. AERO-TRAM is a project from the Karlsruhe Institute of Technology (KIT) in Germany (Hagemann et al., 2014) with a focus on the construction of an air quality sensor mounted on top of a tram.
Penza et al. (2014) used calibrated low-cost sensors to monitor the air quality with a combination of electrochemical gas sensors, optical particulate-matter detectors, temperature, and relative humidity. Experiments were carried out for a period of 5 months, where low-cost sensors were compared to reference analyzers and air quality monitoring stations. However, the results do not indicate how the sensors can perform in real life scenarios. In order to support existing air quality monitoring networks and to give the public better information about detailed source attribution of air quality, Heimann et al. (2015) used a highly dense network of low-cost sensors to provide the required temporal resolution of the measurements. While this work emphasized the benefit of using low-cost sensors to provide a higher spatio-temporal coverage of air quality, it did not specify how these sensors perform in comparison to reference analyzers and air quality stations. With the increasing proliferation of low-cost sensors, Jovaševic-Stojanovic et al. (2015) examined some of the existing low-cost sensors on the market and came up with a set of requirements for calibration and quality control of these sensors. Castell et al. (2017) investigated the quality and usefulness of 24 identical units of a commercial low-cost sensor platform against CEN (European Standardization Organization) reference analyzers, evaluating their measurement capability under different environmental conditions and over a period of time. While these sensors are not meant for regulatory or health purposes, they can offer an aggregated view about the air quality and increase the spatio-temporal coverage.
2.2 Data quality in data streams
Data can be evaluated based on different criteria. These criteria indicate how these data can be interpreted and whether they can be used for certain applications or not. Data can be described using different dimensions and value ranges. Batini and Scannapieco (2006) offer an interesting view on the data-quality dimensions and their respective definitions in Batini and Scannapieco (2006). The definition of Batini covers the most important dimensions of data quality that sensor data need to have, like accuracy, completeness, and timeliness.
Work in the area of data quality and data anomaly using ontology-based solutions employs ontologies to describe the quality metrics. Geisler et al. (2016) propose a data-quality ontology-based framework for data stream applications, where they define quality metrics for content, queries, and applications that use the data. The framework uses an ontology to define all the metadata for the data-quality metrics. The framework offers the option of describing the sensors and their quality metrics through semantic rules; however, all the metadata about the sensor need to be provided in advance. Kuka and Nicklas (2014) provide a solution for general quality-aware sensor data processing that uses probabilistic processing to provide continuous data-quality values for the incoming data. In Kuka (2014), the process was enhanced by adding a description of the context by using the SSN (Semantic Sensor Network) ontology (Compton et al., 2012) to describe contextual information about the sensors used.
In this section, we take a look at the project luftdaten.info and their provided PM sensor kits for citizens to make particulate-matter measurements on their own. In a student project, we demonstrate how to extend these sensors to use them in motion as well.
3.1 Stationary sensors
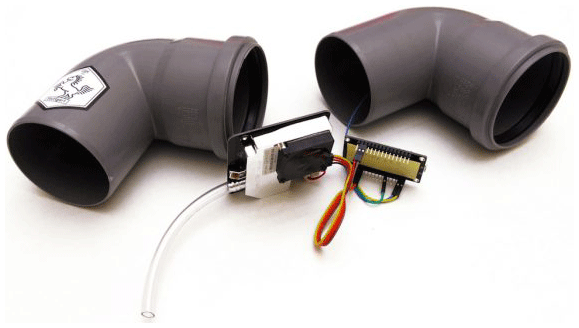
The OK Lab in Stuttgart offers technical support for the project luftdaten.info3 in the development areas of transparency, open data, and citizen science. This project aims at raising the population's awareness to the risks of particulate matter. The project enables citizens to assemble their own PM sensors using simple instructions. These sensors provide an additional source of information about the air quality to people besides air quality monitoring stations. The luftdaten.info project has a visualization component, which displays all the sensors on a map with their PM measurements. The data produced by the sensors are open to everyone and can be used for analysis and air quality monitoring. Bamberg, a small city with a population of 80 000 that is a UNESCO World Heritage Site, already has some of those sensors, while there are over 5000 units deployed all over Germany. This sensor network is expected to grow further to reach other parts of the country and cities with thin coverage or no coverage at all. The project “Frankenstaub” of the Bluepingu4 registered association works on spreading the self-made sensors over the inhabitants of Nuremberg so that people measure the fine-dust load from home. The assembly instructions of the sensors are simple, and the acquisition cost of the components is fairly low (around EUR 30). The components include the Nova SDS011 sensor as a particulate-matter sensor that works with the principle of laser scattering, a temperature sensor, a relative-humidity sensor, and a microcontroller with a Wi-Fi chirp. The parts can be assembled together with a few cables (see Fig. 1). Further, it is recommended to use a weatherproof shell for protection. Finally the firmware is available on the Internet, and the sensors can be easily registered on the OK Lab platform5. The sensor can send the measurements if connected to the Internet. The sensors ought to be installed on the outside of buildings at least 2 m above the ground.
3.2 Mobile sensors
In the Innovation Lab “Living Lab Bamberg”6 of the University of Bamberg and the Coburg University of Applied Science, student projects are taking place. In some of these student projects, the PM sensors of the project luftdaten.info are used as starting points for further research. The biggest shortcomings of the kits are the lack of mobility through limited Wi-Fi accessibility and the need for a power outlet in areas where data needs to be measured.
In a proof-of-concept approach, we wanted to develop a mobile particulate-matter-measuring device based on the SDS011 sensors that makes it possible to transmit data over long distances. This is done with a LPWAN (low-power wide-area network) extension instead of Wi-Fi. LPWAN makes it possible to transmit small data units over long distances with a low energy consumption (Penkov et al., 2017; Petäjäjärvi et al., 2017). We focus on LoRa (long range)7 as a LPWAN technology. This is called LoRaWAN in the following.
One goal is to simplify the collection of sensor data even in previously inaccessible areas. With the help of these hardware extensions and the new network protocols, the data-quality dimension of completeness could be improved by better spatial coverage and quick data updates.
For different application scenarios, we considered the two development variants, MoRa and CoRa. MoRa is the abbreviation of the mobile LoRaWAN air sensor, and CoRa is the abbreviation of constrained LoRaWAN air sensor. With MoRa, we are targeting a mobile handheld device which can record and send measurements in any location at the push of a button. CoRa is a stationary variant (fixed installation) which is intended for long-term operation and is therefore intended to record long-term measurements for extended evaluation. Both have mostly identical components. However, the application purpose determines which of the two variants can be considered. Communication takes place via a centralized administration unit (e.g., via a gateway).
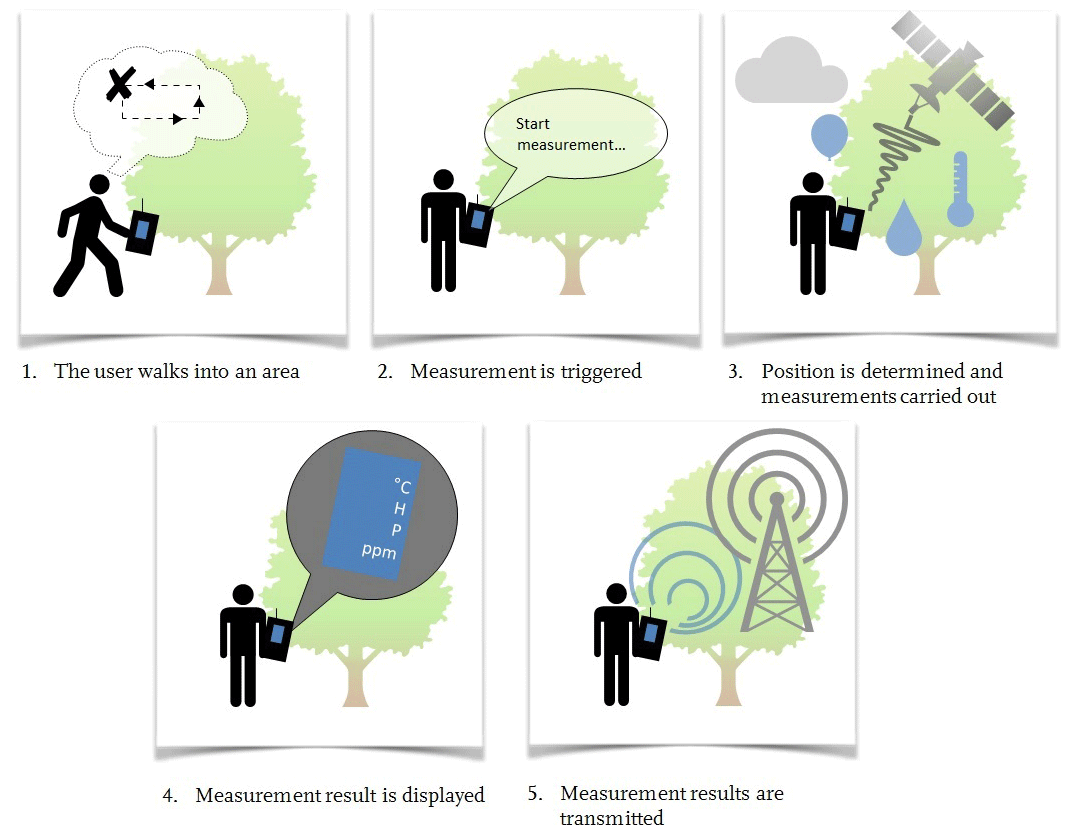
MoRa incorporates all sensors (temperature and humidity sensors, PM sensor, GPS, and LoRaWAN radio modules). The measurements can only be started manually via a TFT touchscreen (see Fig. 2). Users receive instant feedback on the particulate-matter concentration on site. The measurements are transmitted via the LoRaWAN network (Wixted et al., 2016). Manual measurements are possible at all accessible locations. MoRa can be operated with a rechargeable battery (e.g., lithium-ion rechargeable batteries, type 18650). As MoRa only carries out manual measurements, the energy requirement is considerably low. This compensates the high energy consumption of the display.
CoRa has either a non-permanent power source (battery) or – like in this scenario – is equipped with solar cells to harvest energy and extend the device operating lifetime. Although CoRa has been optimized for stationary use (see Fig. 3), the sensor is not necessarily tied to a fixed installation location. It is equipped with the same sensors as MoRa but without the energy-intensive display. The main requirements here are extended operation time and weather resistance. In principle, CoRa is an autonomous unit which can be set up fast and works autonomously to measure air quality in fixed time intervals.

3.3 Sensing architecture
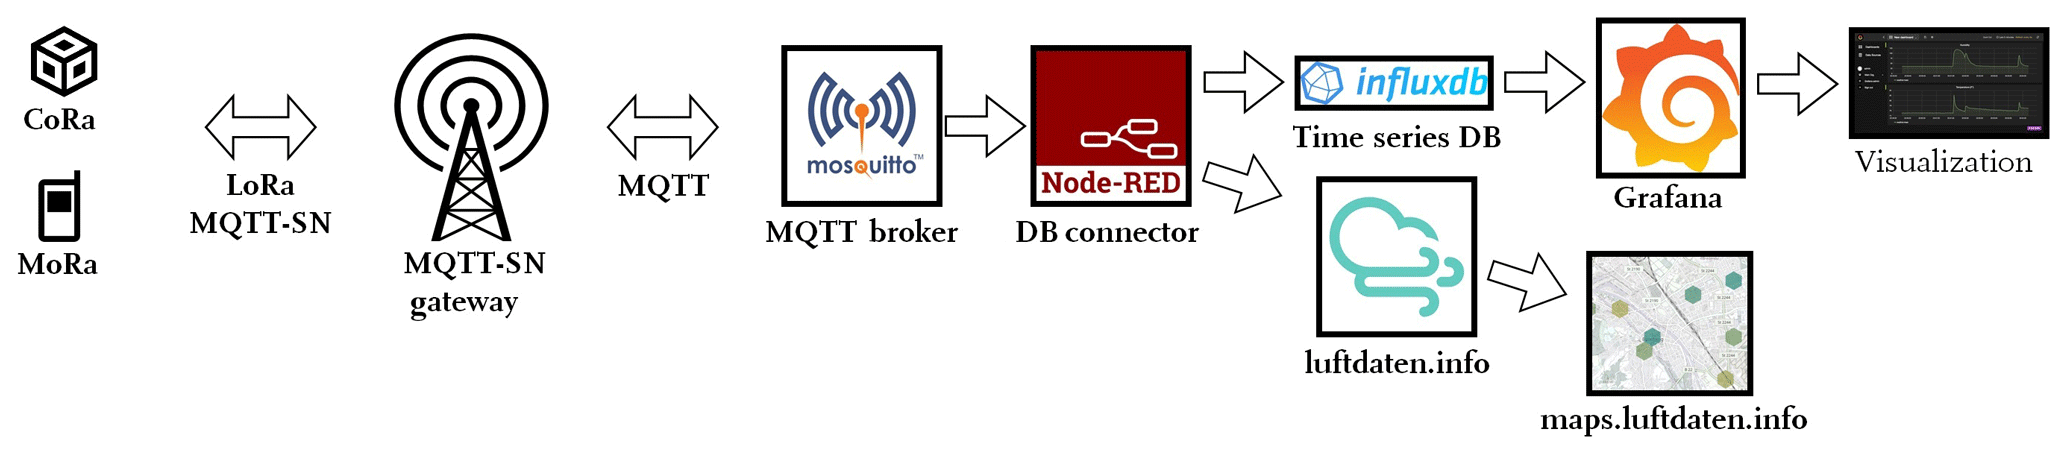
Figure 4 gives an overview of the system architecture. The sensor nodes CoRa and MoRa communicate via LoRaWAN and MQTT-SN (Message Queuing Telemetry Transport for Sensor Networks) with an MQTT-SN gateway.
The MQTT-SN is a standard of the International Business Machines Corporation (IBM). It was designed for cost-effective wireless sensor networks (WSNs; Truong and Stanford-Clark, 2013). MQTT-SN is a version of the MQTT standard. MQTT-SN supports connectionless protocols and does not explicitly require TCP/IP. The protocol is optimized for networks with low minimal transmission units (MTUs). This allows us to use MQTT-SN on non-IP-based networks.
LoRaWAN is a new technology in the field of low-power and long-range communication that was developed to meet the growing challenges of the Internet of things and to get data in real time in isolated geographical areas or in machine-to-machine communications, where it was not possible before (Wixted et al., 2016; Adelantado et al., 2017). LoRaWAN uses LoRa, a proprietary chirp-spread-spectrum modulation technology on layer 1 (physical layer or bit transmission layer) in the OSI model. Therefore there is no addressing in pure LoRa. MAC addresses for LoRa chirps can be assigned in layer 2 (LoRaWAN) by the manufacturer. LoRa is designed for energy-saving applications for wide-range networks. For this reason, focus was placed on low energy consumption during the development of the standard.
The MQTT-SN gateway is the connection point between the sensor and the MQTT broker. The database connector parses the sensor data and sends them as a suitable HTTP request to a time series database as well as the database of luftdaten.info. The data from the time series database can be visualized via Grafana. The data sent to luftdaten.info are visualized as mentioned in Sect. 3 at maps.luftdaten.info.
Low-cost sensors for measuring the concentrations of particulate matter in the atmosphere have limitations in accuracy, which are documented in their data sheets and certain scientific studies (Crilley et al., 2018; Kumar et al., 2015).
Sensors may suffer from anomalies and external influences, especially relative humidity (RH) and temperature (LUBW Landesanstalt für Umwelt, Messungen und Naturschutz Baden-Württemberg, 2017). These low-cost sensors, however, can have significant benefits when contextual information like weather, location, or measurement time is used for online data stream processing. The sensor nodes have a maximum survival range determined by the relative humidity of the environment. Such knowledge can be introduced into a contextual representation through ontological instantiation of the sensor, which can be used to generate data stream queries that perform anomaly detection on the incoming data.
Context information is also valuable when it enables the use of data fusion to measure the quality of the sensors. Considering the sensors used in the luftdaten.info, it is known that relative humidity affects the accuracy of the particulate-matter values considerably. The sensor data sheet8 indicates a relative-humidity upper bound of 70 % RH for a working environment. If the relative humidity rises above this value, the quality of data decreases and more anomalies can occur. On some sensor platforms, PM sensors are installed together with relative-humidity and temperature sensors.
For these sensor platforms, the anomaly detection rule derived from the data sheet could be used with the on-board relative-humidity sensors. The rule specifies a relative error of 15 % (±10 µg m−3) in relative humidity less than 70 %. Above this range the quality is undefined. Since these values come from cheap unreliable sensors, they need verification and cannot be used alone to check the PM values for anomalies.
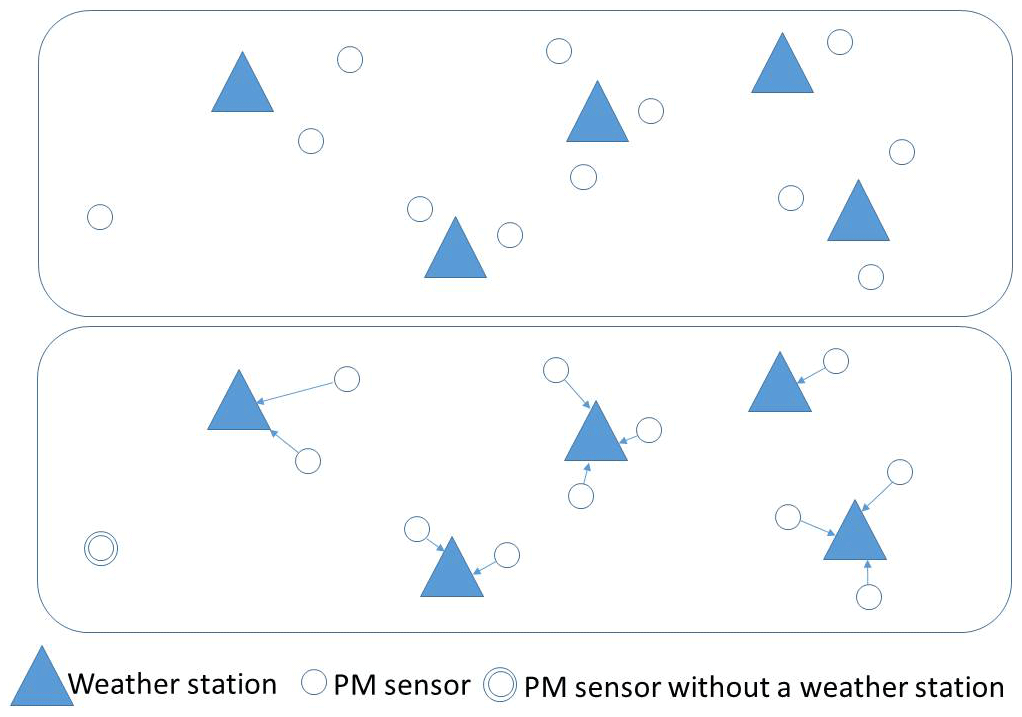
Other data sources like the air quality monitoring stations located in an acceptable range of the deployed sensors can be used to perform data fusion to closely check whether the sensors have the normal conditions to function properly and to check the accuracy of the values of relative humidity. Figure 5 shows how stations within close range of the sensors can be related to each other and later used as a data source for quality assessment and anomaly detection of the sensor measurements.
For the sensor platforms without relative-humidity sensors, the contextual information provides the possibility to deploy the anomaly rule. The deployment location of the sensor can also influence the measurements. The sensors should not be deployed indoors; otherwise the measurement results for the project luftdaten.info will be falsified by events such as cooking or smoking.
4.1 PM sensor data analysis
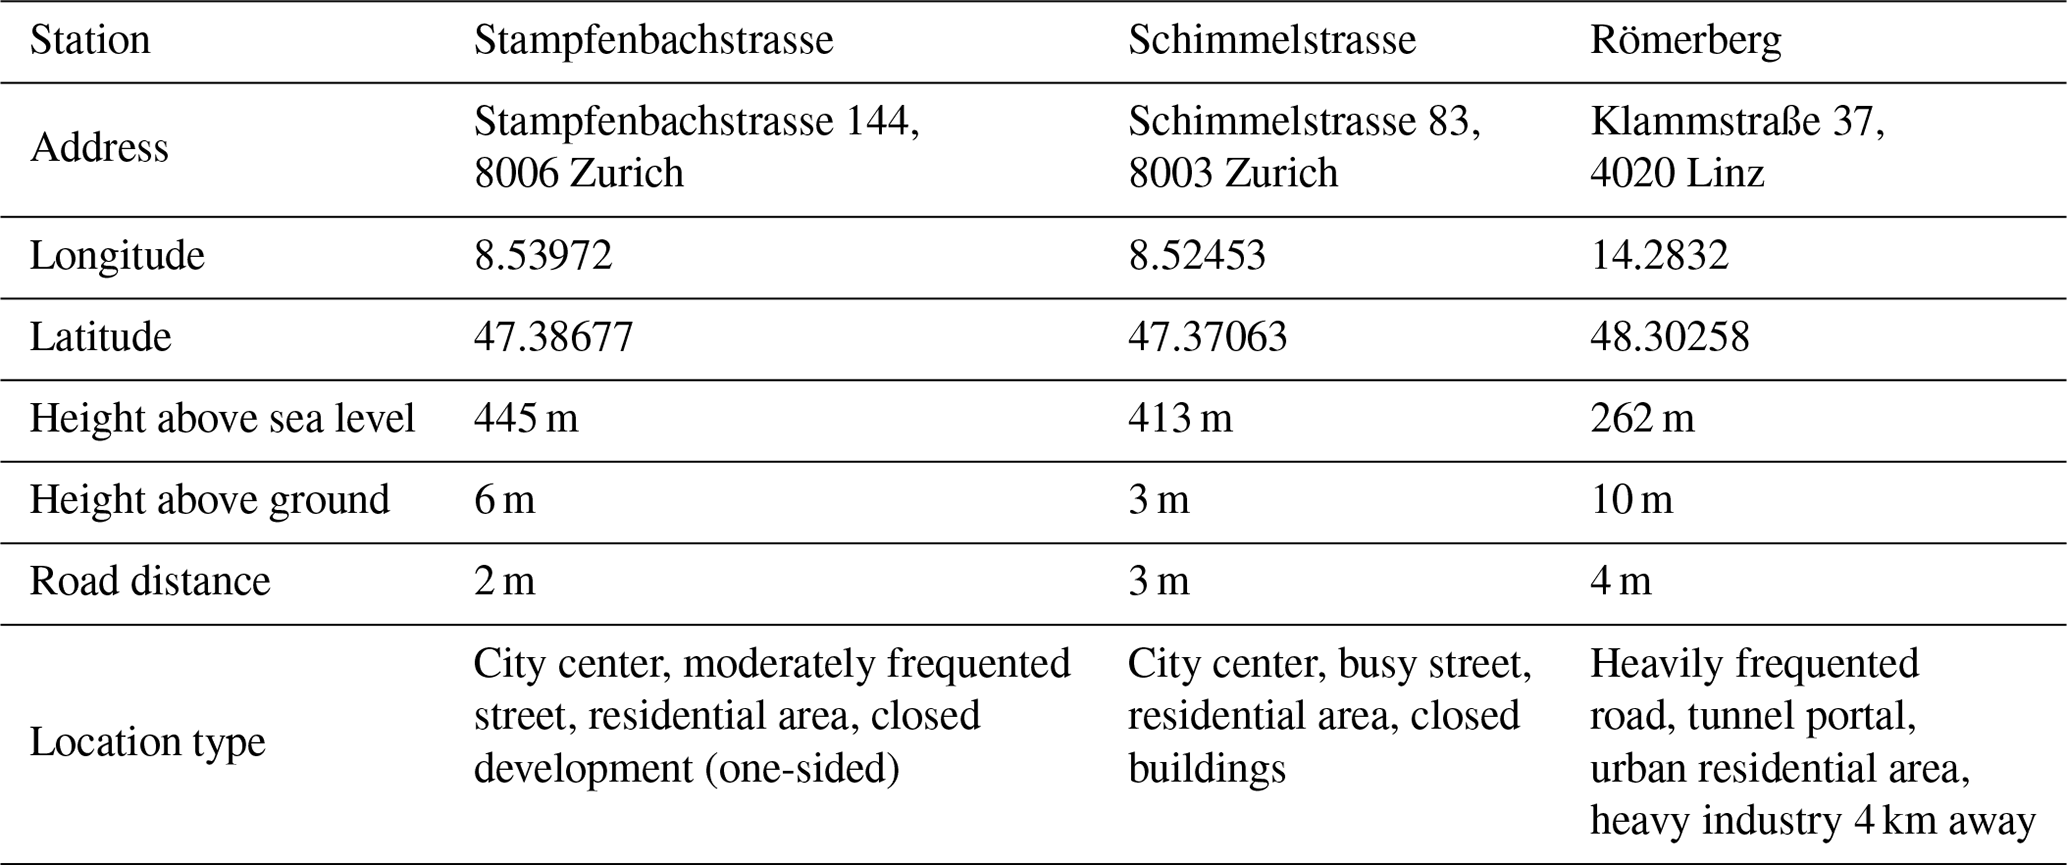
In order to examine the sensor data, data are collected from three SDS011 sensors and compared with three air quality monitoring stations in three different locations, one in Austria (Römerberg) and two in Switzerland (Schimmelstrasse and Stampfenbachstrasse). The sensors are installed within close range of the air quality monitoring stations. One sensor (ID 11149) is in Römerberg, in the city of Linz (Austria), with a distance of 134 m between the SDS011 sensor and the air quality monitoring station. The other two sensors (IDs 601 and 574) are installed in the city of Zurich (Switzerland), with distances of 35 and 90 m to stations in Schimmelstrasse and Stampfenbachstrasse respectively. The distance between the sensors and the stations is in reality non-existent. The distances given are registered to hide the actual location of the sensors. Detailed information about the stations can be extracted from Table 3. The information about the stations in Zurich are based on the descriptions of the health and environment office of Zurich9, and that about the station in Linz is based on the description of the provincial government of upper Austria10.
Table 1Correlation coefficient (rs) of the reference station Römerberg and the sensor 11149.
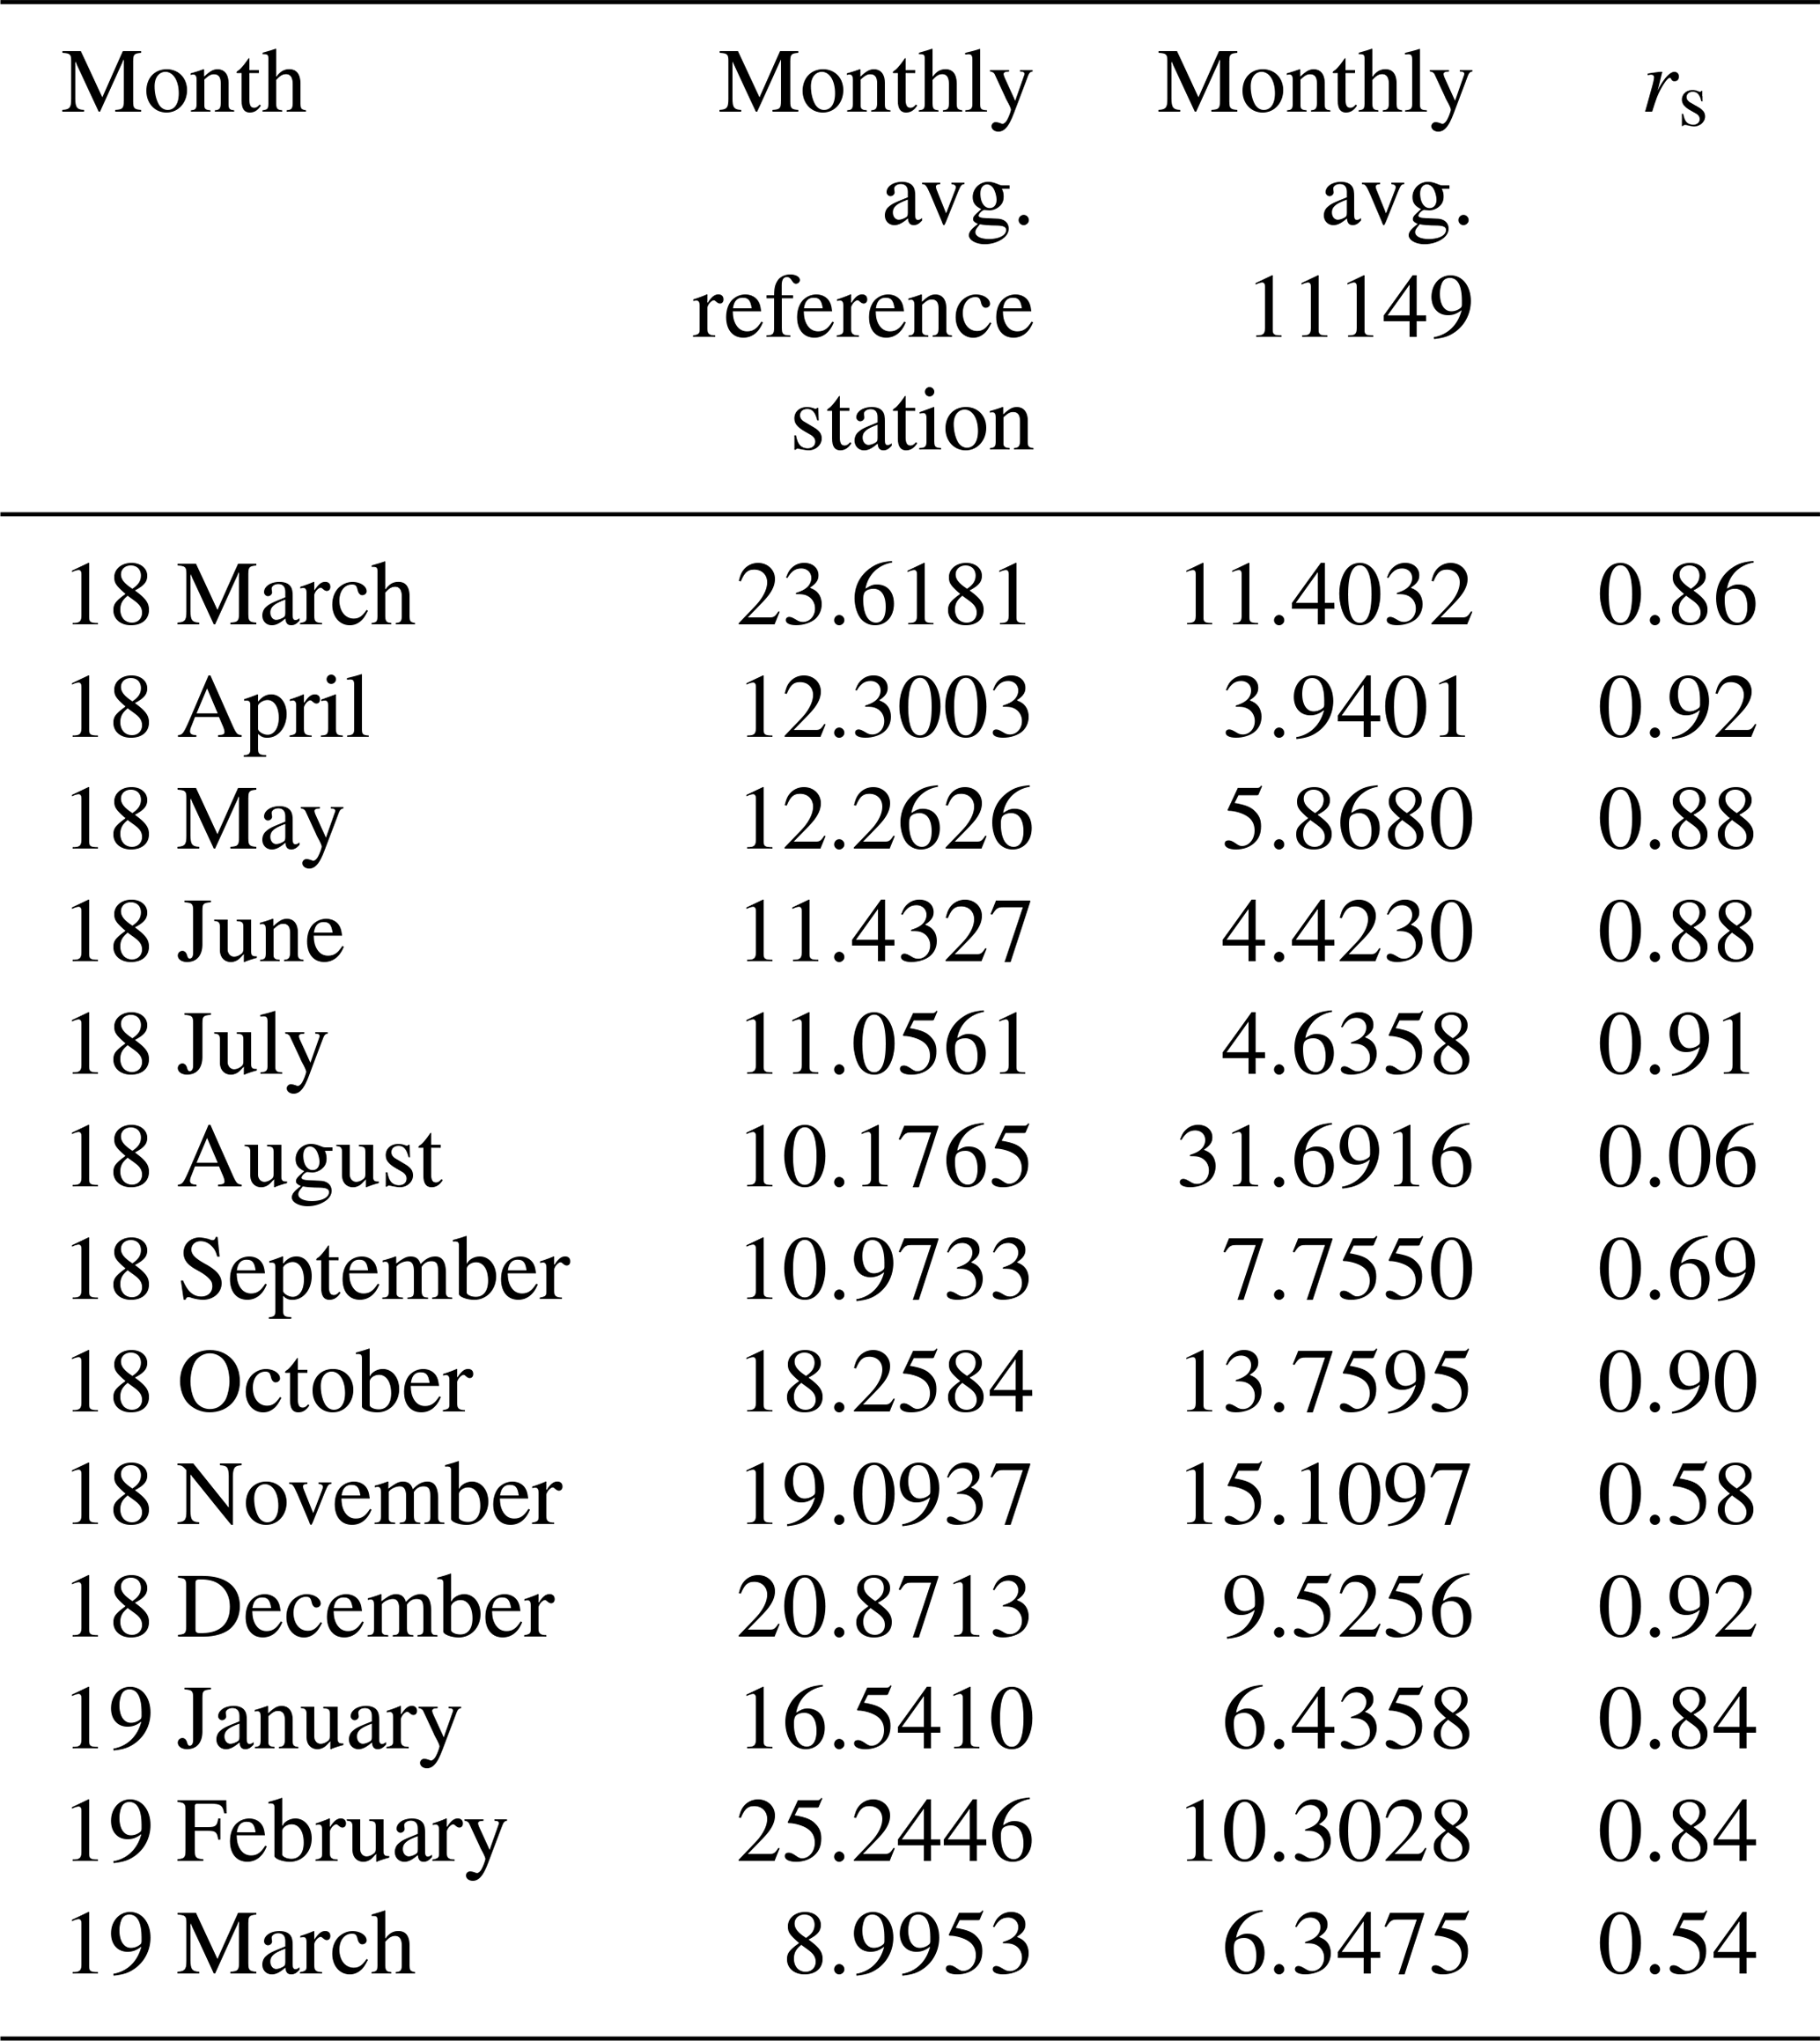
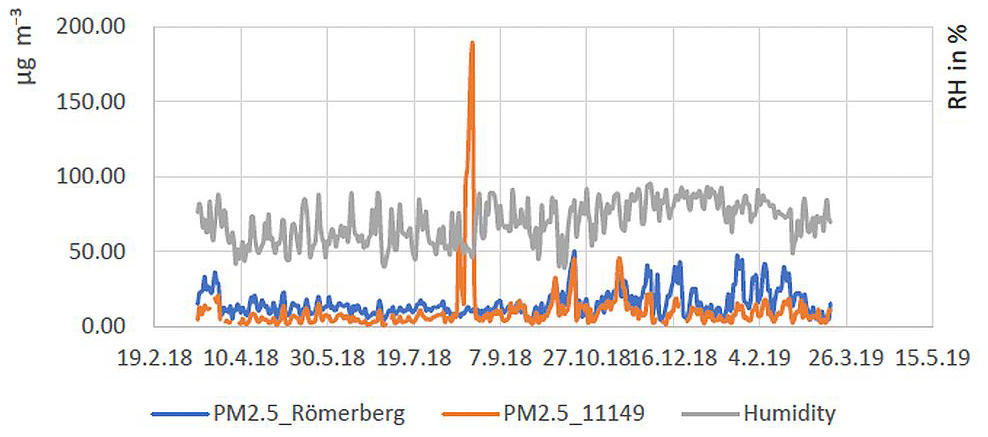
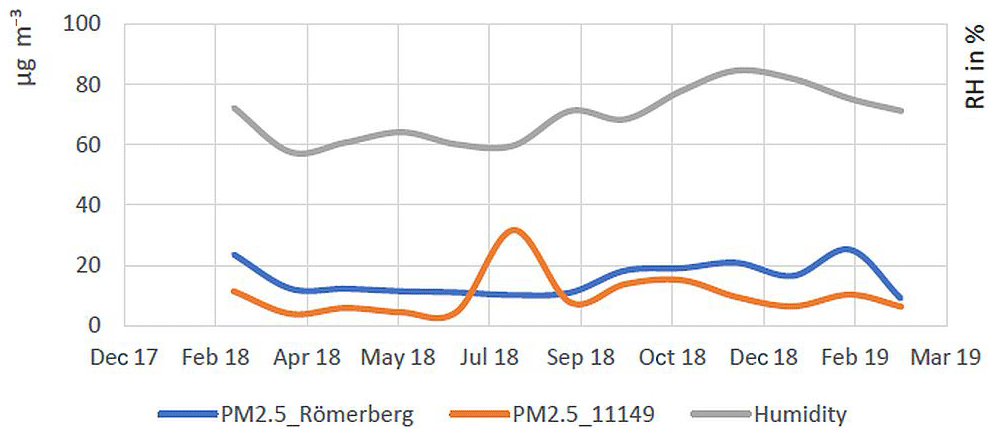
In Fig. 6, the daily averages of the sensor in Römerberg are compared with those of the neighboring station over a year (from December 2017 to December 2018). In the month of August, there were very high values taken by the sensor with a deviation of about 1276 %. There are no clear explanations for these high values given the steady values measured by the station. For the remaining values over the recorded period, the SDS011 sensor captures the tendencies that are measured by the station, as depicted in Fig. 7. Table 1 summarizes the correlation coefficient of the monthly averages between the sensor and the air quality reference station; 91.18 % of the values are lower than those of the station under relative humidity of 70 %, and 88.59 % are lower under relative humidity of 50 %. Also, the sensor managed to record PM values exceeding the EU regulation of 25 mug m−3 409 times in comparison to the 1266 times measured by the official station. From 8771 hourly sensor measurements, we see only 2620 measurements with a deviation of ±5 µg m−3, which makes only 29.87 % of all the measurements.
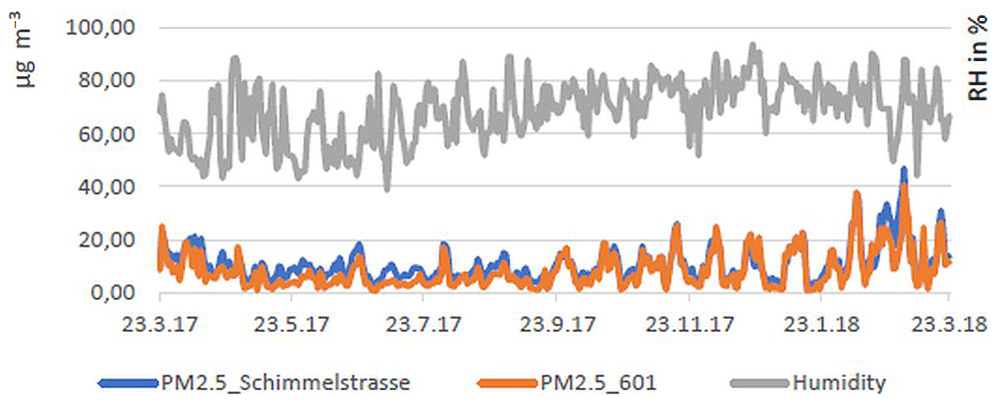
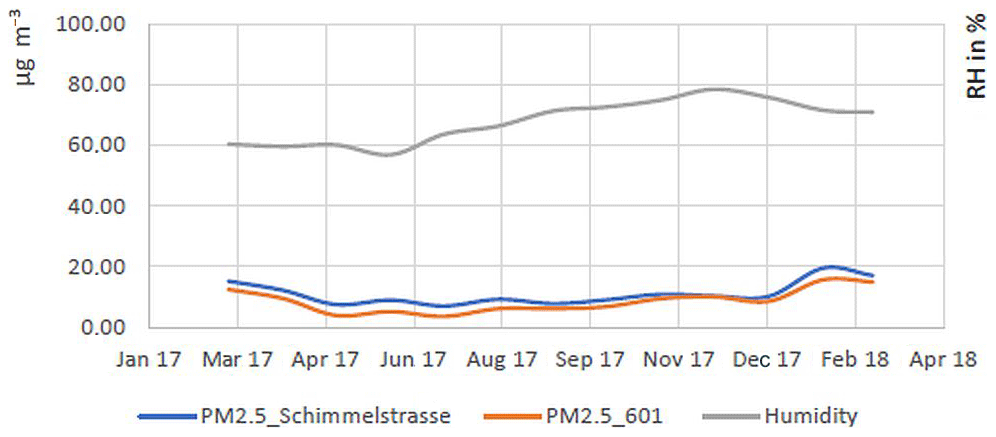
The second combination of sensors in Zurich is between the SDS011 sensor in Schimmelstrasse (ID 601) and the air quality monitoring station nearby. The daily and monthly average PM and relative-humidity values are depicted in Figs. 8 and 9 respectively. Table 2 summarizes the correlation coefficient of the monthly averages between the sensor and the air quality reference station. In relative humidity over 70 %, the station has 77.20 % higher measurements. When the relative humidity is under 50 %, the station has 92.89 % higher values than the SDS011 sensor. The sensor managed to record PM values exceeding the EU regulation of 25 µg m−3 356 times in comparison to the 444 times by the official station. From 8786 hourly measurements taken, the SDS011 managed to make 6984 measurements with a deviation of ±5 µg m−3, which makes up 79.49 % of all the measurements. The SDS011 sensor mostly had PM values less than the station.
Table 2Correlation coefficient (rs) of the reference station Schimmelstrasse and the sensor 601.

Table 3Location information of the air quality monitoring stations.
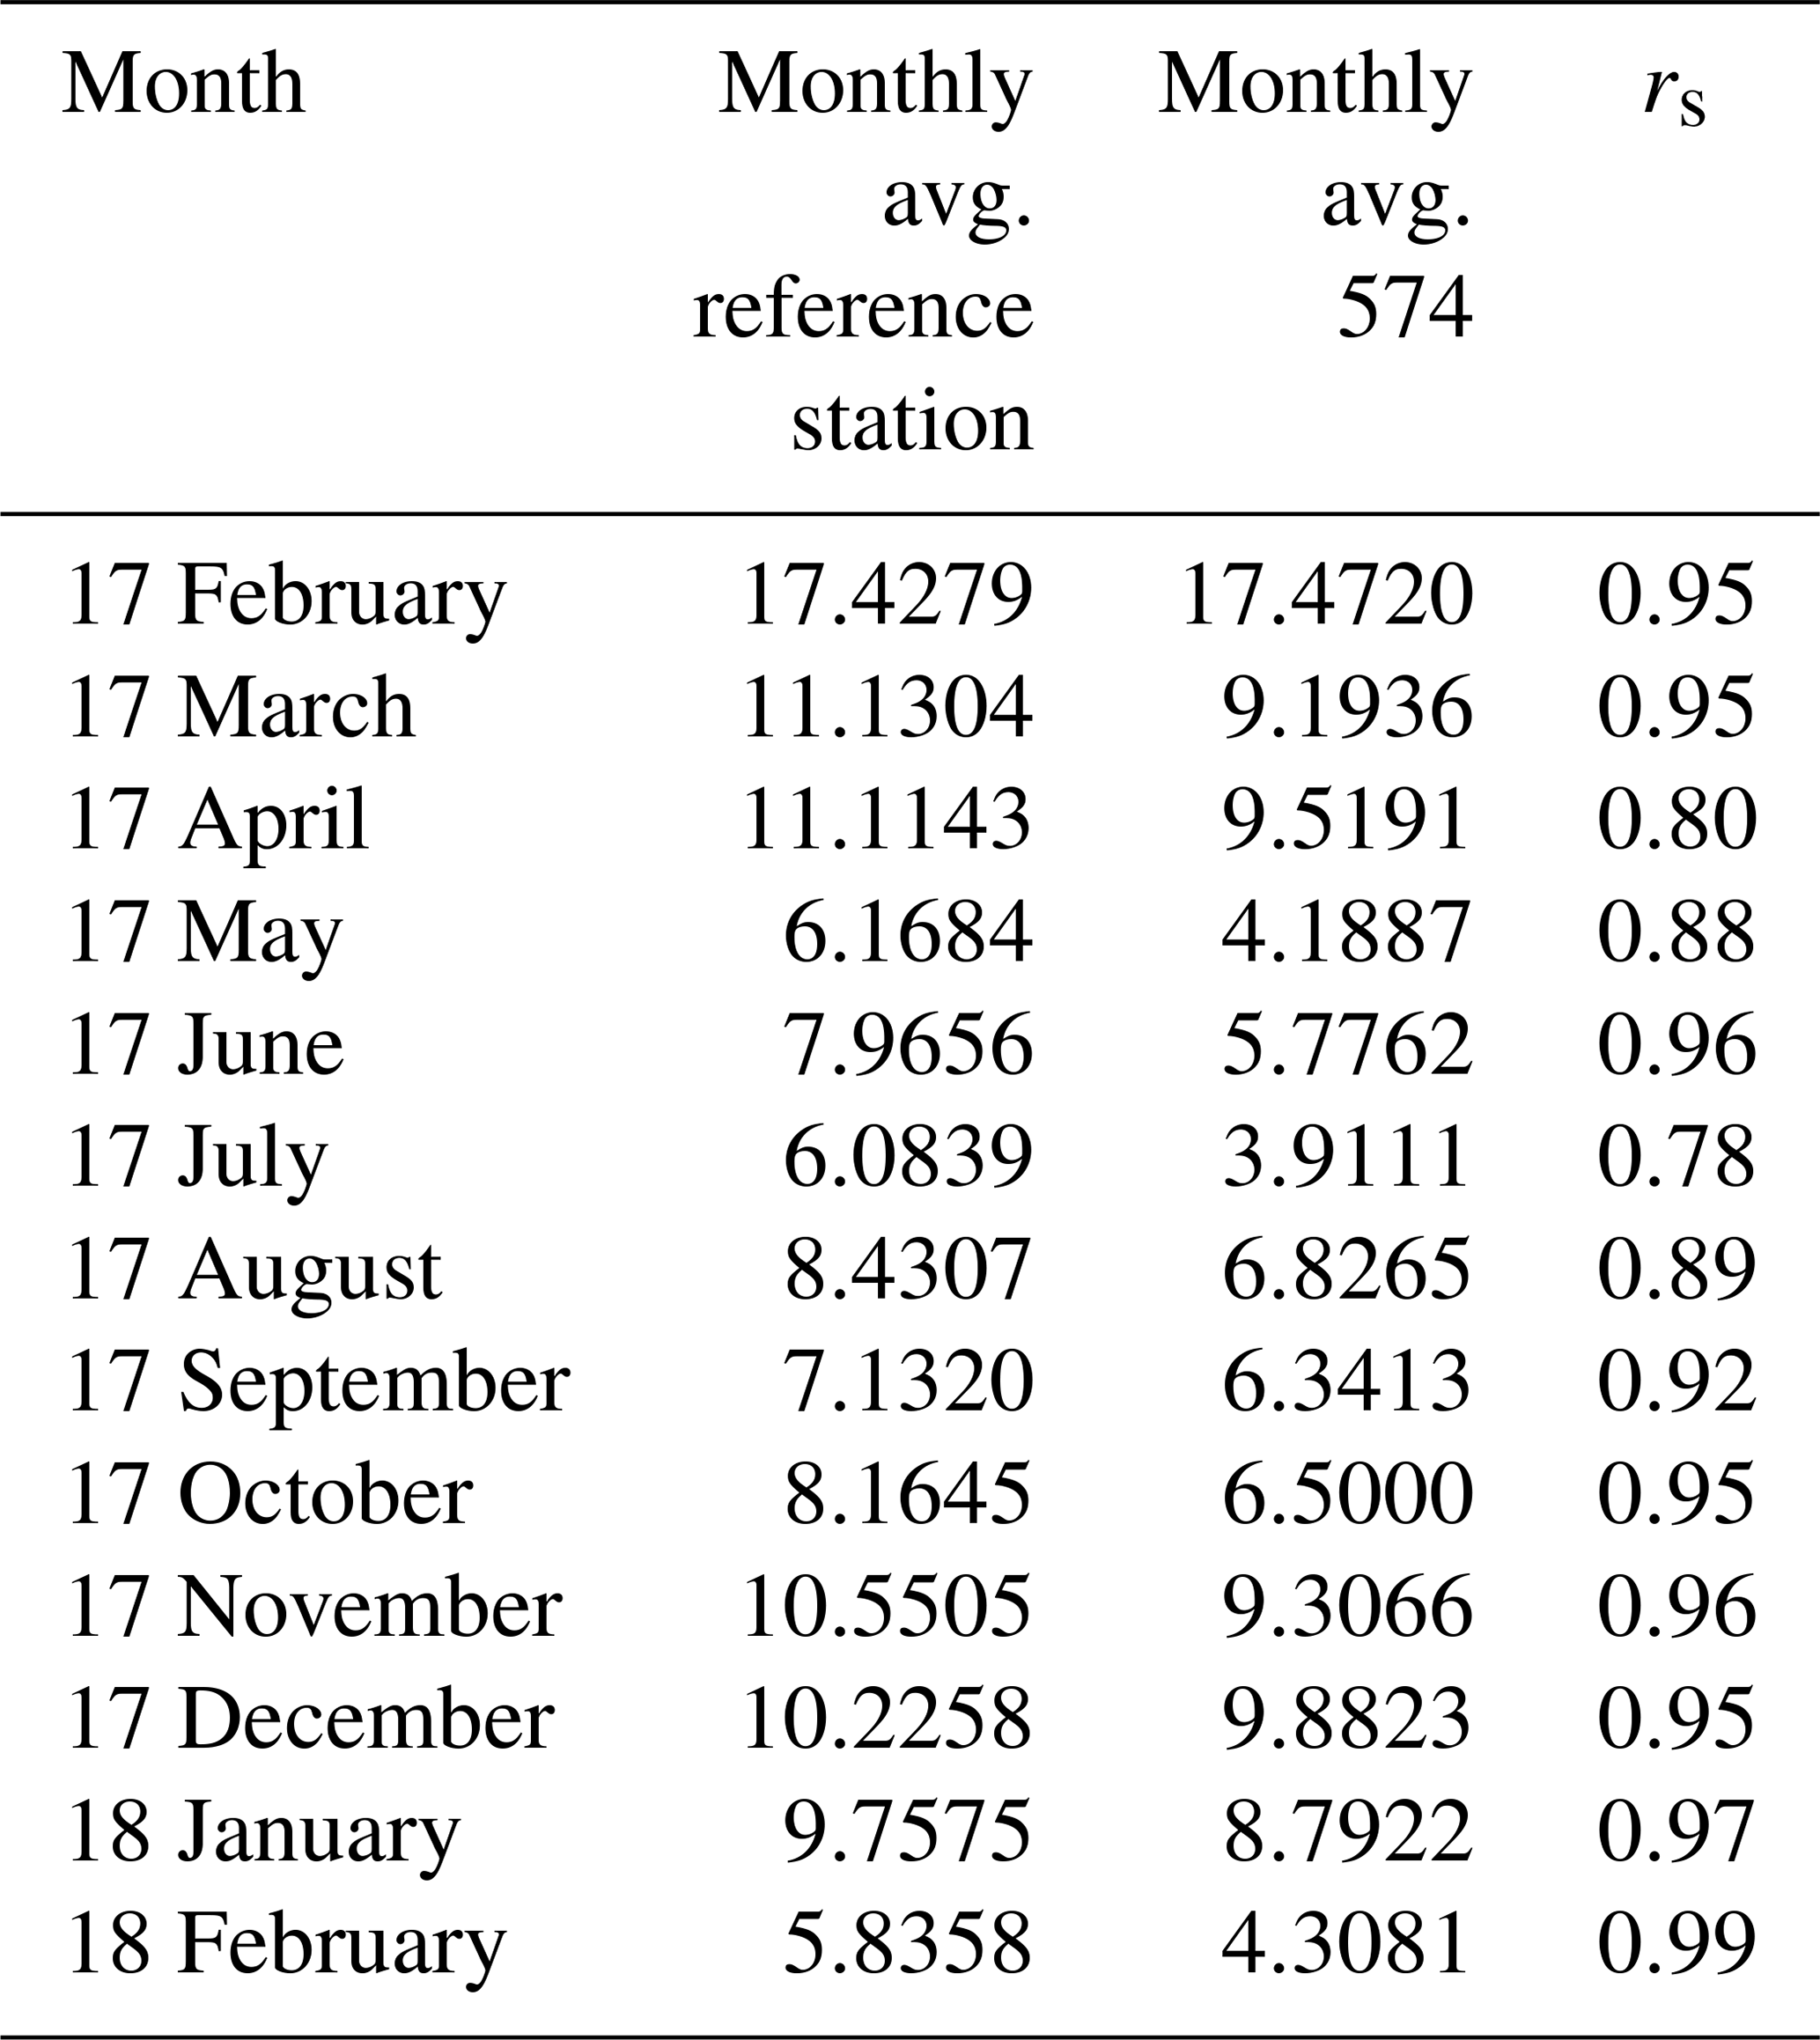
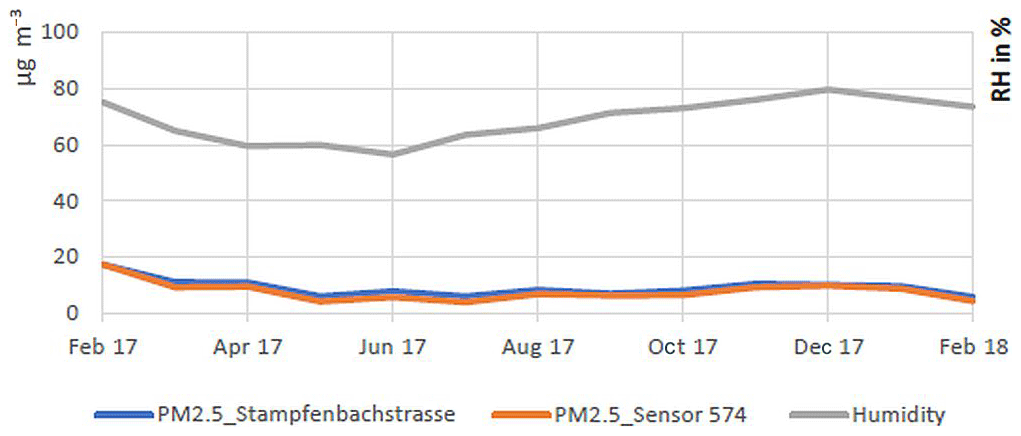
The last combination is between the air quality monitoring station in Stampfenbachstrasse and the SDS011 sensor (ID 547). Table 4 summarizes the correlation coefficient of the monthly averages between the sensor and the air quality reference station. In Fig. 10, 61.66 % of the station measurements are higher than the SDS011 sensor when the relative humidity is over 70 % and 96.97 % higher when the relative humidity is below 50 %. From 8783 hourly measurements taken, the SDS011 managed 7715 measurements with a deviation of ±5 µg m−3, which makes 87.84 % of all the measurements. The monthly average PM values in Fig. 11 show that the sensor 547 had the closest measurements to those of a neighboring station.
Table 4Correlation coefficient (rs) of the reference station Stampfenbachstrasse and the sensor 574.

From the correlation analysis, it can be stated that sensors can detect the increase and decrease in PM levels. However, they cannot offer PM measurements as accurate as those of reference stations. The specification of the working environment is also not accurate. The SDS011 sensors have better measurements in higher relative humidity. Any use of the sensor data without a reference to the nearest stations is not possible.
4.2 Correlation of PM2.5 and PM10
In general, the PM2.5 value is always equal to or lower than the PM10 value. This is given by the definition of the two entities. But it is interesting to analyze the relationship of both values for higher concentrations. For this analysis, we focused again on a radius of 100 km around Bamberg and looked at the hourly measurements for a period of over a year. Only 0.6 % of all data sets have a PM10 concentration above 150 µg m−3. All of these sensors show a high concentration of PM2.5 particles. The portion of the particles with a diameter between 2.5 and 10 µm hence decreases. So incidents with a high PM2.5 pollution occur more frequently over a longer time period, while high pollution of PM10 particles only occurs in very short periods and may therefore not be recognizable in the mean values.
4.3 Correlation with humidity
For analyzing the correlation with humidity, the direct relationship between relative humidity and PM10 measurements is investigated. The calculation of correlation coefficients leads to a value of 0.0, which means that there is no direct relationship between these entities. Figure 12 shows the median of PM10 depending on the relative air humidity.
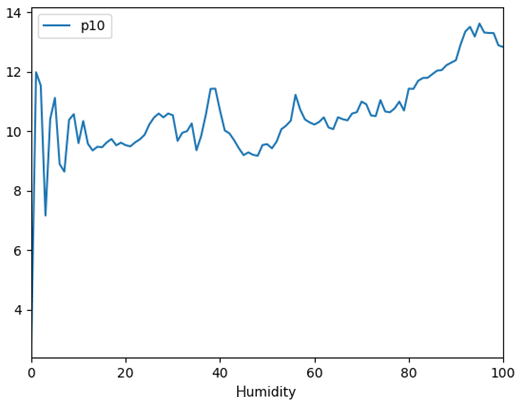
The uncertainty of the SDS011 sensor that gives a limitation to 70 % relative humidity is not visible in this correlation. Below this level there is no direct relationship. In very humid air, however, a significant increase in PM concentration can be seen. The high humidity indicates that there are many water particles (aerosols) in the air. In particular, there are many such particles in the air composition that are measured by the sensor, which is not able to distinguish water from other particles of the same size. This leads to a systematic error which is well known for sensors of this kind (LUBW Landesanstalt für Umwelt, Messungen und Naturschutz Baden-Württemberg, 2017; Laquai, 2018).
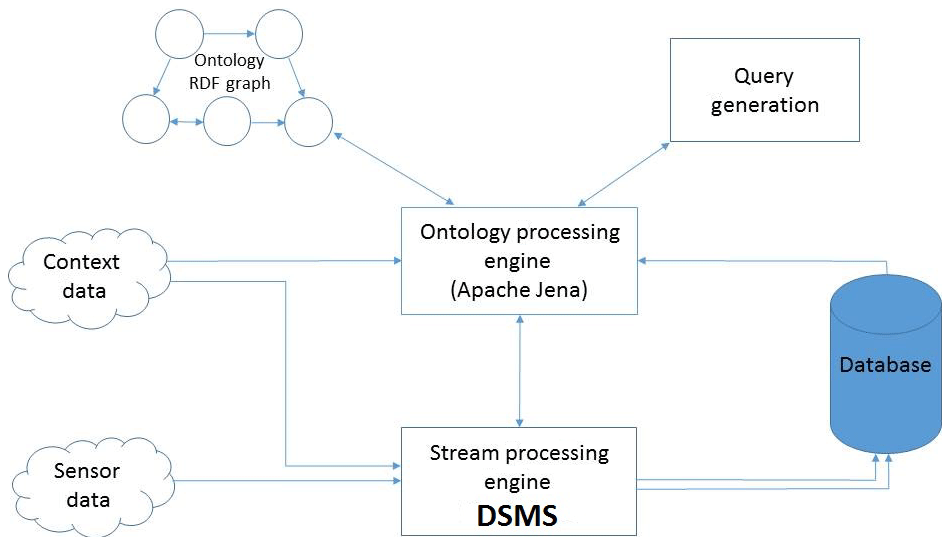
To assess the quality of the PM sensors, we use the architecture consisting of two parts as shown in Fig. 13: the ontology processing engine (OPE) and the stream processing engine (SPE). The OPE collects contextual information about the sensors and air quality monitoring stations to generate instances of the ontologies.
Ontology instances express all the needed information about the sensor. This information is gathered from three main sources: information about the sensors from the data sheet, information about air quality monitoring stations, and the data generated by the sensor. The first source gives the location of the sensor and data-quality-related conditions. The second gives a full list of the existing reference stations and their coordinates. The third source helps to extract the schema and the types of every attribute in the data.
The SPE is a software that handles streams of sensor data. The SPE receives data streams from the sensors and pulls information about the reference stations and their data. It prepares the data for storage and writes them to the database. The query generation part takes the model of every sensor and generates a quality query to measure the accuracy of the measurements. The use of an ontology with a specific domain in this case makes metadata available for any information about the sensors and also helps automatize query generation for the target sensors.
5.1 Implementation
The Ontology Processing Engine populates the ontology and stores it on a linked data graph. It runs on the basis of Apache Jena framework (McBride, 2002). It receives data from PM sensors through the stream processing engine and from the German Meteorological Service, DWD (Deutscher Wetterdienst), about all air quality reference stations.
The SPE, implemented using a data stream management system, gets the reference stations' data by querying the GeoServer of the DWD, formats the data as JSON (ID, location, and measurement data), and forwards the ID and location to the OPE.
The aforementioned JSON data contain all stations. The SPE receives the sensor data and inputs them into our data stream. We transform the JSON data to relational data and write them into a database. The OPE checks the existence of the sensors in the linked data graph through their IDs and adds the new ones to the graph.
Sensors are linked to the nearest stations using Apache Jena ARQ API. It combines simple spatial querying with SPARQL (Kollia et al., 2011). The station location is represented by a polygon through a bbox, and the PM sensor has a geolocation; thus, a spatial SPARQL query is issued for every sensor to find the nearest reference station. The SPARQL query could yield more than one station. If this happens, the centroid of the polygon given by the station is computed and the station with the nearest centroid is assigned to the PM sensor. After the sensors and the stations are linked, the RDF (Resource Description Framework) graph now contains all the information about every sensor with the related station.
With the RDF graph available, the query generator creates, for every sensor, a query that measures the accuracy of the PM and relative-humidity values. The query is then started by a data stream management system, Odysseus, where relative-humidity data streamed by the station are fused with the data from the related sensor. From relative-humidity values of the station, the accuracy of the relative humidity of a sensor is immediately checked. Furthermore, the continuous query reports a drop in the accuracy of PM values as soon as the relative humidity rises above 70 %. Anomalies are also detected if a sensor keeps sending high relative-humidity values, although the station reports dry weather.
5.2 Impact
Given the overall huge number of sensors deployed throughout Germany and the available air quality monitoring stations in Germany (912), we used a sample of 5410 PM sensors. The coverage quality is measured using a radius of 10 km. In a radius of 10 km, Fig. 14 shows that 1244 sensors (23 %) are within 10 km of a station, and 2759 sensors (51 %) find a station within 20 km. Every class stands for the increasing radius that contains the next available station for every sensor. The first class stands for the nearest stations in a 10 km radius, and the next class indicates the number of sensors that have a station within 20 km.

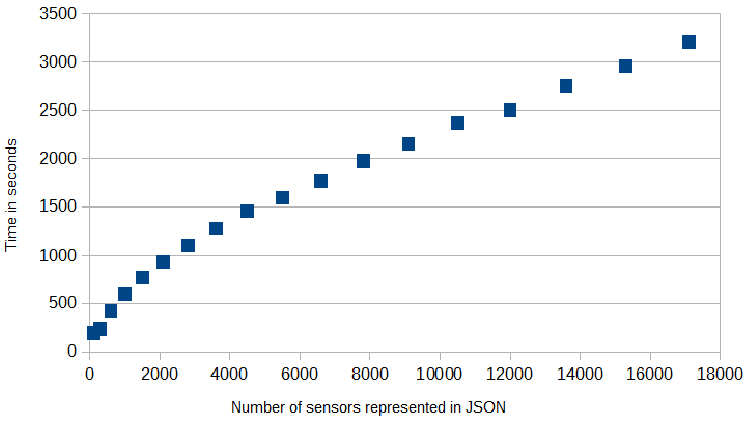
5.3 Performance
We tested the performance of the architecture in terms of throughput. We want to measure the time needed to gradually create the linked graph for the SDS011 sensors. The computer used for the experiments has the following specifications: Intel(R) Core(TM) i5-2520M at 2.50 GHz (four cores) with 8 GB of RAM, and the operating system used is Ubuntu 16.04.3 LTS. Figure 15 shows the instantiation time evolution with the increase in the number of sensors. The runtime becomes linear after 4000 sensors. The instantiation process is a one-time operation for every sensor.
We see how low-cost PM sensors can be used to expand the spatial coverage of particulate-matter concentration measurements. These sensors show less accuracy in comparison to reference air quality monitoring stations. With the use of an ontology-populating architecture and a data stream management system, we can monitor the data quality of those low-cost sensors.
For optimal sensor measurements, an auto-calibration of the sensors should also be considered. This calibration should offset systematic measurement deviations in long-term use. The data analysis shows that the PM sensors give considerably lower PM values in comparison to reference stations. The effect of relative humidity is also variable. The measurement deviations (LUBW Landesanstalt für Umwelt, Messungen und Naturschutz Baden-Württemberg, 2017) caused by the attached fan and the attached hose length and different copies of the production batch (LUBW Landesanstalt für Umwelt, Messungen und Naturschutz Baden-Württemberg, 2017) impact the quality of the measurements. To improve the quality of the data, extensive experiments with the sensors along with a comparison with reference station are planned to check the measurement similarities and create predictive models for the sensors. Further influences on the sensor data quality must also be recorded and modeled in order to make the approach for online monitoring of the sensor data quality operational.
The Innovation Lab student project shows the possibilities of extending the platform luftdaten.info with new functions. Due to the complexity in the implementation of MoRa and CoRa, it is difficult to make them available to the general public. Now, we can build mobile sensors with which we can increase the coverage of particulate-matter measurements on the map. With the use of mobile sensors, it is possible to discover sensors that give measurements with a higher deviation and to report these.
This is a citizen science project in which the data are provided under the links of the projects. In this case, the database is Madavi. A link to all the data can be found here: https://www.madavi.de/sensor/graph.php?showfloat (last access: 24 October 2019).
As for the data from the weather stations mentioned in the paper, every weather station provides open access to its data.
MG, GMN, and TM worked on the LoRa and CoRa components under the supervision of SS. TW, LM, and DNä provided parts of the data analysis. GW and DNi worked together to raise the awareness of the public to the initiative of using low-cost PM sensors to measure the air quality. AB and SS provided the implementations of the system. All the authors participated in the writing process.
The authors declare that they have no conflict of interest.
This article is part of the special issue “Sensors and Measurement Systems 2018”. It is a result of the “Sensoren und Messsysteme 2018, 19. ITG-/GMA-Fachtagung”, Nuremberg, Germany, from 26 June 2018 to 27 June 2018.
We would like to thank the Technologie Allianz Oberfranken (TAO)11 as well as the Zentrum Digitalisierung.Bayern (ZD.B)12 for their support and funding, without which the equipment and setting up of the Living Lab Bamberg would not have been possible. We would also like to thank Bernd Spaderna for his valuable input and help in the process of writing the paper. Also, we would like to thank Florian Beetz, Frank Phillip Kaiser, Thomas Ostrowski, and Rajko Zschiegner for their collaboration in the first version of the paper (Steuer et al., 2018).
This paper was edited by Andreas Schütze and reviewed by six anonymous referees.
Adelantado, F., Vilajosana, X., Tuset-Peiro, P., Martinez, B., Melia-Segui, J., and Watteyne, T.: Understanding the limits of LoRaWAN, IEEE Commun. Mag., 55, 34–40, 2017. a
Batini, C. and Scannapieco, M.: Data Quality: Concepts, Methodologies and Techniques (Data-Centric Systems and Applications), Springer-Verlag, Inc., New York, 2006. a, b
Boubel, R. W., Vallero, D., Fox, D. L., Turner, B., and Stern, A. C.: Fundamentals of air pollution, Elsevier, USA, 2013. a
Budde, M., Riedel, T., Beigl, M., Schäfer, K., Emeis, S., Cyrys, J., Schnelle-Kreis, J., Philipp, A., Ziegler, V., Grimm, H., and Gratza, T.: SmartAQnet: remote and in-situ sensing of urban air quality, in: Proc. SPIE 10424, Remote Sensing of Clouds and the Atmosphere XXII, 104240C, 6 October 2017, Warsaw, Poland, https://doi.org/10.1117/12.2282698, 2017a. a
Budde, M., Schankin, A., Hoffmann, J., Danz, M., Riedel, T., and Beigl, M.: Participatory Sensing or Participatory Nonsense? Mitigating the Effect of Human Error on Data Quality in Citizen Science, Proc. ACM Interact. Mob. Wearable Ubiquit. Technol., 1, 39:1–39:23, https://doi.org/10.1145/3131900, 2017b. a
Calbimonte, J.-P., Eberle, J., and Aberer, K.: Toward Self-monitoring Smart Cities: the OpenSense2 Approach, Informatik-Spektrum, 40, 75–87, https://doi.org/10.1007/s00287-016-1009-y, 2017. a
Castell, N., Dauge, F. R., Schneider, P., Vogt, M., Lerner, U., Fishbain, B., Broday, D., and Bartonova, A.: Can commercial low-cost sensor platforms contribute to air quality monitoring and exposure estimates?, Environ. Int., 99, 293–302, 2017. a
Compton, M., Barnaghi, P., Bermudez, L., García-Castro, R., Corcho, O., Cox, S., Graybeal, J., Hauswirth, M., Henson, C., Herzog, A., Huang, V., Janowicz, K., Kelsey, W. D., Le Phuoc, D., Lefort, L., Leggieri, M., Neuhaus, H., Nikolov, A., Page, K., Passant, A., Sheth, A., and Taylor, K.: The SSN ontology of the W3C semantic sensor network incubator group, Web Semantics, 17, 25–32, https://doi.org/10.1016/j.websem.2012.05.003, 2012. a
Crilley, L. R., Shaw, M., Pound, R., Kramer, L. J., Price, R., Young, S., Lewis, A. C., and Pope, F. D.: Evaluation of a low-cost optical particle counter (Alphasense OPC-N2) for ambient air monitoring, Atmos. Meas. Tech., 11, 709–720, https://doi.org/10.5194/amt-11-709-2018, 2018. a
Garg, B. D., Cadle, S. H., Mulawa, P. A., Groblicki, P. J., Laroo, C., and Parr, G. A.: Brake Wear Particulate Matter Emissions, Environ. Sci. Technol., 34, 4463–4469, 2000. a
Geisler, S., Quix, C., Weber, S., and Jarke, M.: Ontology-Based Data Quality Management for Data Streams, J. Data Inform. Qual., 7, 18:1–18:34, https://doi.org/10.1145/2968332, 2016. a
Giechaskiel, B., Maricq, M., Ntziachristos, L., Dardiotis, C., Wang, X., Axmann, H., Bergmann, A., and Schindler, W.: Review of motor vehicle particulate emissions sampling and measurement: From smoke and filter mass to particle number, J. Aerosol Sci., 67, 48–86, https://doi.org/10.1016/j.jaerosci.2013.09.003, 2014. a, b
Hagemann, R., Corsmeier, U., Kottmeier, C., Rinke, R., Wieser, A., and Vogel, B.: Spatial variability of particle number concentrations and NOx in the Karlsruhe (Germany) area obtained with the mobile laboratory `AERO-TRAM', Atmos. Environ., 94, 341–352, https://doi.org/10.1016/j.atmosenv.2014.05.051, 2014. a
Heimann, I., Bright, V., McLeod, M., Mead, M., Popoola, O., Stewart, G., and Jones, R.: Source attribution of air pollution by spatial scale separation using high spatial density networks of low cost air quality sensors, Atmos. Environ., 113, 10–19, 2015. a
Heinrich, J., Hoelscher, B., Frye, C., Meyer, I., Pitz, M., Cyrys, J., Wjst, M., Neas, L., and Wichmann, H.-E.: Improved Air Quality in Reunified Germany and Decreases in Respiratory Symptoms, Epidemiology, 13, 394–401, 2002. a
Jovaševic-Stojanovic, M., Bartonova, A., Topalovic, D., Lazovic, I., Pokric, B., and Ristovski, Z.: On the use of small and cheaper sensors and devices for indicative citizen-based monitoring of respirable particulate matter, Environ. Poll. (Barking, Essex: 1987), 206, 696–704, https://doi.org/10.1016/j.envpol.2015.08.035, 2015. a
Kallweit, D. and Wintermeyer, D.: Berechnung der gesundheitlichen Belastung der Bevölkerung in Deutschland durch Feinstaub (PM10), UMID Umw. Mensch-Informationsdienst, 4, 18–24, 2013. a
Kollia, I., Glimm, B., and Horrocks, I.: SPARQL Query Answering over OWL Ontologies, in: The Semantic Web: Research and Applications, edited by: Grigoris, A., Grobelnik, M., Simperl, E., Parsia, B., Plexousakis, D., De Leenheer, P, and Pan, J., Springer, Berlin, Heidelberg, 382–396, 2011. a
Kuka, C.: Qualitaetissensitive Datenstromverarbeitung zur Erstellung von dynamischen Kontextmodellen, PhD thesis, University of Oldenburg, Oldenburg, Germany, 2014. a
Kuka, C. and Nicklas, D.: Supporting Quality-aware Pervasive Applications by Probabilistic Data Stream Management, in: Proceedings of the 8th ACM International Conference on Distributed Event-Based Systems, 26–29 May 2014, Mumbai, India, 330–333, https://doi.org/10.1145/2611286.2611319, 2014. a
Kumar, P., Morawska, L., Martani, C., Biskos, G., Neophytou, M., Di Sabatino, S., Bell, M., Norford, L., and Britter, R.: The rise of low-cost sensing for managing air pollution in cities, Environ. Int.l, 75, 199–205, 2015. a
Laquai, B.: Kompensation des Feuchte-Effekts bei Low-Cost Feinstaubsensoren-Sensoren nach dem Streulichtverfahren, available at: http://opengeiger.de/Feinstaub/FeuchteKompensation.pdf (last access: 28 October 2019), 2018. a
LUBW Landesanstalt für Umwelt, Messungen und Naturschutz Baden-Württemberg: Messungen mit dem Feinstaubsensor sds011, available at: http://www4.lubw.baden-wuerttemberg.de/servlet/is/268831/messungen_mit_dem_feinstaubsensor_sds011.pdf (last access: 28 October 2019), 2017. a, b, c, d
McBride, B.: Jena: a semantic Web toolkit, IEEE Internet Comput., 6, 55–59, https://doi.org/10.1109/MIC.2002.1067737, 2002. a
Mellon, D., King, S. J., Kim, J., Reid, J. P., and Orr-Ewing, J. A.: Measurements of Extinction by Aerosol Particles in the Near-Infrared Using Continuous Wave Cavity Ring-Down Spectroscopy, J. Phys. Chem. A, 115, 774–783, https://doi.org/10.1021/jp109894x, 2011. a
Nussbaumer, T., Czasch, C., Klippel, N., Bafver, L., and Tullin, C.: Particulate Emissions from Biomass Combustion in IEA Countries Survey on Measurements and Emission Factors, Bioenergy Task, International Energy Agency (IEA), in: 16th European Biomass Conference and Exhibition, 2–6 June 2008, Valencia, Spain, Oral Pre-sentation OA 9.2, 32 pp., 2008. a
Penkov, S., Taneva, A., Petrov, M., and Kalkov, V.: Industrial network design using Low-Power Wide-Area Network, in: 2017 4th International Conference on Systems and Informatics (ICSAI), Hangzhou, 40–44, 2017. a
Penza, M., Suriano, D., Villani, M. G., Spinelle, L., and Gerboles, M.: Towards air quality indices in smart cities by calibrated low-cost sensors applied to networks, in: SENSORS, 2014 IEEE, Valencia, 2012–2017, https://doi.org/10.1109/ICSENS.2014.6985429, 2014. a
Petäjäjärvi, J., Mikhaylov, K., Yasmin, R., Hämäläinen, M., and Iinatti, J.: Evaluation of LoRa LPWAN Technology for Indoor Remote Health and Wellbeing Monitoring, Int. J. Wireless Inform. Netw., 24, 153–165, 2017. a
Steuer, S., Beetz, F., Geisselbrecht, M., Kaiser, F., Nicklas, D., Nikol, G., Ostrowski, T., Wieland, T., Wiesemann, G., and Zschiegner, R.: Feinstaub selbst messen: Datenqualität in einem Citizen-Science-Projekt, in: ITG-Fb. 281: Sensoren und Messsysteme, VDE, 19. ITG/GMA-Conference, 26–27 June 2018, Nürnberg, 2018. a, b
Truong, H. L. and Stanford-Clark, A.: MQTT For Sensor Networks (MQTT-SN) Protocol Specification Version 1.2, available at: http://www.mqtt.org/new/wp-content/uploads/2009/06/MQTT-SN_spec_v1.2.pdf (last access: 28 October 2019), 2013. a
van Donkelaar, A., Martin, R. V., Brauer, M., and Boys, B. L.: Use of Satellite Observations for Long-Term Exposure Assessment of Global Concentrations of Fine Particulate Matter, Environ. Health Perspect., 123, 135–143, https://doi.org/10.1289/ehp.1408646, 2015. a
Vincent, J. H.: Aerosol Sampling, in: Science, Standards, Instrumentation and Applications, Direct-reading Aerosol Sampling Instruments, Wiley, England, 489–513, https://doi.org/10.1002/9780470060230.ch10, 2007. a, b
Wang, Z., Chen, L., Tao, J., Zhang, Y., and Su, L.: Satellite-based estimation of regional particulate matter (PM) in Beijing using vertical-and-RH correcting method, Remote Sens. Environ., 114, 50–63, https://doi.org/10.1016/j.rse.2009.08.009, 2010. a
WHO: Burden of disease from household air pollution for 2016, available at: https://www.who.int/airpollution/data/HAP_BoD_results_May2018_final.pdf (last access: 28 October 2019), 2018. a
Wixted, A. J., Kinnaird, P., Larijani, H., Tait, A., Ahmadinia, A., and Strachan, N.: Evaluation of LoRa and LoRaWAN for wireless sensor networks, in: 2016 IEEE SENSORS, Orlando, FL, 1–3., https://doi.org/10.1109/ICSENS.2016.7808712, 2016. a, b
http://ec.europa.eu/environment/air/quality/directive.htm (last access: 24 October 2019).
http://smartaq.net/ (last access: 24 October 2019).
http://www.luftdaten.info (last access: 24 October 2019).
http://www.bluepingu.de/blog/513-frankenstaub (last access: 24 October 2019).
https://www.madavi.de/ok-lab-stuttgart/ (last access: 24 October 2019).
https://www.uni-bamberg.de/mobi/transfer/innovationslabor-bamberg-coburg/ (last access: 24 October 2019).
https://lora-alliance.org (last access: 24 October 2019).
http://www.inovafitness.com/en/a/chanpinzhongxin/95.html (last access: 24 October 2019).
https://www.stadt-zuerich.ch/gud/de/index.html (last access: 24 October 2019).
https://www.land-oberoesterreich.gv.at (last access: 24 October 2019).
https://www.tao-oberfranken.de, last access: 24 October 2019.
https://zentrum-digitalisierung.bayern, last access: 24 October 2019.