the Creative Commons Attribution 4.0 License.
the Creative Commons Attribution 4.0 License.
 | 24 Sep 2019
Close-to-process strain measurement in ultrasonic vibration-assisted turning
Simon Kimme
Nessma Hafez
Christian Titsch
Jonas Maximilian Werner
Andreas Nestler
Welf-Guntram Drossel
The application of ultrasonic vibration assistance in machining offers many benefits over conventional machining. In some machining processes, like the generation of geometrically defined microstructures by cutting, the interaction of the system components and the machining process can be particularly crucial with respect to the production result. Monitoring of ultrasonic vibration-assisted machining in terms of the in-process measurement of frequency and amplitude is currently realized by measurement inside the actuator; thus, measurement is presently undertaken relatively far away from the cutting process. In this paper an in-process measurement set-up based on strain gauges positioned close to the cutting edges is presented. It is used to investigate the induced vibration in the ultrasonic horn. Experiments on machine samples with and without ultrasonic vibration assistance are performed using the in-process measurement set-up described. The results of the strain gauges are analysed in comparison to internal feedback signal and surface measurements. The experiments show the high sensitivity of the measurement set-up presented and a huge gain of information compared with the conventional measurement approach. This enables improved controllability of the excited mode shapes as well as in-process adjustment of the ultrasonic vibration frequency and amplitude for the manufacturing of defined microstructures.


The history of machine tools shows a continuous development in the context of precision and productivity. Nowadays, the integration of mechatronic systems allows for a higher functionality and a higher performance (Neugebauer et al., 2007). Ultrasonic devices represent one group of these mechatronic systems that can improve the performance and functionality of machine tools in different ways (Gallego-Juárez and Graff, 2015).
In electrical discharge machining, for example, the vibrations improve debris removal from the sparking gap (Khatri et al., 2016). In the case of welding vibrations generate better material mixing and uniform grain growth and, therefore, improve mechanical and surface properties (Kumar et al., 2017). A decrease of the process force during deep drawing, due to ultrasonic vibration assistance, leads to an increase of the limiting drawing ratio (Huang et al., 2014).
Ultrasonic vibration-assisted turning, as one exemplary manufacturing process for ultrasonic vibration-assisted (UVA) machining, can extend tool life and allows for the usage of diamond tools to machine workpieces from steel (Brehl and Dow, 2008). Furthermore, the surface roughness values can be decreased and burr formation can be significantly reduced. Possible explanations for the abovementioned advantages are a shorter contact time for diffusion processes, decreased cutting forces and improved chip breaking.
Depending on the direction of vibration it is also possible to generate different surface properties in turning processes (Schubert et al., 2011; Nestler and Schubert, 2014). If the defined direction of vibration is radial to the sample, microstructures are formed. Especially in the case of micro-structuring, ultrasonic vibration-assisted turning is a highly productive process in comparison with other production processes. In a study by Zhang et al. (2014), a two-stage machining process is discussed to generate surfaces with predefined dimples in a sliding surface. In the first step, ultrasonic vibration-assisted turning is applied to generate a completely micro-structured surface. Subsequently, in a second step, without any vibration assistance and using a depth of cut of only a few microns, peaks are removed. This results in a smooth and almost burr-free surface with dimples.
Especially for micro-structuring, process control of the ultrasonic system is absolutely necessary. Most of the ultrasonic vibration-assisted turning systems perform at a frequency of about 20 kHz, reaching a maximum amplitude of 20 µm peak to peak (Brehl and Dow, 2008). The systems consist of a transducer (see Fig. 1), a sonotrode and a generator, the latter of which is made up of a power supply as well as an oscillator and controller (Gallego-Juárez and Graff, 2015). The sonotrode can be used to magnify the amplitude due to a geometrical transformation. At the end of the sonotrode there is a cutting tool. The transducer generates the vibration at a specific frequency – a resonance frequency. The necessary condition for this is that the natural frequency of the system is equal to the excitation frequency; only in this case are the highest amplitudes of the system possible. The disadvantage of such a system is that it is reliant on this specific frequency. The piezoelectric discs use the indirect piezoelectric effect to generate vibrations. The masses tune the frequency of the system. The bolt applies a pre-load to protect the discs from damage. The final goal is to tune the vibrations into a specific shape, usually a longitudinal vibration, with a specific frequency. The transducer and the sonotrode contract and expand in the case of longitudinal vibration, and so there are nodes of high strain and zero displacement. Therefore, the bearings should be at nodes without displacement, and the connection between transducer and sonotrode should have zero strain.
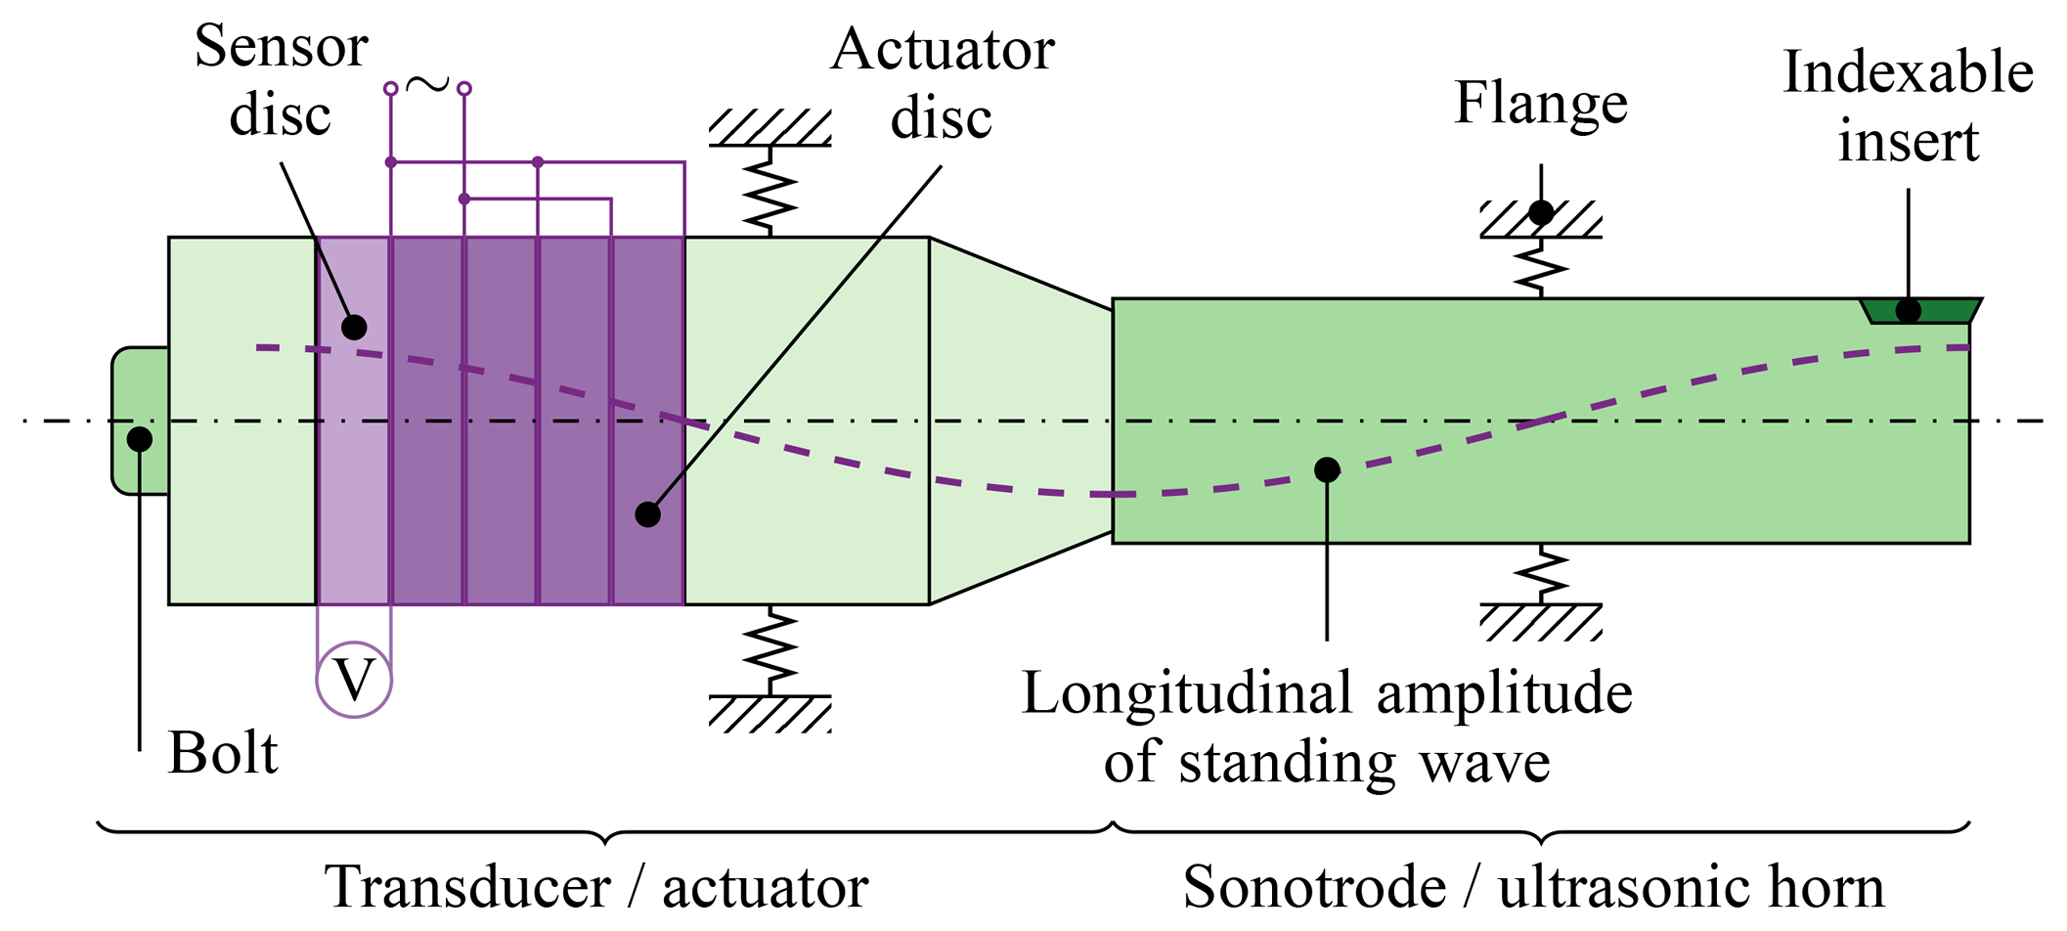
Figure 1The general structure of active tool holders used for ultrasonic vibration-assisted turning. Special features of the set-up utilized are the additional sensor discs within the transducer and a flange in the middle of the sonotrode, which increase bending stiffness.
For a predefined microstructure it is pivotal to control the amplitude and the frequency. It is possible to use a fixed frequency, but a frequency shift caused by external conditions, such as variation of the load, might occur (Arnold and Mühlen, 2001). Reasons for these shifts could be non-linear effects and the influence of temperature (Yokozawa et al., 2017). Another possibility is to use a feedback signal for a closed-loop control, which is referred to as “autoresonant control” (Babitsky et al., 2004). In general, internal electrical (current, voltage and power) and external mechanical (displacement, velocity and acceleration) feedback signals (Voronina and Babitsky, 2008) are possible. The electrical signal is already available, but is distant from the cutting edge. A mechanical signal can be measured close to the cutting edge, but the permanent fixation under industrial standards is far more challenging. A simulative comparison of electrical and mechanical feedback shows lower maximum deviation of the root mean square (rms) when the mechanical signal is close to the cutting edge (Voronina and Babitsky, 2008).
An experimental comparison of ultrasonic vibration-assisted drilling with an inductive sensor confirms the simulation results (Li et al., 2015). A specific solution is to use an additional passive piezoelectric disc integrated into the transducer (Yokozawa et al., 2017), as shown in Fig. 1. Studies on the classification of this system in relation to the previously presented systems are unknown to the authors.
In summary, ultrasonic vibration-assisted turning has many benefits, especially with respect to productive micro-structuring. However, to utilize this process effectively a control strategy with high precision is necessary. Autoresonant control with a mechanical feedback signal close to the cutting edge seems very promising; however, there are only a few existing studies on this topic.
The main focus of this paper is to evaluate a proposed measurement set-up based on strain gauges, which are attached close to the cutting edge, and compare it to a sensor system inside the actuator. Both measurement systems are implemented into a turning process and used simultaneously to investigate the amplitude and the resonance frequency of the vibration during operation. In the following, a brief overview of the oscillation system (actuator and sonotrode), the examined turning process and the measurement set-up is given.
2.1 Transducer and sonotrode
A set-up similar to the one shown in Fig. 1 was chosen as the initial configuration.
The sonotrode (also called acoustic horn) applied was specifically manufactured from titanium alloy TiAl6V4 with a natural frequency of 24 kHz, specified by the manufacturer. It was attached to the UIS250V ultrasonic generator unit (both made by DEVAD GmbH). The generator unit delivers 24 kHz and has an automatically tunable range of approximately ±1 kHz; this range allows for continuous adjustment of the desired excitation frequency to keep the sonotrode and tool assembly in resonance during the process. The amplitude of vibration can be varied by adjusting the generator power.
The transducer, which is connected to the sonotrode, utilizes the inverse piezoelectric effect to transduce an electric field into a mechanical strain. Taking advantage of the direct piezoelectric effect that converts a mechanical strain into an electrical charge, it is possible to use single discs of the piezoelectric stack as a sensor. Using this signal, the vibrations generated within the transducer are controlled. In addition, it is possible to detect the signal as an analogue output. This signal is used to compare the current database with close-to-process measurement data.
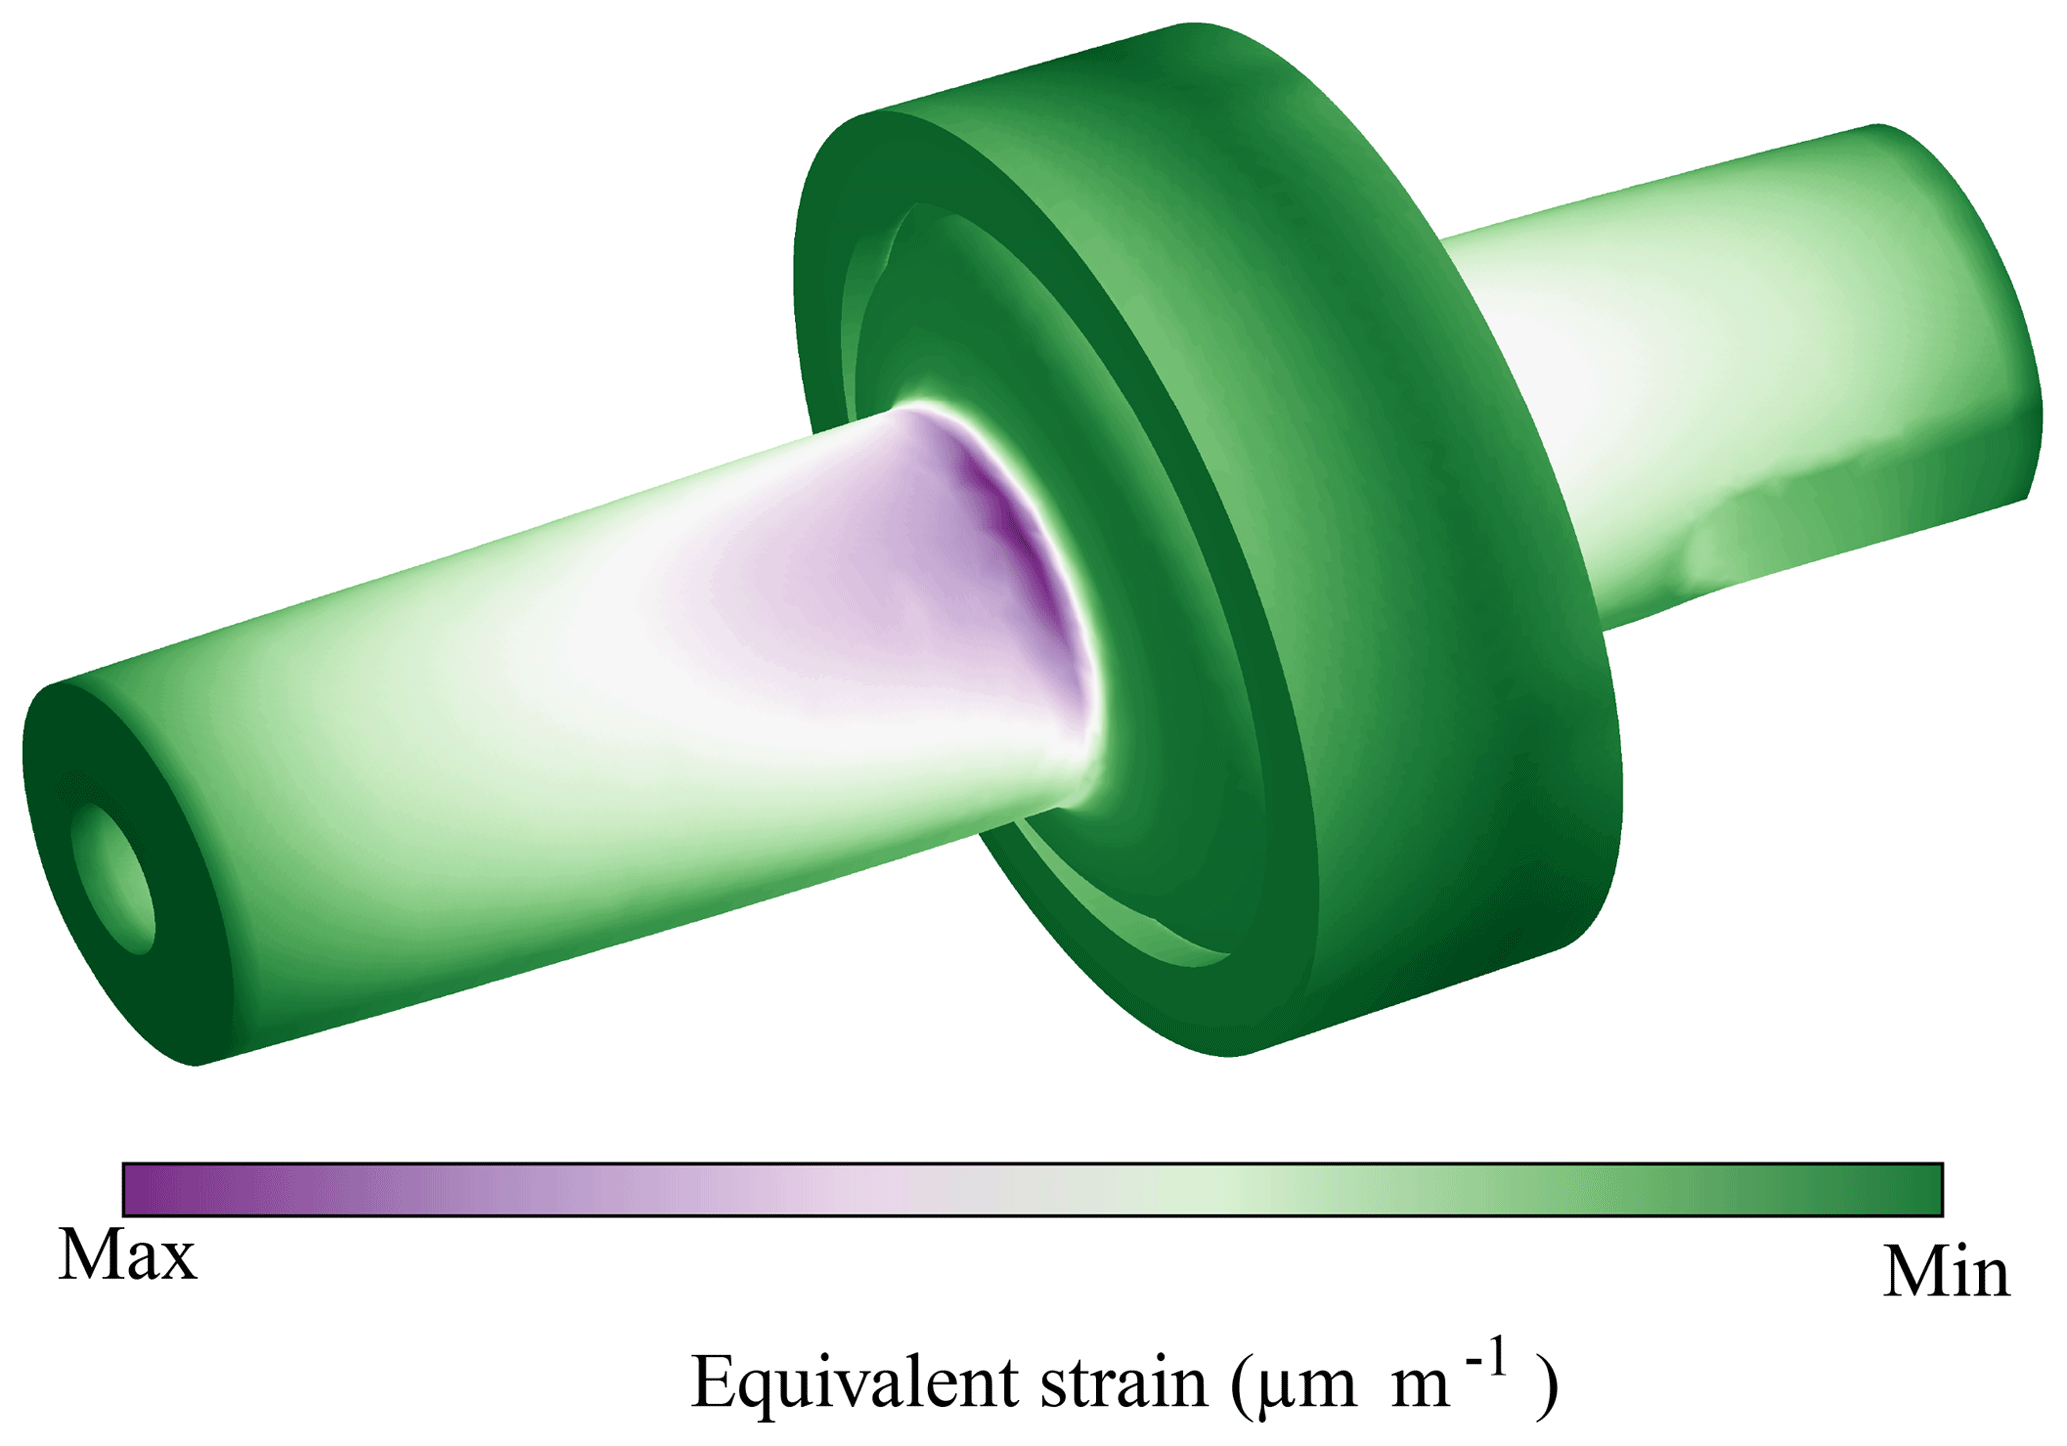
A simulation using finite element method (FEM) was conducted to investigate the natural frequency, the related mode shapes and the expected strains of the sonotrode. The expected strains are the main criteria for the choice of optimized measurement sites for the strain gauges. If the strains are very small, the influence of the noise might be too high, but excessive strains lead to a defect in the sensor. The CAD models from DEVAD GmbH are imported into the simulation. For a validation of the material parameters, the weight of the sonotrode is measured and the longitudinal natural frequency is established with the help of a shaker and an acceleration sensor. With these parameters, the density and modulus of elasticity are gradually changed to compare the simulated and experimentally investigated weight and natural frequencies.
After this validation process, the simulation revealed a natural frequency of approximately 23.76 kHz when the sonotrode was excited in a longitudinal vibration. The simulation results for exciting the longitudinal vibration mode of the sonotrode are shown in Fig. 2. The figure shows the results of a modal analysis; thus, the amplitudes shown are not of quantitative nature. The areas of high strain are located around the fixing position (flange) of the sonotrode.
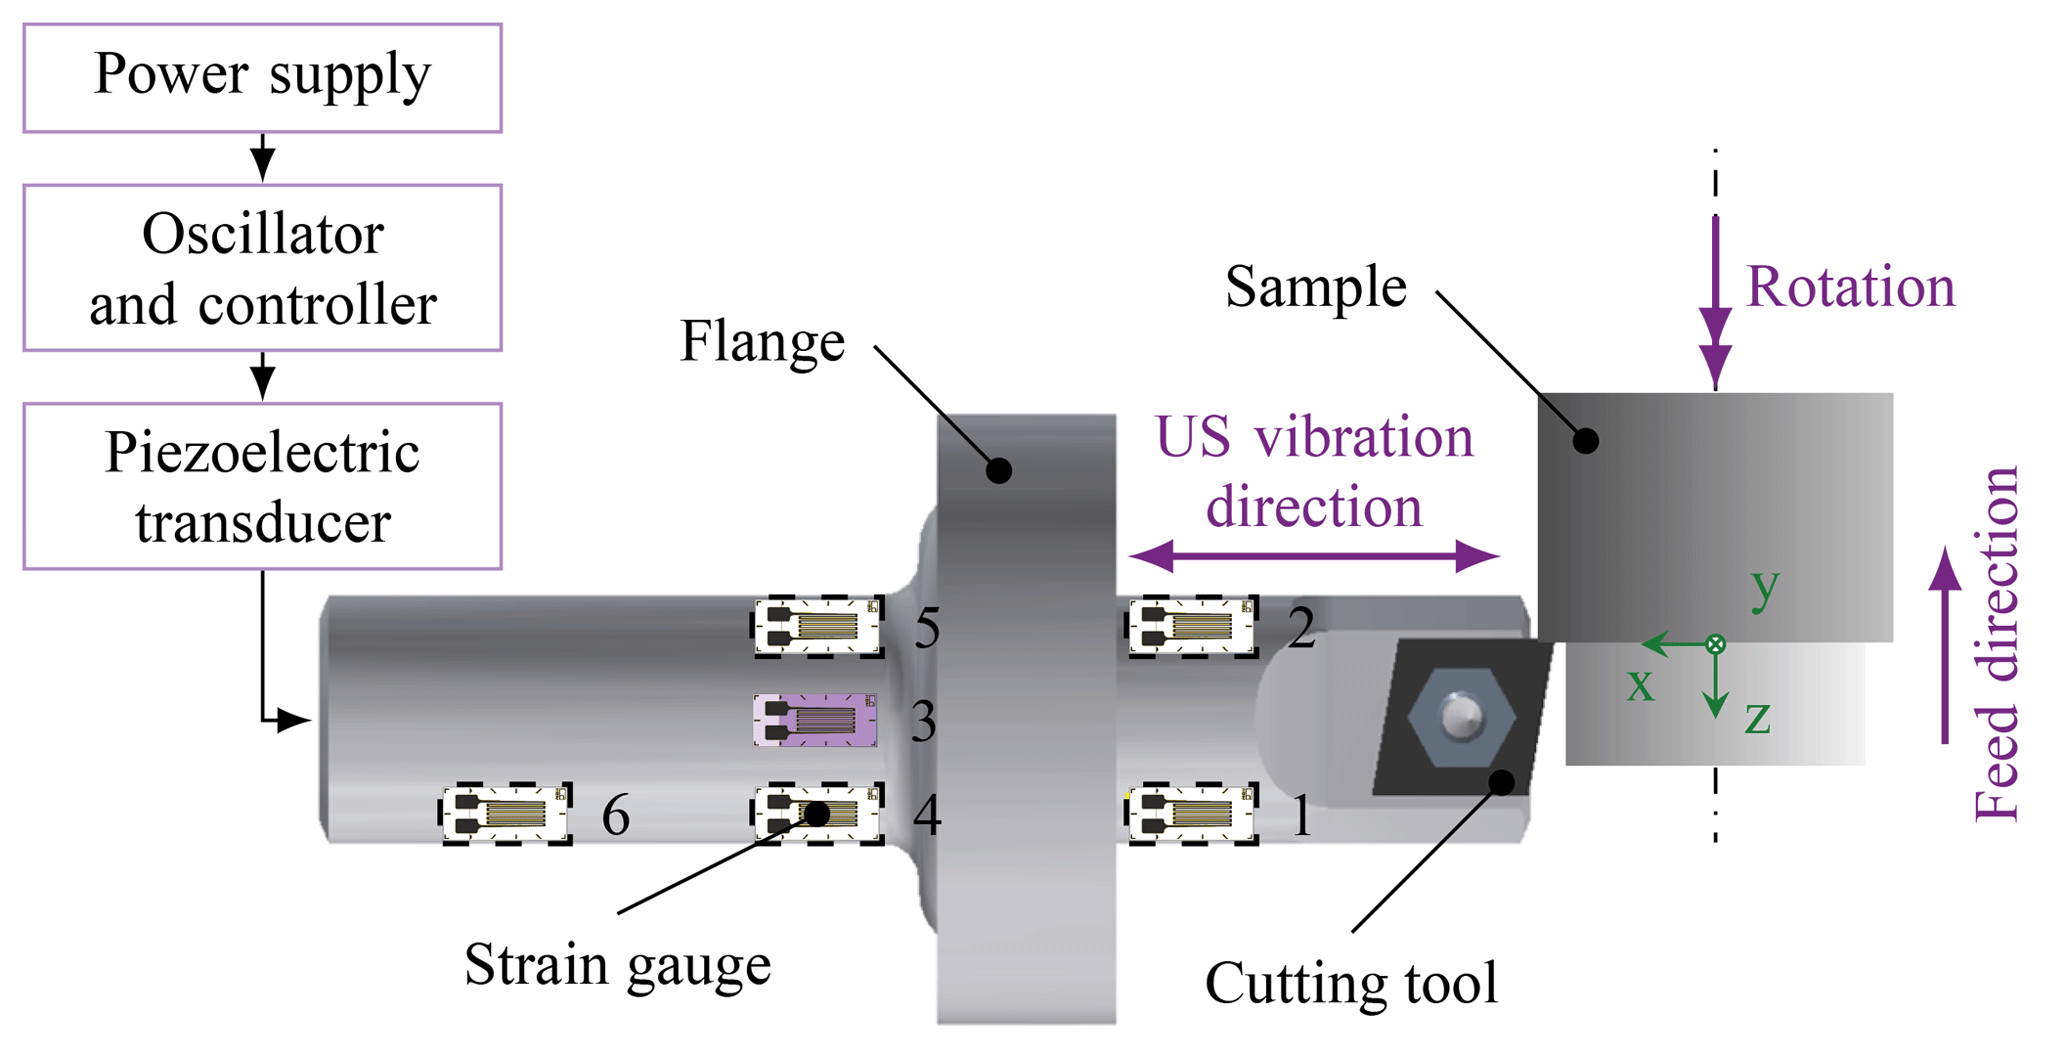
Figure 3A detailed schematic illustration showing the main components of the ultrasonic (US) vibration-assisted system used in the experiments and the positions of the six strain gauges (SG) on the sonotrode. Except for SG 3 (violet) all strain gauges are on the rear side of the sonotrode (white with dashed frame).
Table 1Experiment parameters for the examined turning process.

2.2 Turning process
Due to an acceptable degree of complexity, a turning process was selected to examine the new measurement approach. To ensure a defined initial state for the samples, pre-machining without UVA was carried out. This was followed by the actual machining process with UVA. The general parameters of the turning process were chosen in a similar fashion to Schubert et al. (2011) and are listed in Table 1. The experiments included eight samples in total. All samples were machined on a SPINNER PD 32 precision lathe. Four samples were used to test the data-processing system. Three of the remaining four samples were machined with UVA using the same process parameters, and one sample was machined without UVA for the purpose of comparison with the others.
The samples were comprised of aluminium alloy EN AW-2017. All of the samples were prepared in a cylindrical form with a length of 20 mm and a diameter of 21 mm. In this work 1-D longitudinal ultrasonic vibration assistance was applied in the radial direction (see Fig. 3). The depth of cut was the same for all samples processed and was equal to 0.25 mm. The feed was also kept constant for all samples at 0.5 mm. With the ultrasonic generator used, a vibration amplitude of about 2.4 µm was achievable in this set-up. This amplitude was detected by a laser Doppler vibrometer in a separate measurement carried out for free vibration (no load).
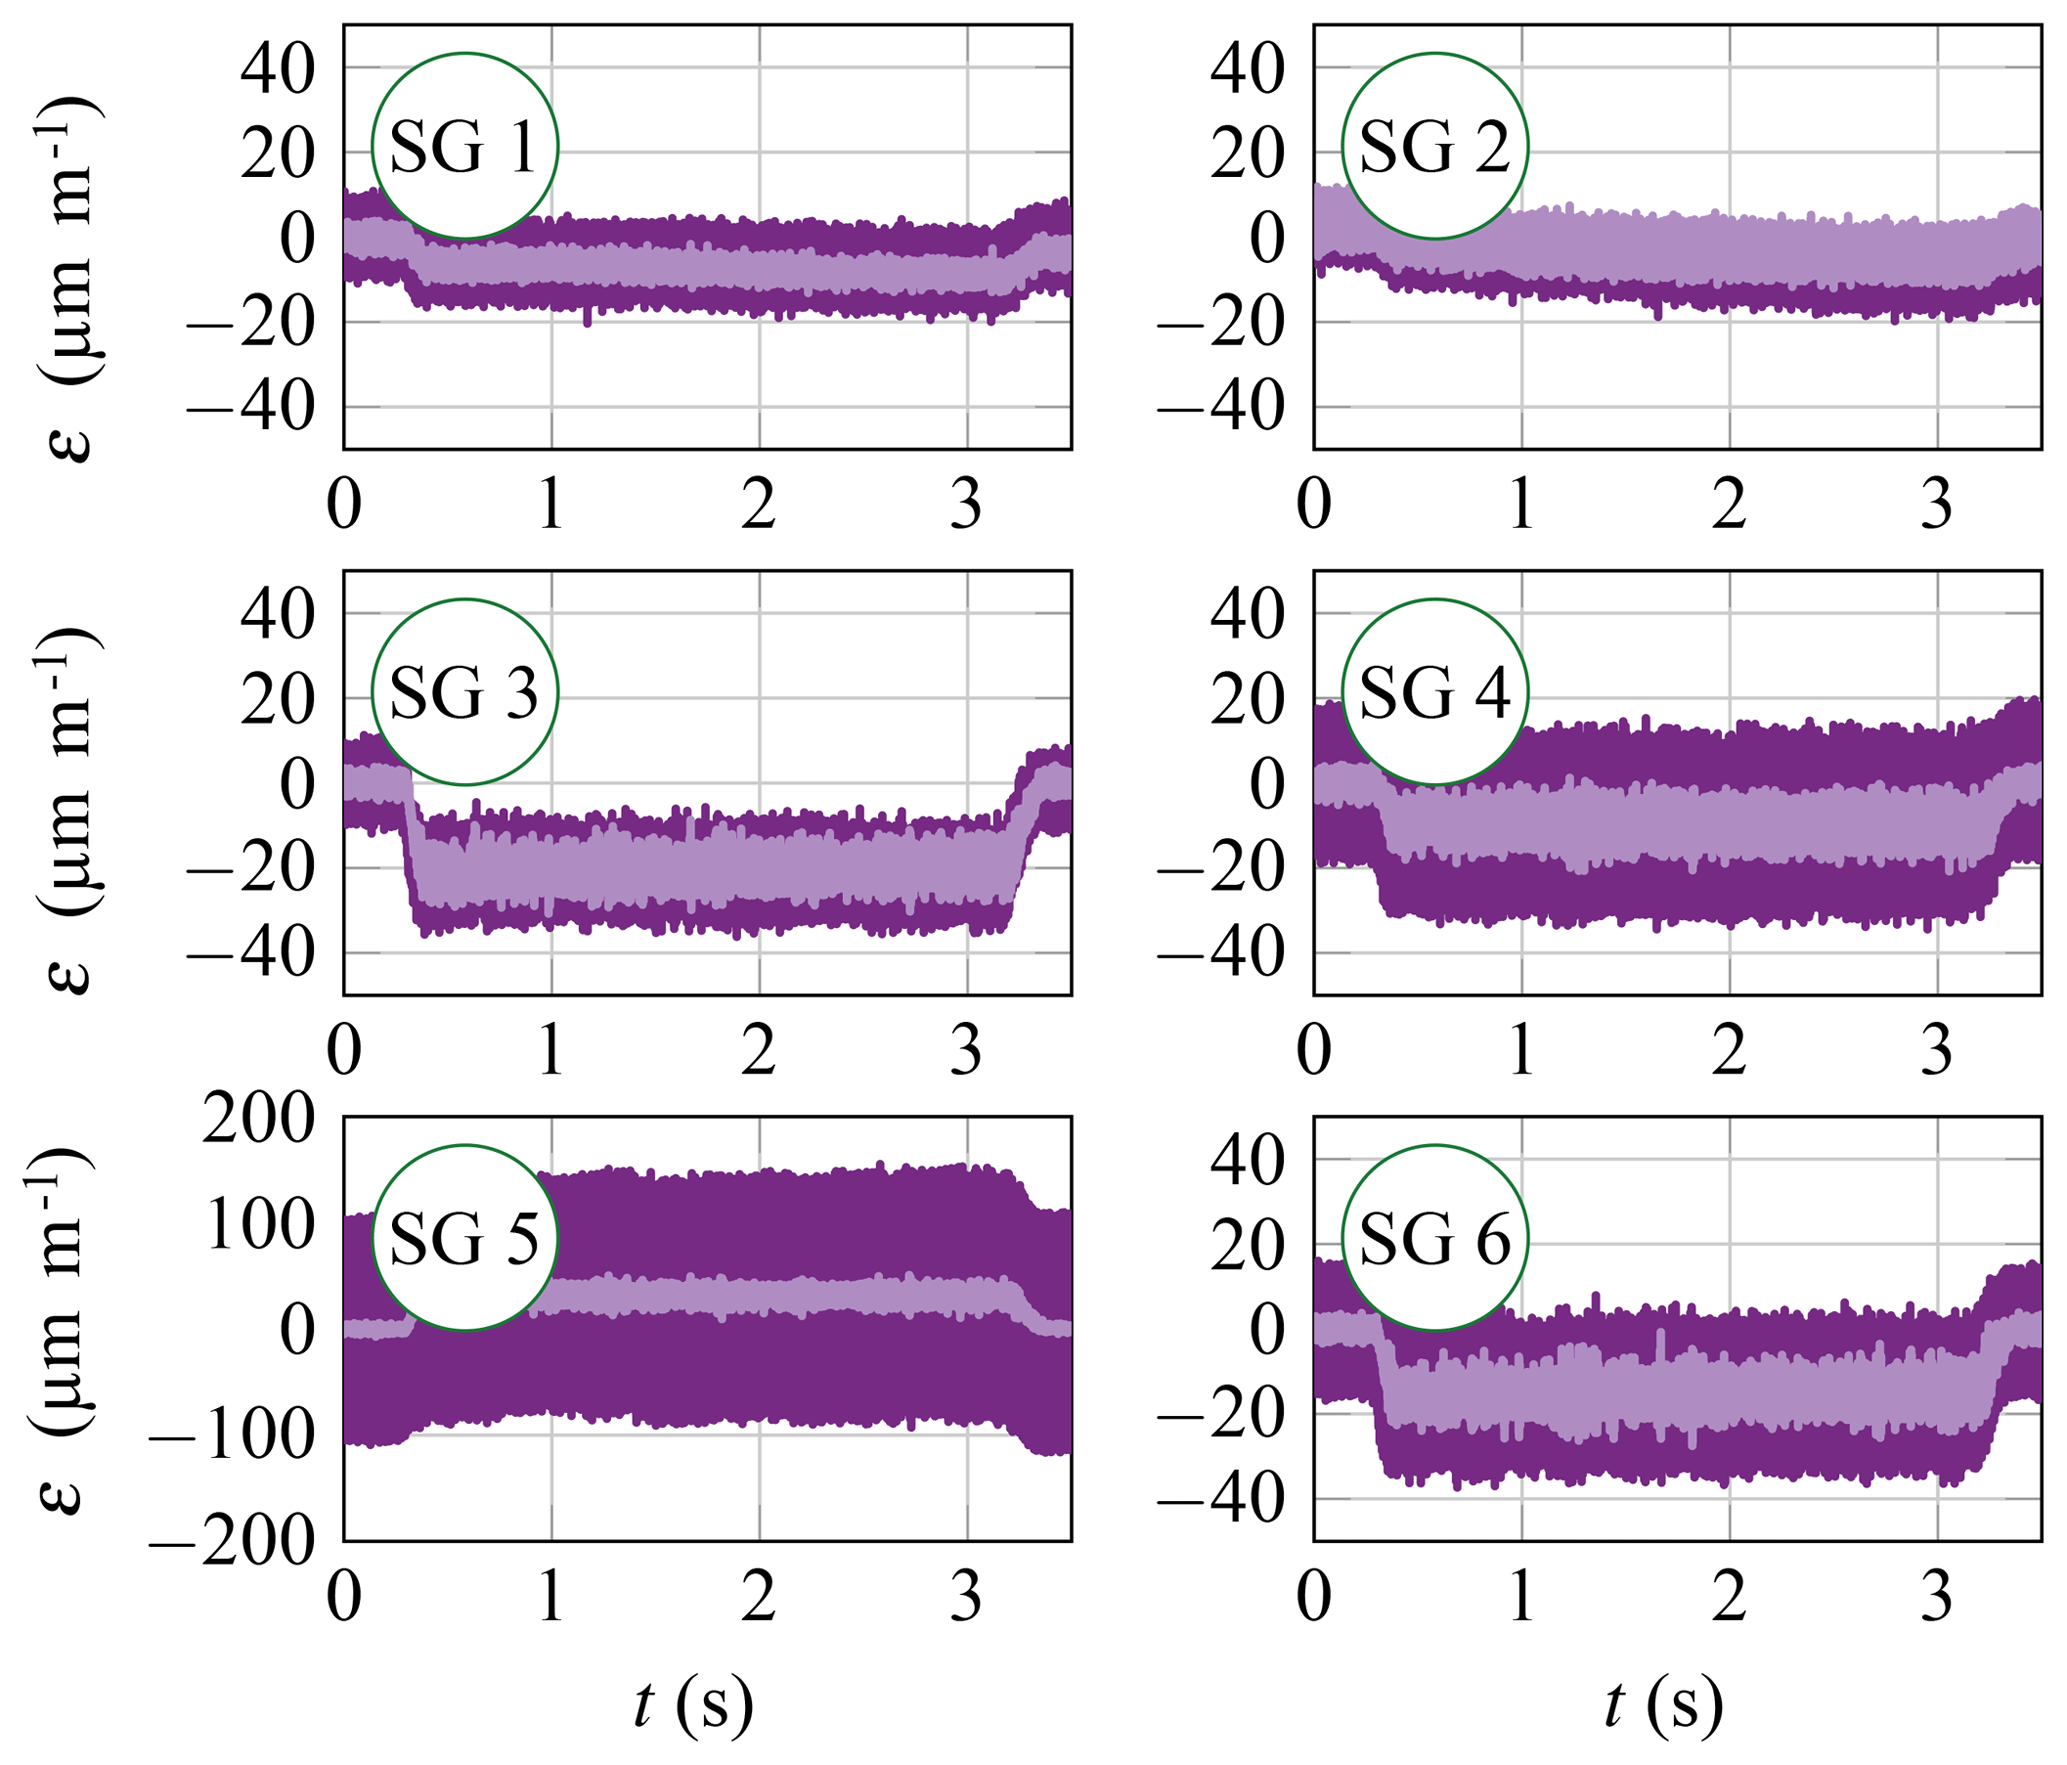
Figure 4Typical results for measured strain (ε) in the sonotrode plotted against time for surface finishing of a sample during processing with (dark violet) and without (light violet) UVA.
2.3 Measurement set-up
The measurement system is based on strain gauges as sensors for the induced strain in the sonotrode. Linear strain gauges with one measuring grid were acquired from HBM. The LY series type 10/350 CLY47-3L-2M strain gauges used have a nominal resistance of 350 Ω. The measurement grid has a length of 10 mm and a width of 5 mm. The material for the strain gauges was chosen carefully to match the thermal expansion coefficient of the sonotrode and to compensate for changes in temperature during operation.
However, due to the short process time, there is no significant build-up of heat in the transducer or the sonotrode. Below 30 ∘C the zero drift of the strain gauges is lower than 2 µm m−1 and, therefore, negligible for the strains that occurred in this study. If the temperature of the sonotrode exceeds 40 ∘C, one should take the increasing zero drift specified by the manufacturer into account.
The strain gauges were attached to the sonotrode using Z70 cold curing super glue, which was also acquired from HBM. The positioning of the strain gauges was chosen after considering multiple objectives. The main objective was to measure strain at a sufficient signal-noise-ratio without defects due to overly high strains. Therefore, strain gauges were placed at positions of high expected strain. Furthermore, the detection of bending due to cutting forces was intended. For this reason, strain gauges were distributed around the circumference of the sonotrode. To gather information on the current mode shape, an axial distribution of measurement positions was realized. Figure 3 illustrates the ultrasonic vibration-assisted system employed and shows the positions of the six strain gauges on the surface of the sonotrode. The flange and the mounting of the cutting tool limit the positioning of strain gauges, but, in principle, all objectives were considered.
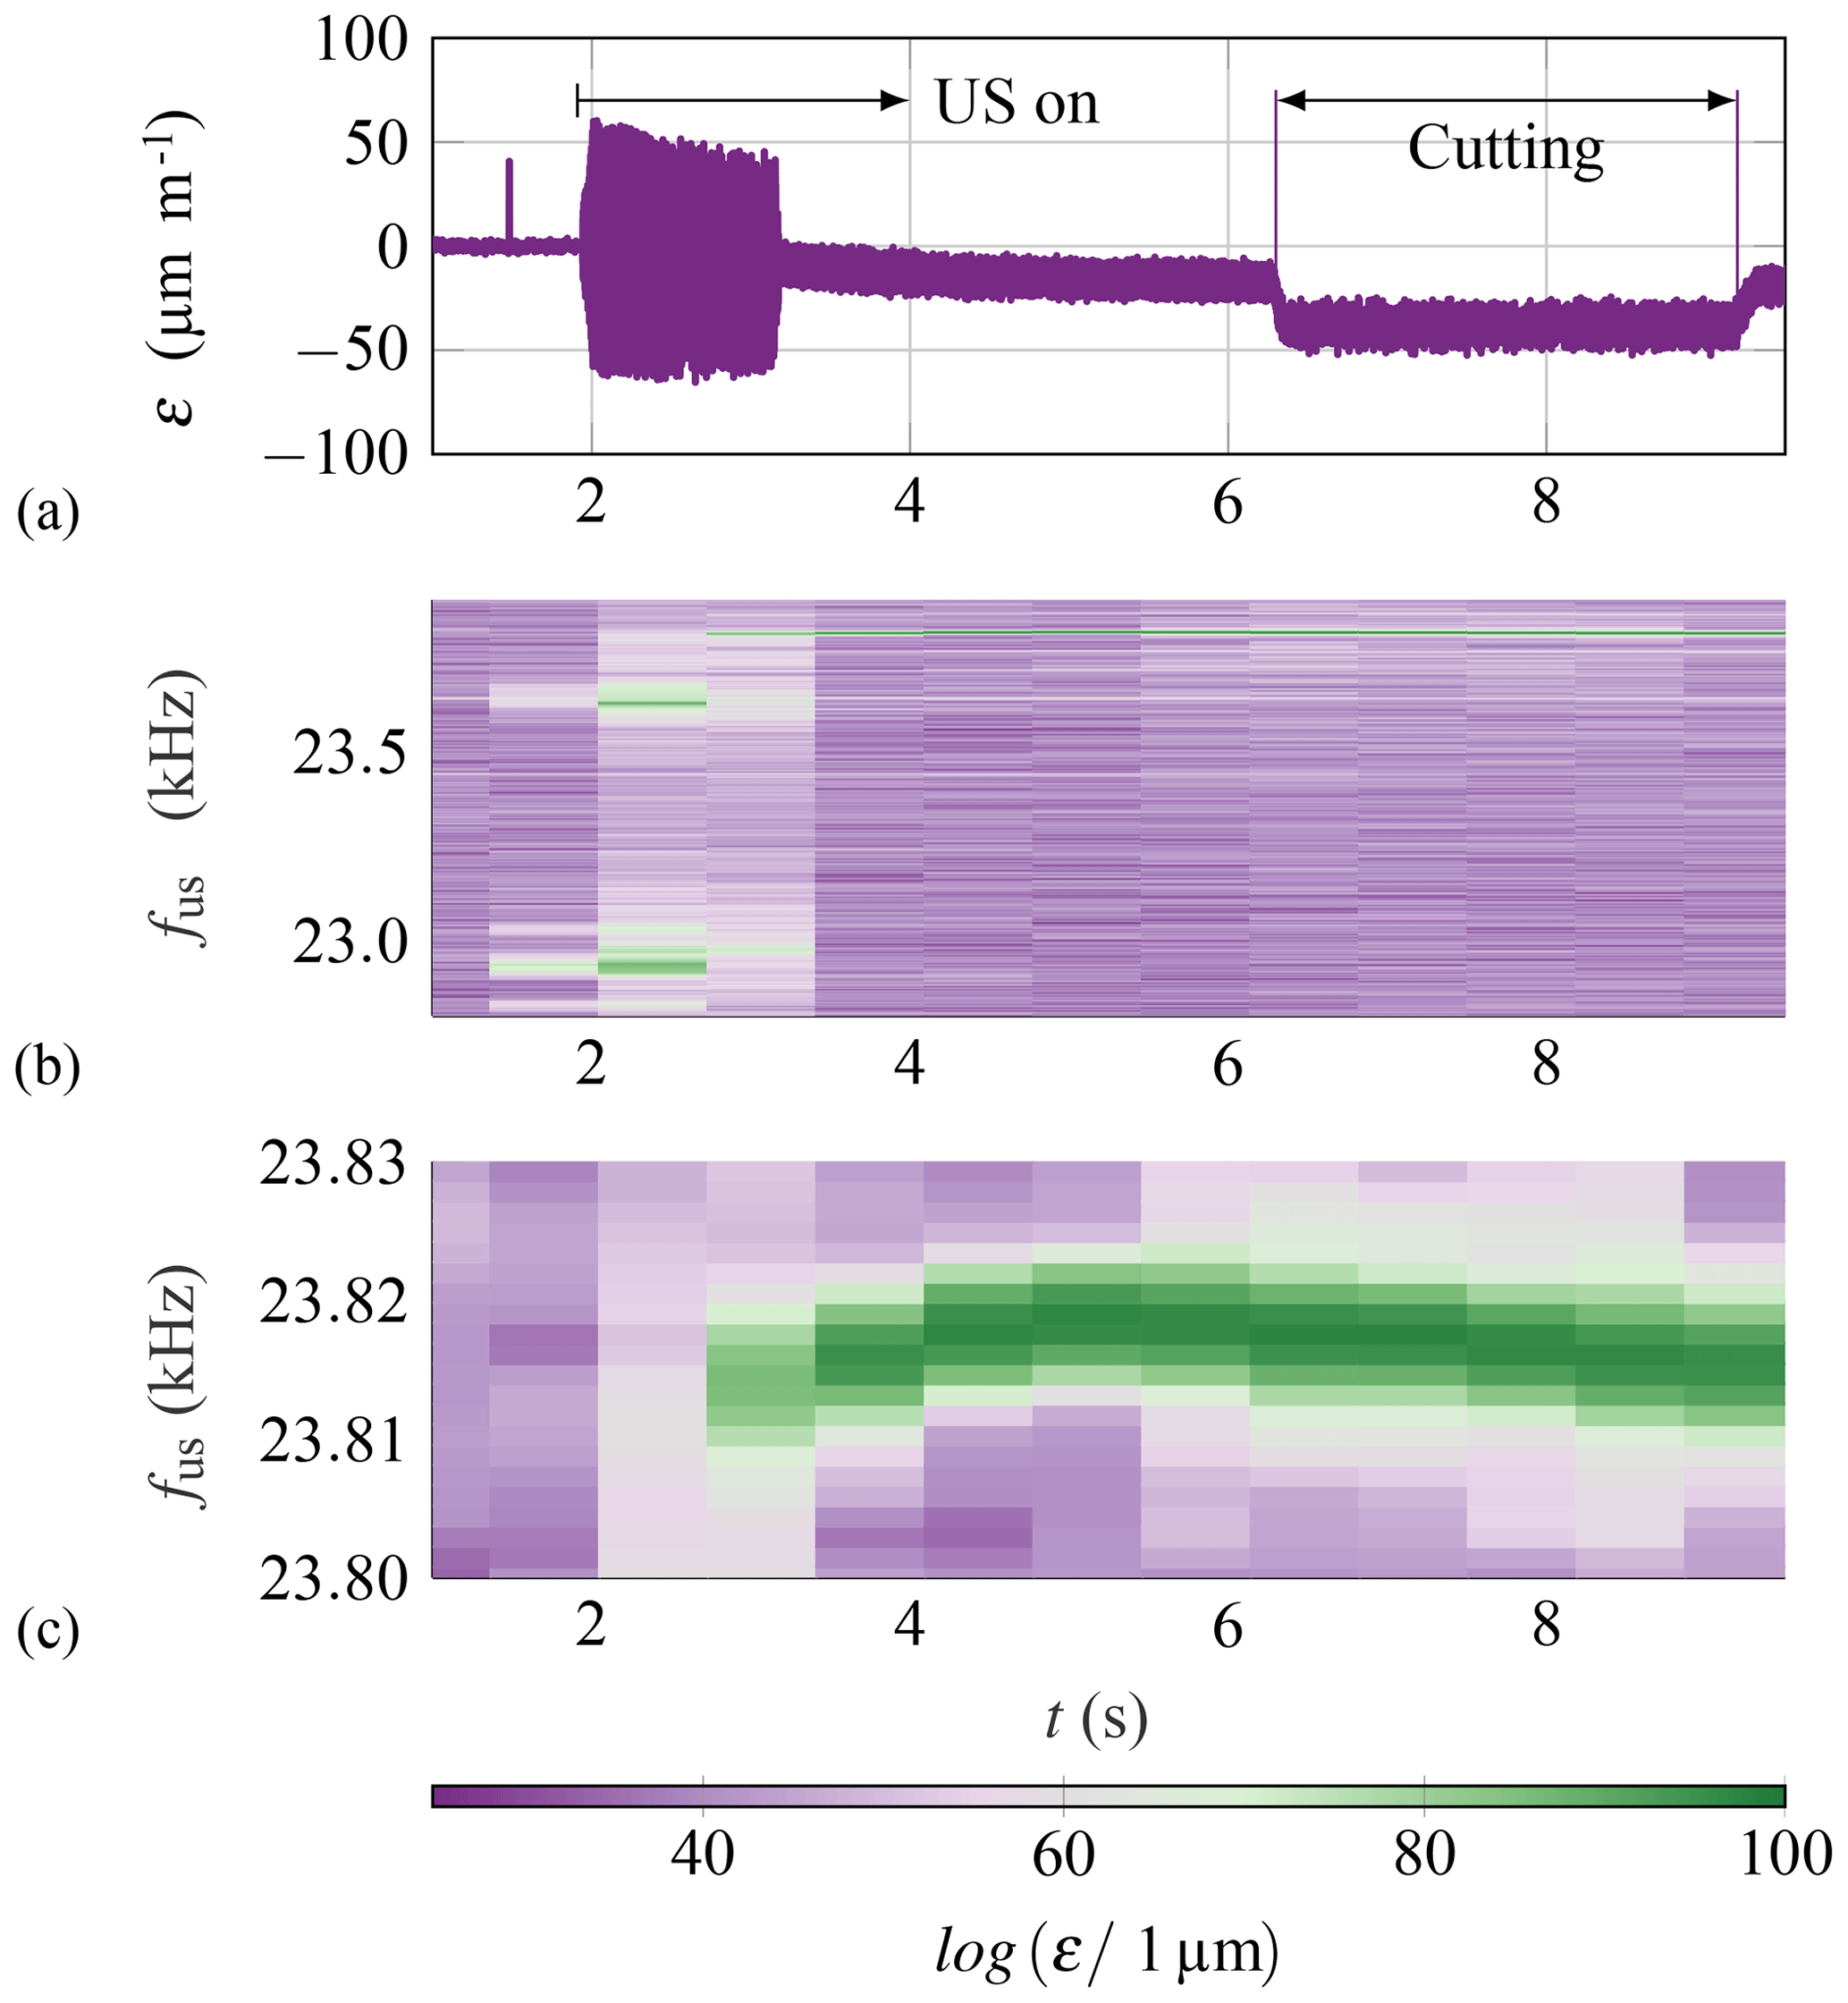
Figure 5The strain (ε) detected by SG 3 (a) of the sample processed using UVA, the resulting FFT (b) and a magnification at the frequency range from 23.8 to 23.83 kHz (c).
Strain gauges (SG) 1 and 2 are offset by 120∘. SG 3, SG 4 and SG 5 also are separated by an angle of 120∘. SG 1, SG 2, SG 4, SG 5 and SG 6 are displayed in white with dashed frames in Fig. 3, which represents their positions on the other side of the sonotrode. Due to the axial dimensions of the strain gauges, the measured strain has to be interpreted as an average of the strain in this area.
In addition to the signal from the strain gauges, the signal from the sensor disc, used within the generator, was recorded via an analogue output from the generator.
Finally, the finished surfaces were examined with a laser scanning microscope, and a 3-D scanning vibrometer was used to analyse mode shapes outside of the turning process.
In this section, the results of the in-process measurements of one chosen sample from the three machined samples that underwent 1D-UVA turning are evaluated. The other two samples showed nearly the same behaviour. Moreover, the microscopic records of the chosen sample are evaluated and compared with the sample that was machined without UVA.
To examine the influence of UVA, the finishing process was carried out once without UVA. Figure 4 shows the results of the six strain gauges during finishing with and without UVA.
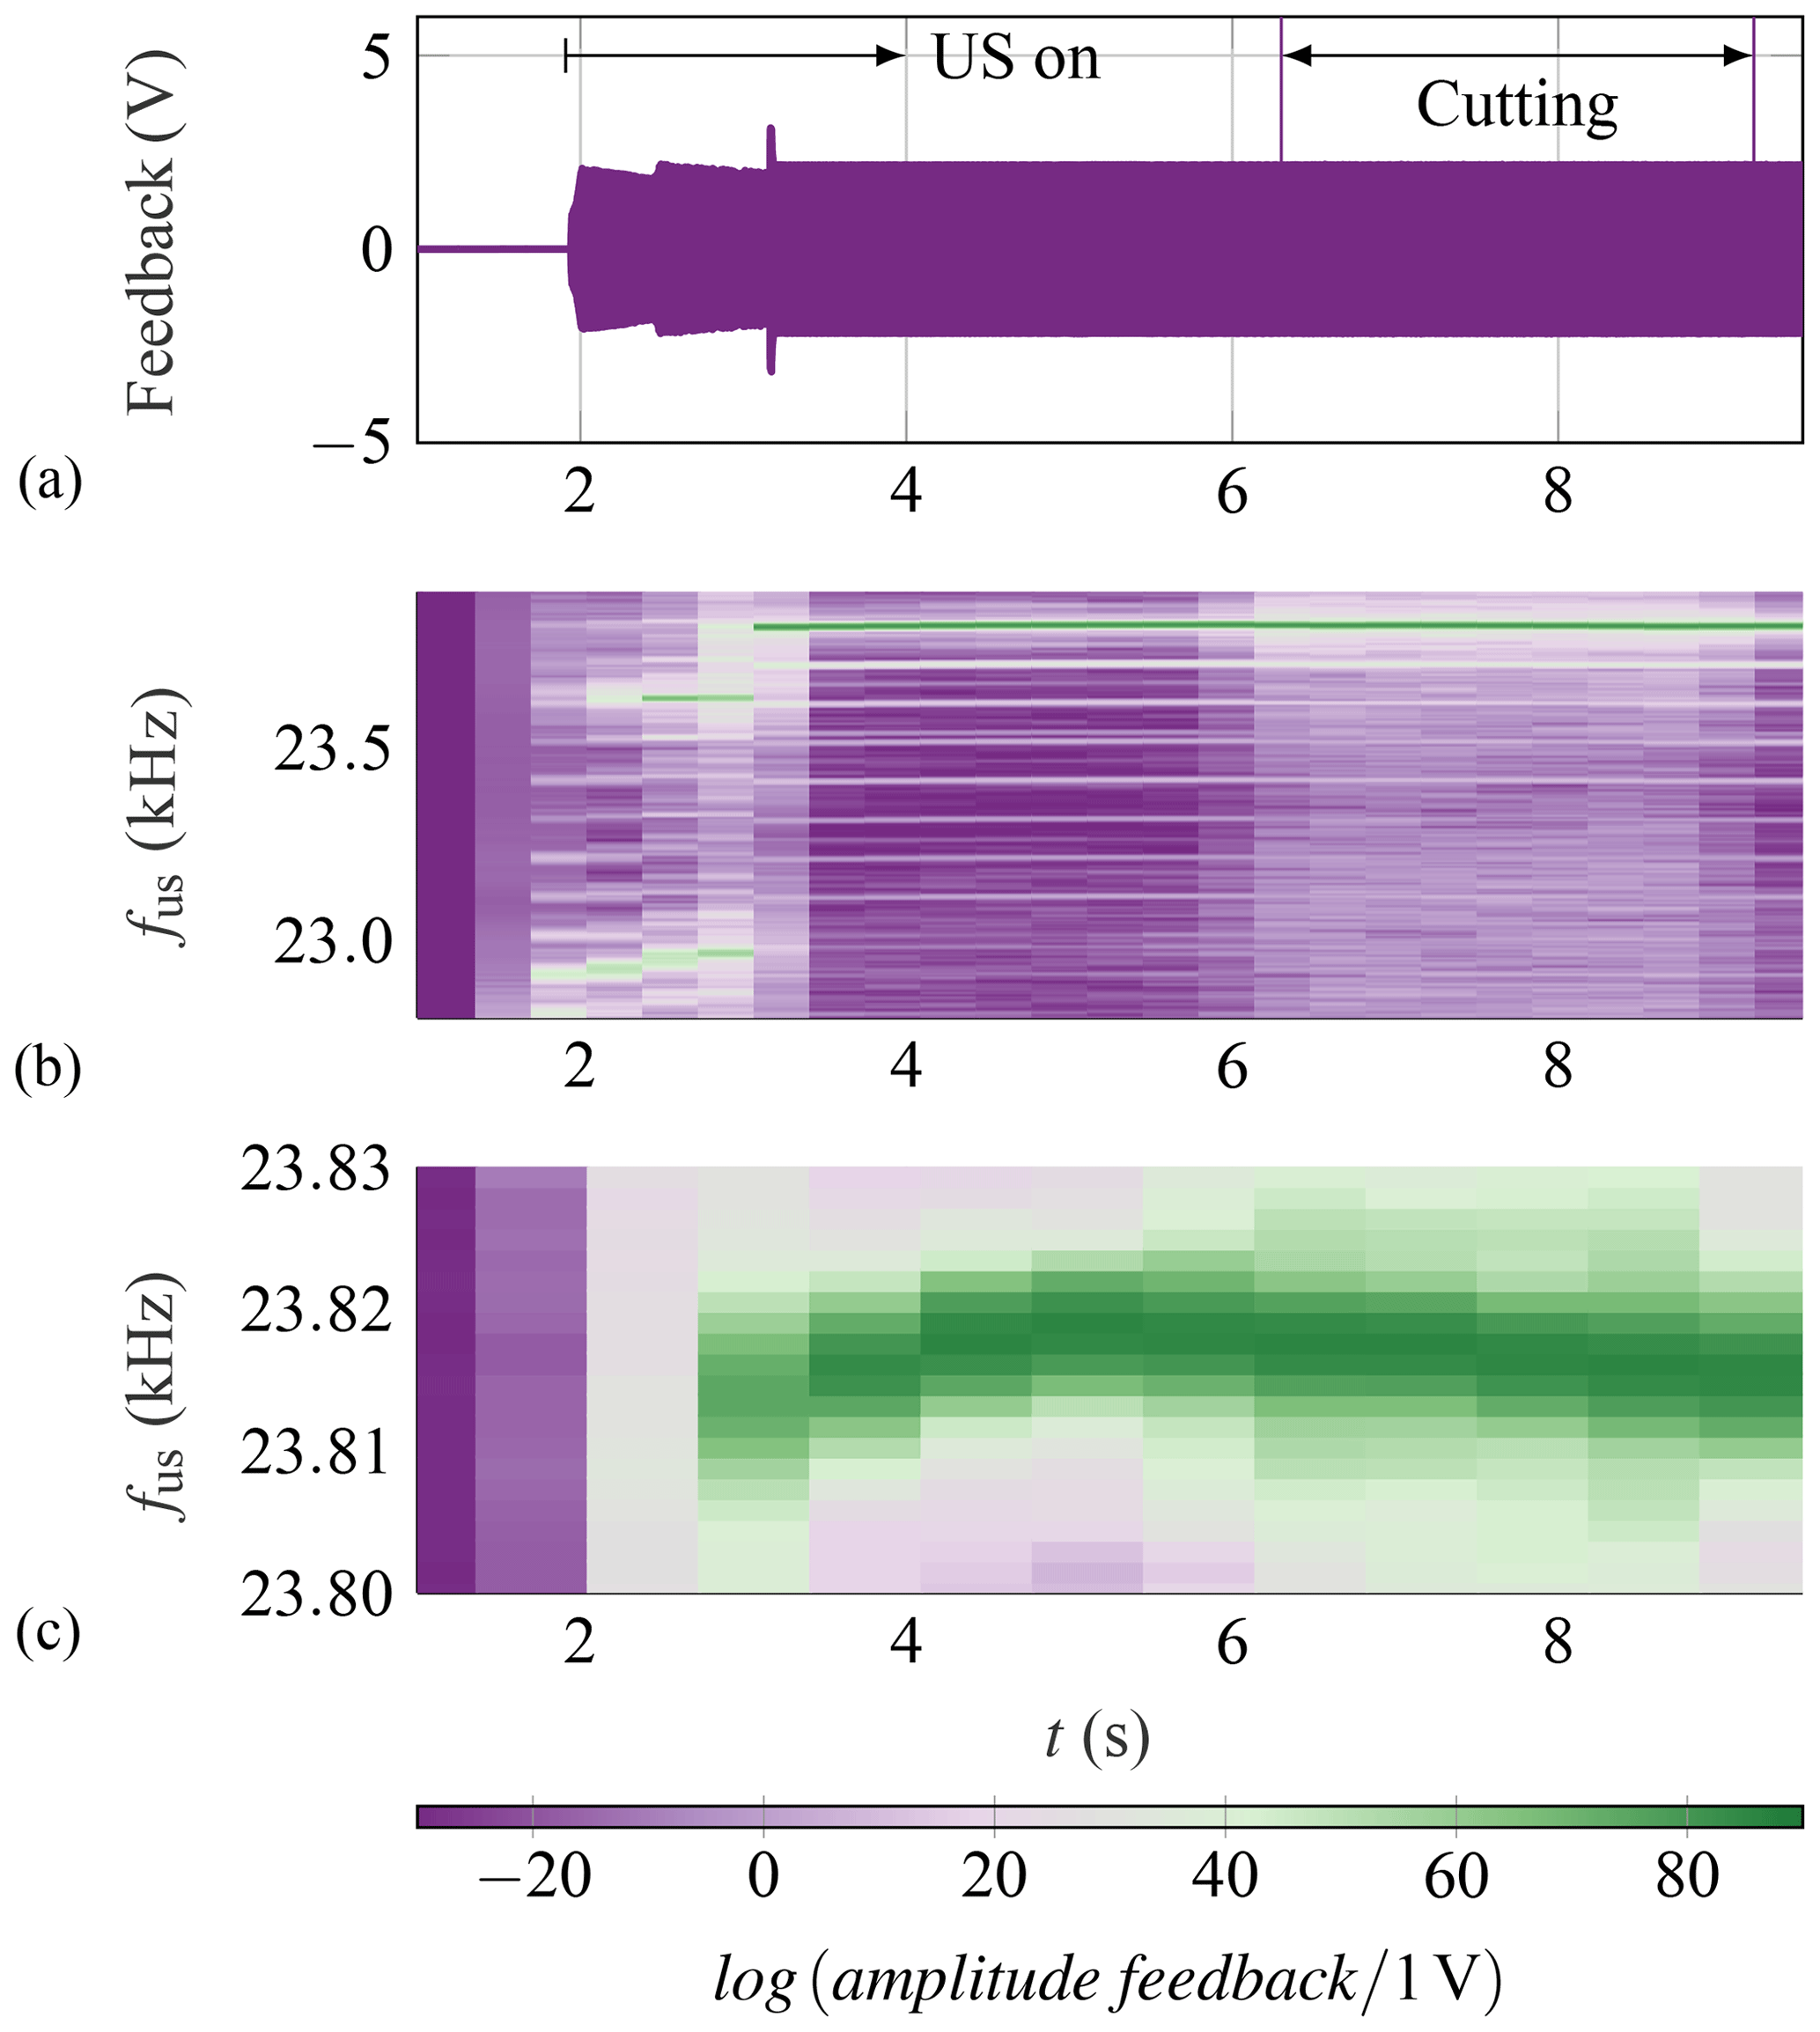
Figure 6The feedback signal of the transducer (a), the resulting FFT (b) and a magnification at the frequency range from 23.8 to 23.83 kHz (c).
Beginning at approximately 0.3 s, all strain gauges show an offset in the measured vibrations that ends at about 3.2 s. This range marks the period of time when the cutting edge is in contact with the sample. Three observations can be made:
-
The offset is in the negative strain (compression) direction for five of the strain gauges. SG 5 shows a positive strain (extension). This indicates a bending of the sonotrode due to cutting forces. A change in the amount of this offset could be qualitatively interpreted as a change in the amplitude and/or direction of the resultant process forces.
-
The amplitude of oscillating strain around the mean value with UVA is higher than without for most strain gauges, as was to be expected. The amplitude also varies for different strain gauges, which was predictable due to the simulated distribution of strain in the mode shape used. However, this cannot explain the large differences between SG 3, SG 4 and SG 5. These differences suggest the superposition of a second mode shape, which is probably a bending mode.
-
The signal of SG 2 shows no significant difference with and without UVA as well as a very low amplitude and a drift over the measurement period. This might hint at insufficient electrical bonding and the influence of temperature; it also calls the validity of this strain gauge into question.
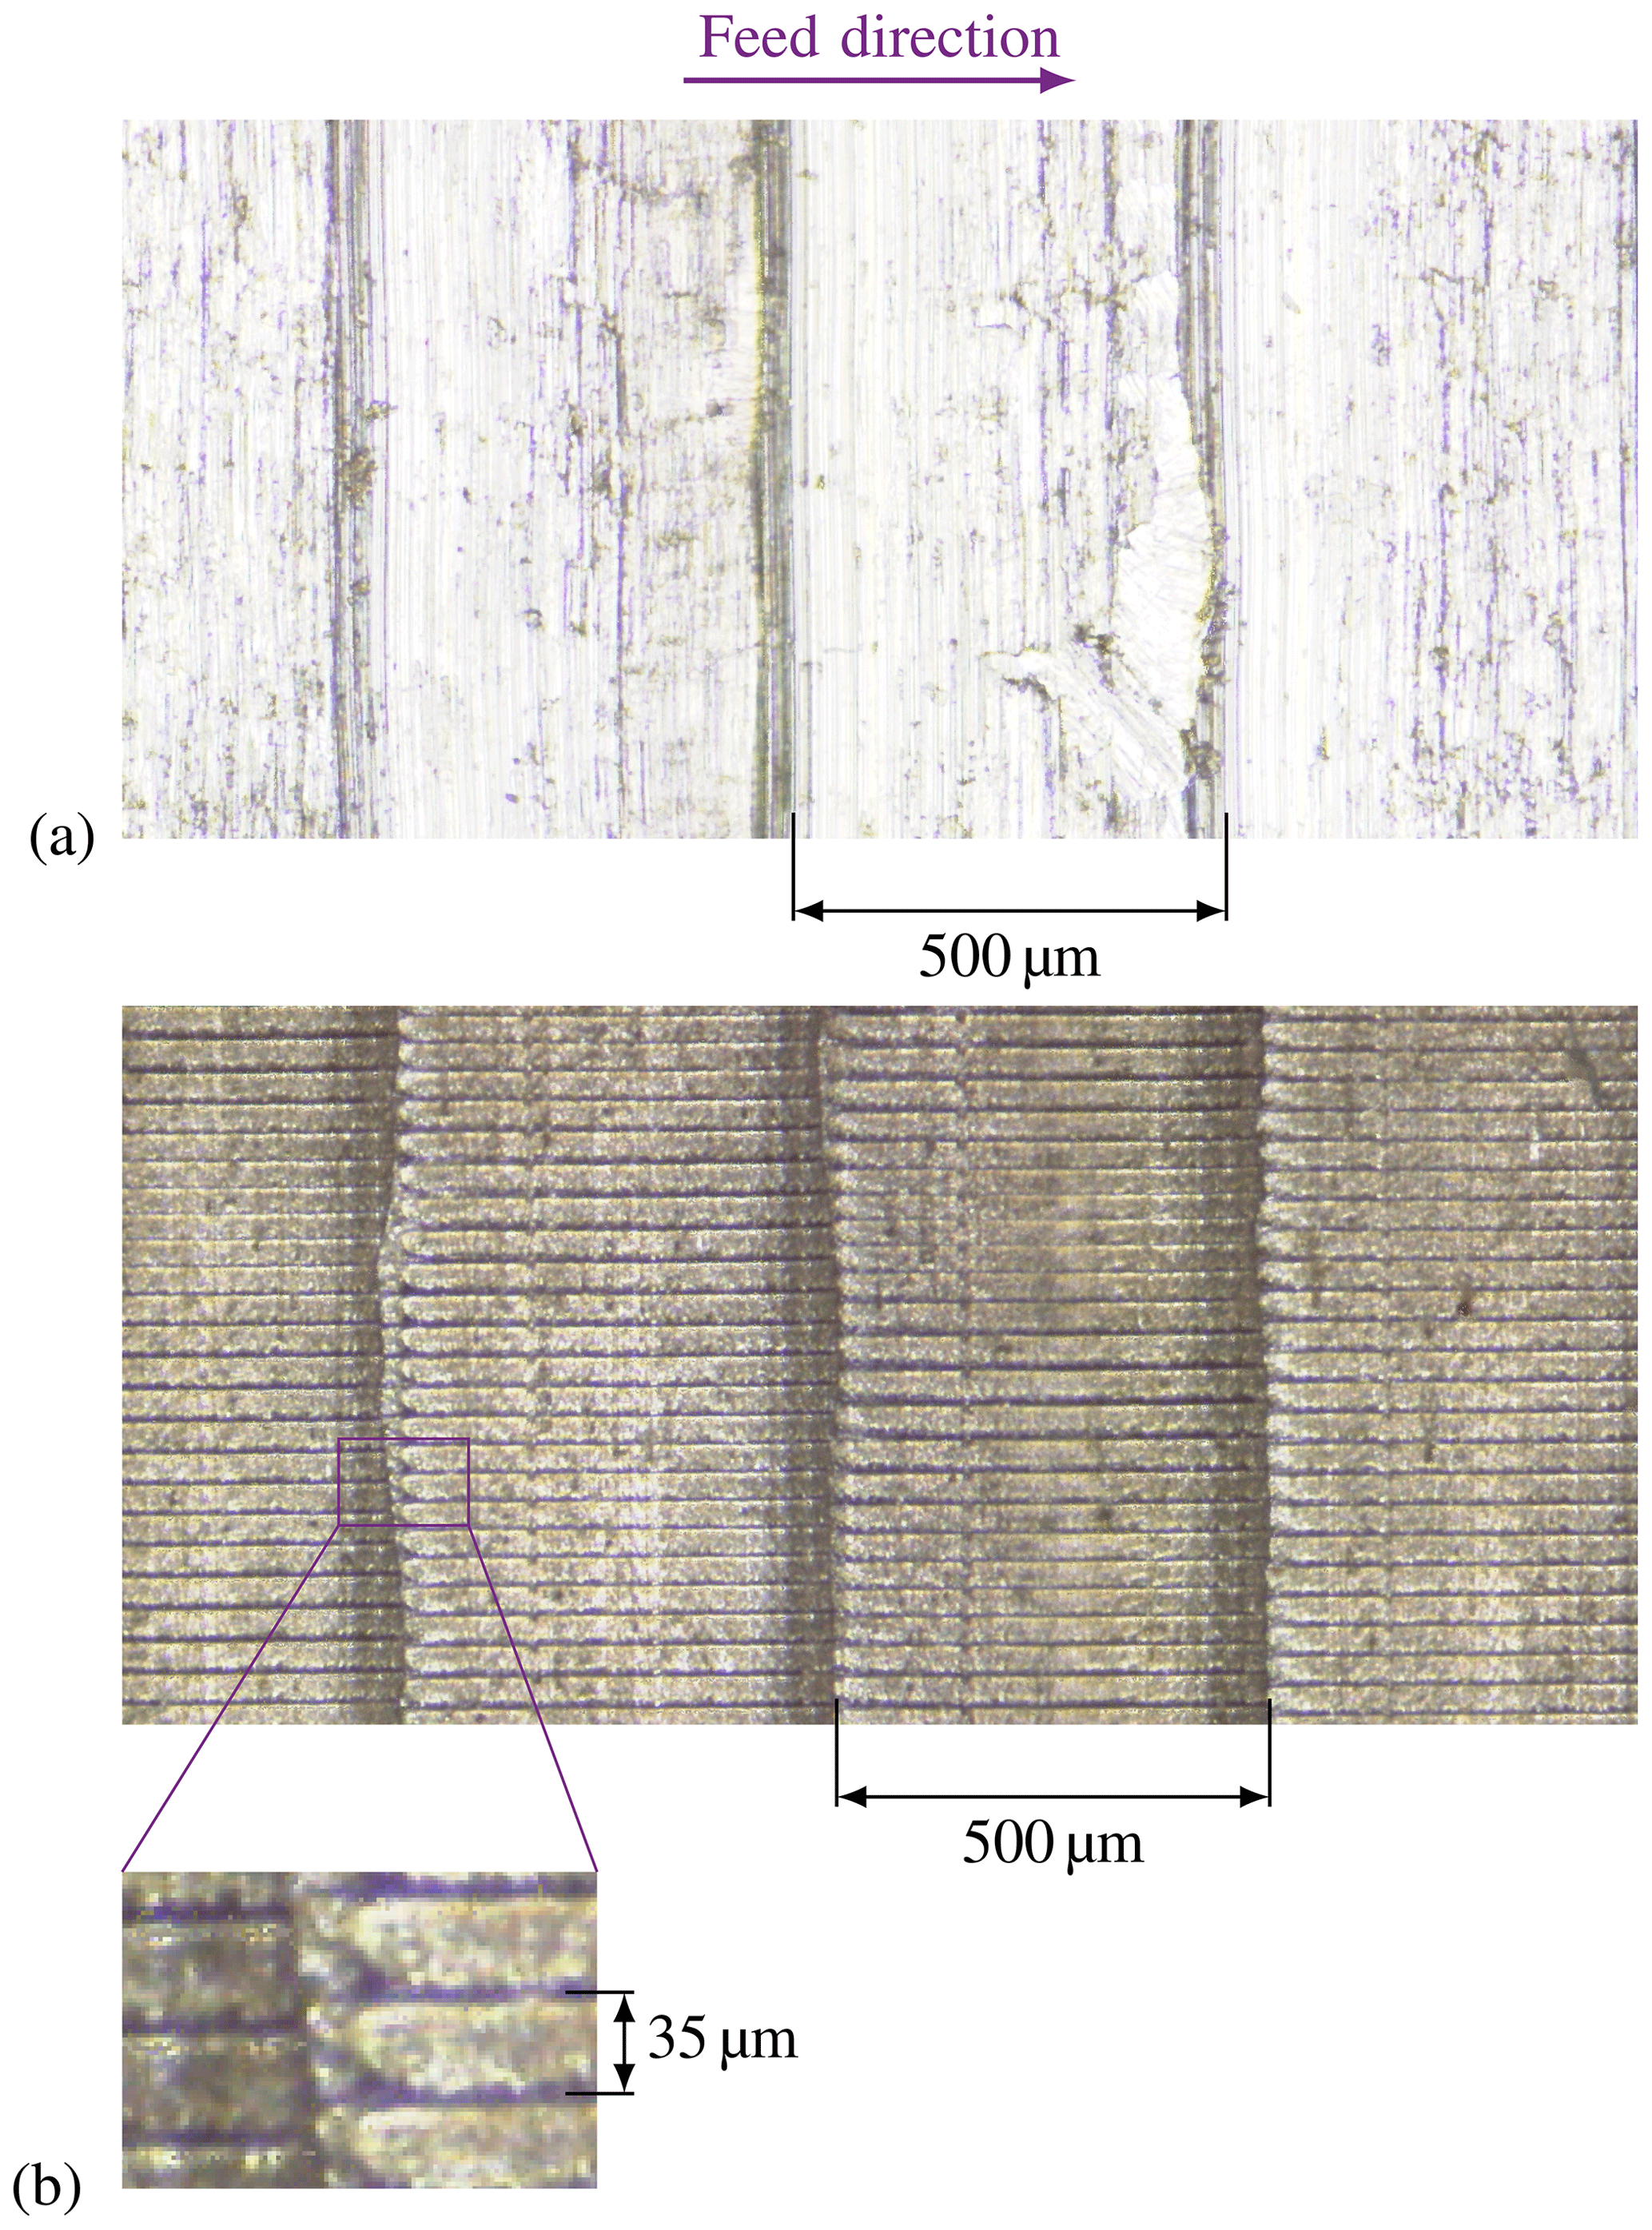
Figure 7Resulting surface topographies from turning without (a) and with (b) ultrasonic vibration assistance.
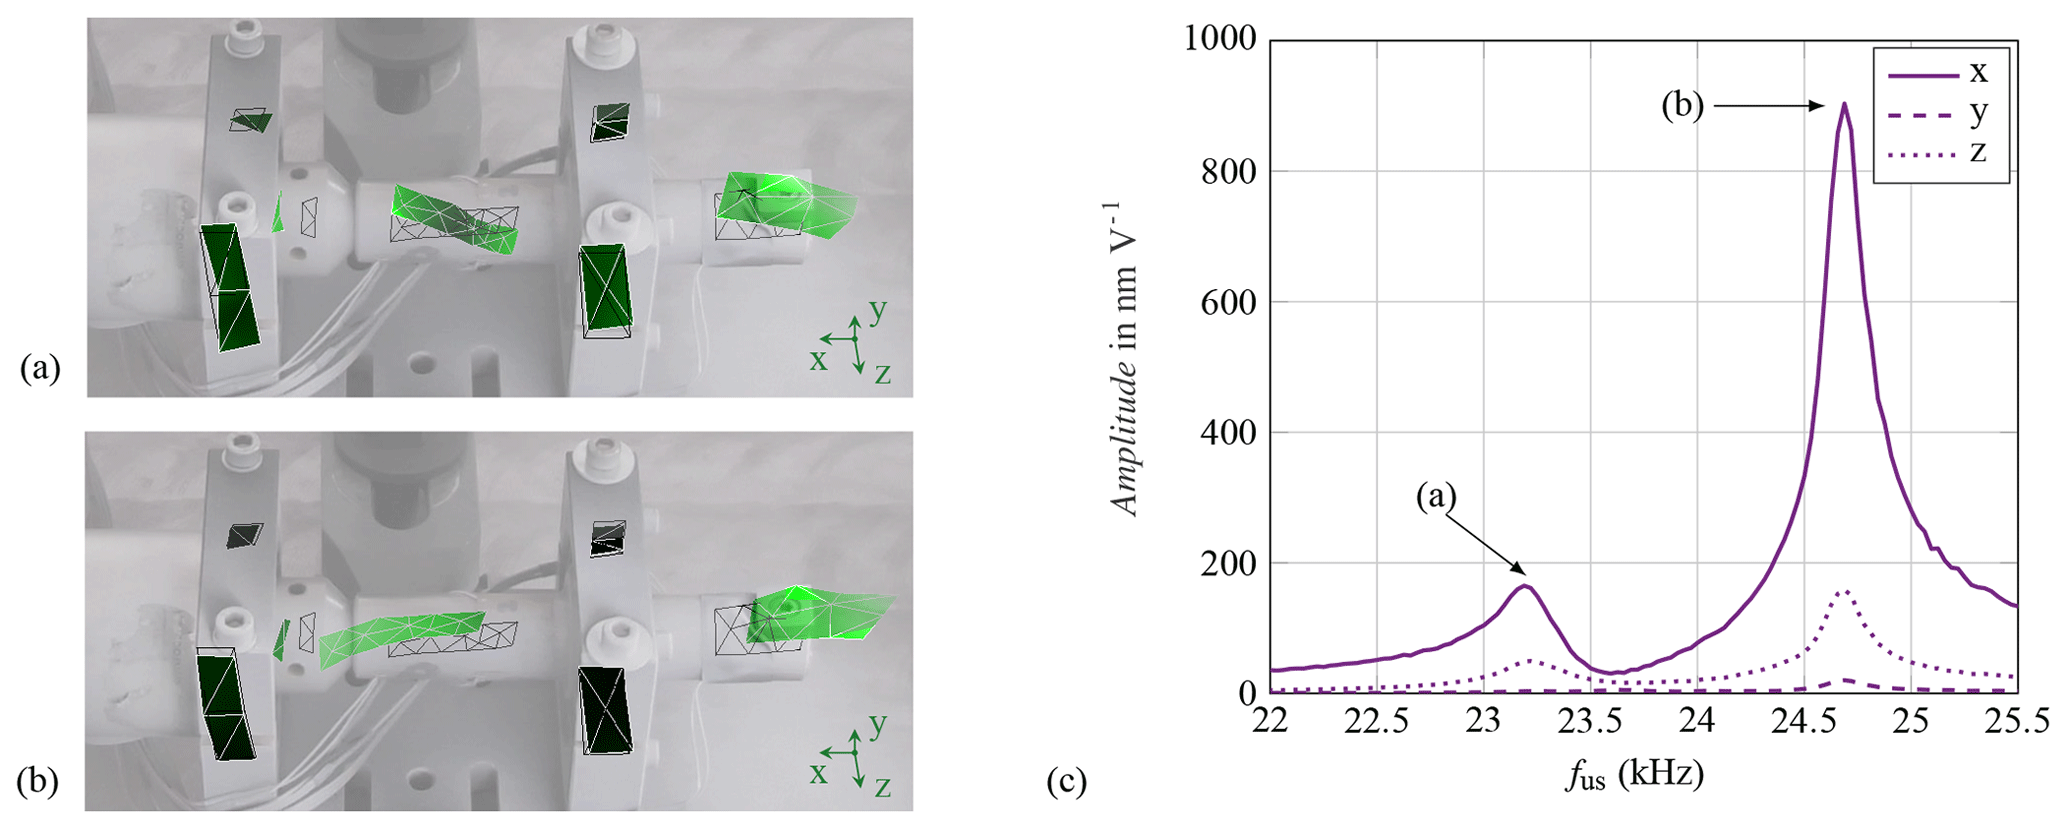
Figure 8Measured mode shapes for two resonant frequencies: the bending mode at 23.2 kHz (a) and the longitudinal mode at 24.7 kHz (b). The corresponding transfer function in three spatial directions (c).
While Fig. 4 shows an extract of the measurement, the complete measurement also included the activation of the transducer and the following adjustment of frequency according to the internally defined target, which is based on the internal sensor. As an example of measurement with UVA, Fig. 5 shows the results of SG 3.
In Fig. 5a different phases are identifiable. The first phase lasts for approximately 2 s. Here, the ultrasonic generator is still switched off and the strain is very small. The second phase represents the activation of the ultrasonic (US) generator, and a large rise in the strain is observed in all strain gauges. Afterwards, the strain decreases. This decrease is accompanied by a change in the operating frequency, as can be seen in Fig. 5b from results in the frequency domain. Fast Fourier transform (FFT) was used to analyse the signals detected by the strain gauges. Here, a spectrogram of the measured strain is shown in the range from 22.8 to 23.9 kHz. A possible reason for this behaviour is that the feedback system of the US generator is trying to adjust the exciting frequency of the system at the beginning of US activation. A third phase is the free vibration of the sonotrode, in which the tool is not yet engaged in cutting. This phase is directly before the tool engagement and the start of the cutting process. The last phase is the processing phase, during which the tool is engaged with the sample.
Figure 5c shows a “zoom-in” of a specific frequency range to visualize small changes in frequency during the cutting process. An operational frequency of 23.8 kHz is achieved and shifts slightly within a range of approximately 10 Hz.
In addition to the close-to-process strain measurements, the internal feedback signal of the transducer was also recorded. Figure 6 shows a depiction analogous to Fig. 5.
Here, the first phases, the activation of the actuator and the adjustment of frequency, can also be identified. In contrast to SG 3, no major drop in amplitude is recognizable during the adjustment of frequency in free vibration. Rather, it seems that the determined frequency of 23.8 kHz results in larger amplitudes than at 23.0 kHz. This is contrary to the results from SG 3. Furthermore, the feedback signal does not allow for the identification of the cutting phase in the time domain. In the frequency domain more broadband frequency components are recognizable.
In addition to the in-process measurements, surface structures of the samples were analysed using a laser scanning microscope. Figure 7 shows details of surfaces generated without UVA (panel a) and with UVA (panel b). Both surfaces exhibit feed marks with a distance of 500 µm running in the circumferential direction. In addition, for the sample machined with UVA there are nearly parallel and equally spaced marks aligned in the feed direction with a pitch dus of approximately 35 µm.
Using Eq. (1), the operating US vibration frequency fus can be calculated. For a cutting speed vc of 50 m min−1 it results in 23.81 kHz:
This confirms the extracted operational frequency using FFT analysis of the measured values by strain gauges as well as from the feedback signal. This also emphasizes that the suggested measurement set-up can be used for in-process frequency estimation.
To explain the mismatch in changes in the measured amplitude corresponding to the change in operating frequency, a detailed analysis of the vibrational behaviour of the whole system was subsequently carried out using a 3-D scanning vibrometer. The actuator was excited by a swept sine wave in the frequency range from 20 to 30 kHz to identify the natural frequencies and the associated mode shapes. Figure 8a and b show two mode shapes related to the natural frequencies close to the operational frequency used in the turning process. The mode in Fig. 8a can be described as a bending mode. The measuring fields near the tool (on the right side of the picture) and between the flanges are tilted in comparison with the initial state. However, the second mode shows the intended longitudinal expansion in the axial direction of the sonotrode.
The magnitude of the transfer function shown in Fig. 8c displays the amplitude at the cutting tool in the three spatial directions depending on generator voltage. For both modes the vibration in the axial direction of the sonotrode (x direction; see Fig. 3) is dominant. Nevertheless, especially for the bending mode at 23.2 kHz, the vibration in the z direction is non-negligible. The operational frequency of 23.8 kHz during turning was located between both modes. This provides the following explanations for the strain measurements:
-
The different amplitudes of SG 3, SG 4 and SG 5 can be explained by the superimposed bending mode.
-
The bending mode was limited on the sonotrode. Therefore, the sensor inside the actuator was not affected, and the system switched to a frequency with lower amplitude than immediately after activation of the US generator.
-
The implemented control algorithm integrated in the US actuator did not result in an oscillation close to the intended mode.
An in-process measurement set-up based on strain gauges is proposed and implemented on a sonotrode in ultrasonic vibration-assisted turning. Samples are machined and investigated. The results show the additional value of the proposed set-up to characterize the ultrasonic system in comparison with the implemented internal sensor signal of the generator. The induced strains in the sonotrode are measured and clearly show visible differences regarding real existing amplitudes. Furthermore, multiple measurement positions on the sonotrode might enable estimations of cutting forces and current mode shape. Therefore, the set-up could possibly be used as a feedback system to be integrated into a closed-loop control of the ultrasonic vibration-assisted turning. It is, however, necessary to carry out further investigations regarding the size and positioning of the strain gauges, thermal influences, mode shape detection, electrical bonding and mechanical connection to ensure operation under industrial conditions. Nevertheless, the usage of close-to-process feedback recordings seems promising with respect to developing an optimized control system for UVA machining.
The underlying measurement data are not publicly available and can be requested from the authors if required.
JMW was responsible for the measurement set-up and simulation under the supervision of NH and CT. SK contributed to the analysis of the results regarding the time and the frequency domain. NH and SK wrote the paper, and CT, AN and WGD contributed with substantial revisions.
The authors declare that they have no conflict of interest.
The authors would like to thank Christian Thorandt for his support on vibration measurement.
This paper was edited by Ulrich Schmid and reviewed by two anonymous referees.
Arnold, F. and Mühlen, S.: The resonance frequencies on mechanically pre-stressed ultrasonic piezotransducers, Ultrasonics, 39, 1–5, https://doi.org/10.1016/S0041-624X(00)00047-0, 2001. a
Babitsky, V. I., Astashev, V. K., and Kalashnikov, A. N.: Autoresonant control of nonlinear mode in ultrasonic transducer for machining applications, Ultrasonics, 42, 29–35, https://doi.org/10.1016/j.ultras.2004.01.004, 2004. a
Brehl, D. E. and Dow, T. A.: Review of vibration-assisted machining, Precis. Eng., 32, 153–172, https://doi.org/10.1016/j.precisioneng.2007.08.003, 2008. a, b
Gallego-Juárez, J. A. and Graff, K. F. (Eds.): Power ultrasonics: Applications of high-intensity ultrasound, in: Woodhead publishing series in electronic and optical materials, vol. 66, Elsevier/WP Woodhead Publ, Amsterdam, 2015. a, b
Huang, Y. M., Wu, Y. S., and Huang, J. Y.: The influence of ultrasonic vibration-assisted micro-deep drawing process, Int. J. Adv. Manuf. Tech., 71, 1455–1461, https://doi.org/10.1007/s00170-013-5553-1, 2014. a
Khatri, B. C., Rathod, P., and Valaki, J. B.: Ultrasonic vibration-assisted electric discharge machining: A research review, P. I. Mech. Eng. B-J. Eng., 230, 319–330, https://doi.org/10.1177/0954405415573061, 2016. a
Kumar, S., Wu, C. S., Padhy, G. K., and Ding, W.: Application of ultrasonic vibrations in welding and metal processing: A status review, J. Manuf. Process., 26, 295–322, https://doi.org/10.1016/j.jmapro.2017.02.027, 2017. a
Li, E., He, Z. C., Chen, L., Li, B., Xu, X., and Liu, G. R.: An ultra-accurate hybrid smoothed finite element method for piezoelectric problem, Eng. Anal. Bound. Ele., 50, 188–197, https://doi.org/10.1016/j.enganabound.2014.08.005, 2015. a
Nestler, A. and Schubert, A.: Surface Properties in Ultrasonic Vibration Assisted Turning of Particle Reinforced Aluminium Matrix Composites, Proc. CIRP, 13, 125–130, https://doi.org/10.1016/j.procir.2014.04.022, 2014. a
Neugebauer, R., Denkena, B., and Wegener, K.: Mechatronic Systems for Machine Tools, CIRP Ann.-Manuf. Techn., 56, 657–686, https://doi.org/10.1016/j.cirp.2007.10.007, 2007. a
Schubert, A., Nestler, A., Pinternagel, S., and Zeidler, H.: Influence of ultrasonic vibration assistance on the surface integrity in turning of the aluminium alloy AA2017, Mat.-wiss. u. Werkstofftech., 42, 658–665, https://doi.org/10.1002/mawe.201100834, 2011. a, b
Voronina, S. and Babitsky, V.: Autoresonant control strategies of loaded ultrasonic transducer for machining applications, J. Sound Vib., 313, 395–417, https://doi.org/10.1016/j.jsv.2007.12.014, 2008. a, b
Yokozawa, H., Twiefel, J., Weinstein, M., and Morita, T.: Dynamic resonant frequency control of ultrasonic transducer for stabilizing resonant state in wide frequency band, Jpn. J. Appl. Phys. 56, 07JE08, https://doi.org/10.7567/JJAP.56.07JE08, 2017. a, b
Zhang, R., Steinert, P., and Schubert, A.: Microstructuring of Surfaces by Two-stage Vibration-assisted Turning, Proc. CIRP, 14, 136–141, https://doi.org/10.1016/j.procir.2014.03.026, 2014. a