the Creative Commons Attribution 4.0 License.
the Creative Commons Attribution 4.0 License.
 | 10 Jan 2019
A validation sensor based on carbon-fiber-reinforced plastic for early activation of automotive occupant restraint systems
Robert Lugner
Ulrich Jumar
Thomas Brandmeier
In the automotive industry, sensors and sensor systems are one of the most important components in upcoming challenges like highly automated and autonomous driving. Forward-looking sensors (radar, lidar and cameras) have the technical capability to already provide important (pre-)crash information, such as the position of contact, relative crash velocity and overlap (width of contact) before the crash occurs. Future safety systems can improve crash mitigation with sophisticated vehicle safety strategies based on this information. One such strategy is an early activation of restraint systems compared with conventional passive safety systems. These integrated safety systems consist of a combination of predictive forward-looking sensors and occupant restraint systems (airbags, belt tensioners, etc.) to provide the best occupant safety in inevitable crash situations. The activation of the restraint systems is the most critical decision process and requires a very robust validation system to avoid false activation. Hence, the information provided by the forward-looking sensor needs to be highly reliable. A validation sensor is required to check the plausibility of crucial information from forward-looking sensors used in integrated safety systems for safe automated and autonomous driving.
This work presents a CFRP-based (carbon-fiber-reinforced plastic) validation sensor working on the principle of change in electrical resistance when a contact occurs. This sensor detects the first contact, gives information on impact position (where the contact occurs) and provides information on the overlap. The aim is to activate the vehicle restraint systems at near T0 (time of first contact). Prototypes of the sensor were manufactured in house and manually and were evaluated. At first, the sensor and its working principle were tested with a pendulum apparatus. In the next stage, the sensor was tested in a real crash test. The comparison of the signals from the CFRP-based sensor with presently used crash sensors in the vehicle highlights its advantages. The crash event can be identified at 0.1 ms after the initial contact. The sensor also provides information on impact position at 1.2 ms and enables a validation of the overlap development. Finally, a possible algorithm for the vehicle safety system using forward-looking sensors with a validation sensor is described.


Predictive safety systems have the potential to deal with European Union aims to halve the road casualties by 2020, compared to the baseline year of 2010, and move close to the vision of zero fatalities from road accidents by 2050. The validation of life-critical information from forward-looking sensors in upcoming integrated safety systems and systems for safe automated and autonomous driving demand a reliable and robust sensor concept. The automotive industry is focusing on powerful forward-looking sensors like radar, lidar, cameras, etc. that are presently used in advanced driver assistance applications like lane assist, automated emergency braking, etc. (Coelingh et al., 2010; Eidehall and Gustafsson, 2004; Eidehall et al., 2007; Rasshofer and Gresser, 2005; Speth et al., 2016; Stein et al., 2003). Many researchers are working on using these sensors not only to predict the later vehicle state (collision can be avoided or collision cannot be avoided) but also to predict the crash parameters like impact position, overlap, crash velocity etc. in the case of an inevitable collision (Coelingh et al., 2010; Dirndorfer, 2015; Eidehall and Gustafsson, 2004; Eidehall et al., 2007). Based on these predicted crash parameters, the thresholds for activating the passive safety systems such as airbags and belt tensioners can be adjusted. Thus, the time gained compared to conventional crash sensors can be used to deploy larger airbags in order to cover the dashboard completely. The design of the airbag system can be less aggressive to provide smoother retention and avoid injuries to the neck and head. This increases the protection of out-of-position occupants (Luo et al., 2017). The early information on the position and overlap of the collision can be used to classify the crashes and their crash severity. In combination with the information about the occupants, it is possible to determine the best restraint strategy for the actual crash scenario.
Theoretically, activating restraint systems based on forward-looking sensors before contact (before T0) is possible. But these sensors face many uncertainties like angular errors, weather influences, ghost objects, reflections, etc. (Chitnis et al., 2017; Hasirlioglu et al., 2016; Rasshofer and Gresser, 2005). Applications critical for safety require the highest Automotive Safety Integration Level (ASIL-D). One approach to achieve ASIL-D is by validating the information from the forward-looking sensors using another sensor, which works on a different physical principle (Weitzel et al., 2014). The validation will also provide the required robustness against the false activation due to the uncertainties of forward-looking sensors. This paper describes a concept of a contact-based validation sensor that gives additional redundancy to activate the passive safety systems with the first contact at T0. In Germany, frontal collision is one of the impact scenarios with the highest percentage of fatalities, at 21.27 % in 2016 (Statistisches Bundesamt, 2016). Therefore, the research work is primarily focused on, but not limited to, frontal collisions.
The significant technological breakthroughs in the research area of automated driving, driver assistance systems and integrated safety systems have strong potential to drastically improve vehicle safety (German Insurance Association, 2014). According to the 2017 Road Safety Statistics, around 25 300 fatalities occur due to road accidents in Europe. This is about 6200 fewer fatalities compared to the statistics in 2010 (European Union, 2018). However, there is only little improvement when compared with the statistics of the previous year (just 2 %). In order to achieve the target of halving the number of road fatalities from 2010 to 2020 and to fulfill the Vision Zero Program, additional efforts and new sensor systems are required.
Present cars are installed with a number of passive safety sensors working on different physical principles for detecting different impact scenarios. Some cars are equipped with only one central sensor, while premium cars are equipped with additional sensors distributed in the proximity of the crash zone. Figure 1 shows a generic architecture with the most common types of sensors used for detecting the crash severity during frontal collisions. Acceleration sensors are typically used to measure the sudden and harsh deceleration of the car caused by the collision.
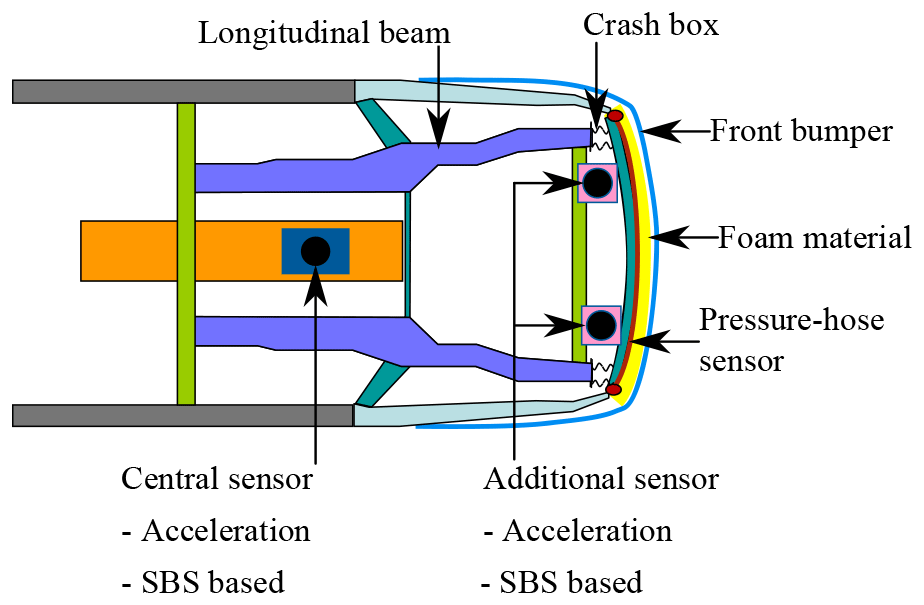
Sensors working on structure-borne sound (SBS) principle are a more recent development, which measures the sound generated by the deformation of the crash management structure transmitted through the car structure. This technology has the advantage of improved distinction between soft and hard crashes, and it is comparatively fast. Some cars are additionally equipped with a pressure-hose sensor for pedestrian protection. This pressure-hose sensor is installed on the rear surface of the energy absorber foam towards the bumper beam side. It consists of a flexible tube with pressure sensors at both ends and is specifically designed for pedestrian protection in low-impact energy and lower-speed scenarios.
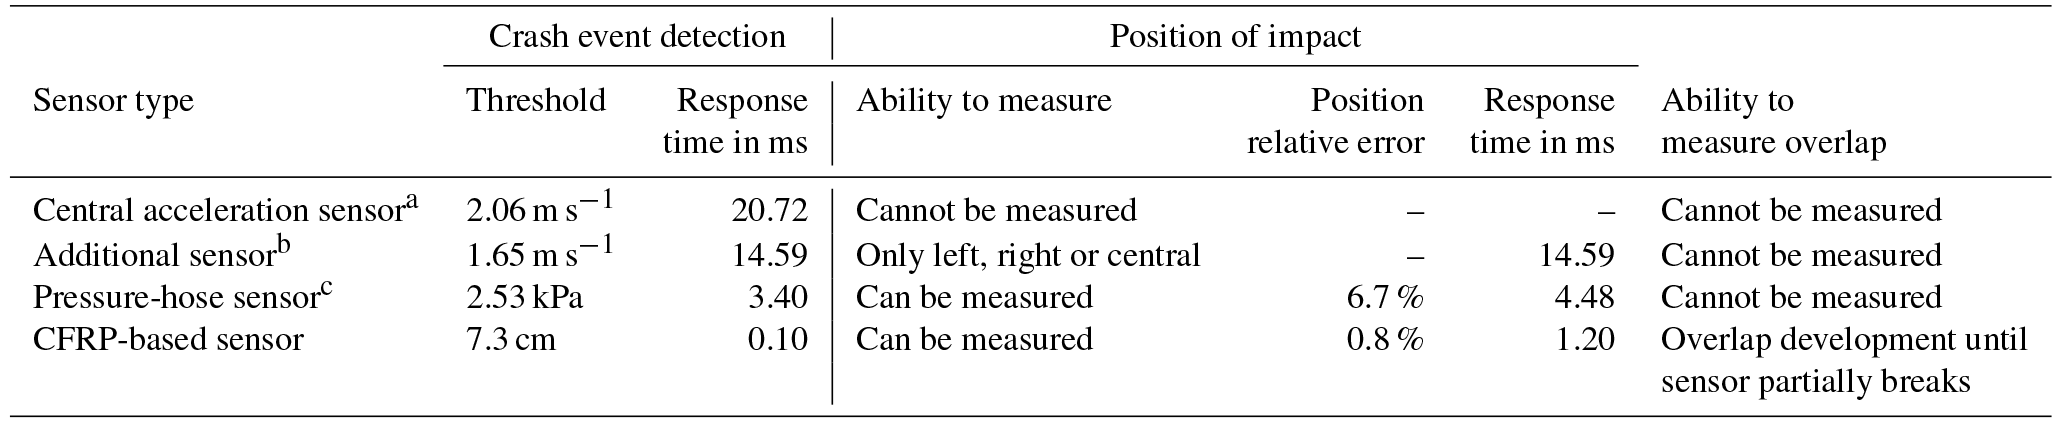
Table 1 shows the comparison of the various crash sensors presently used in cars. The time needed to detect the crash severity depends on the crash velocity, with less time for a higher crash velocity. The present technology sensors take about 10–50 ms to detect crash events, depending on the type of crash and sensor technology (Brandmeier et al., 2008; Chan, 2002; Feser et al., 2006; Infineon Technologies AG, 2011). Some crash detection systems employ two to four sensors over the vehicle width to approximately detect the position (middle, left or right) of the collision (Pipkorn, 2004). Present crash sensors can neither detect the exact position of the collision nor provide the information about the overlap of the collision.
Table 1Comparison of various sensors used for detecting frontal crash.*
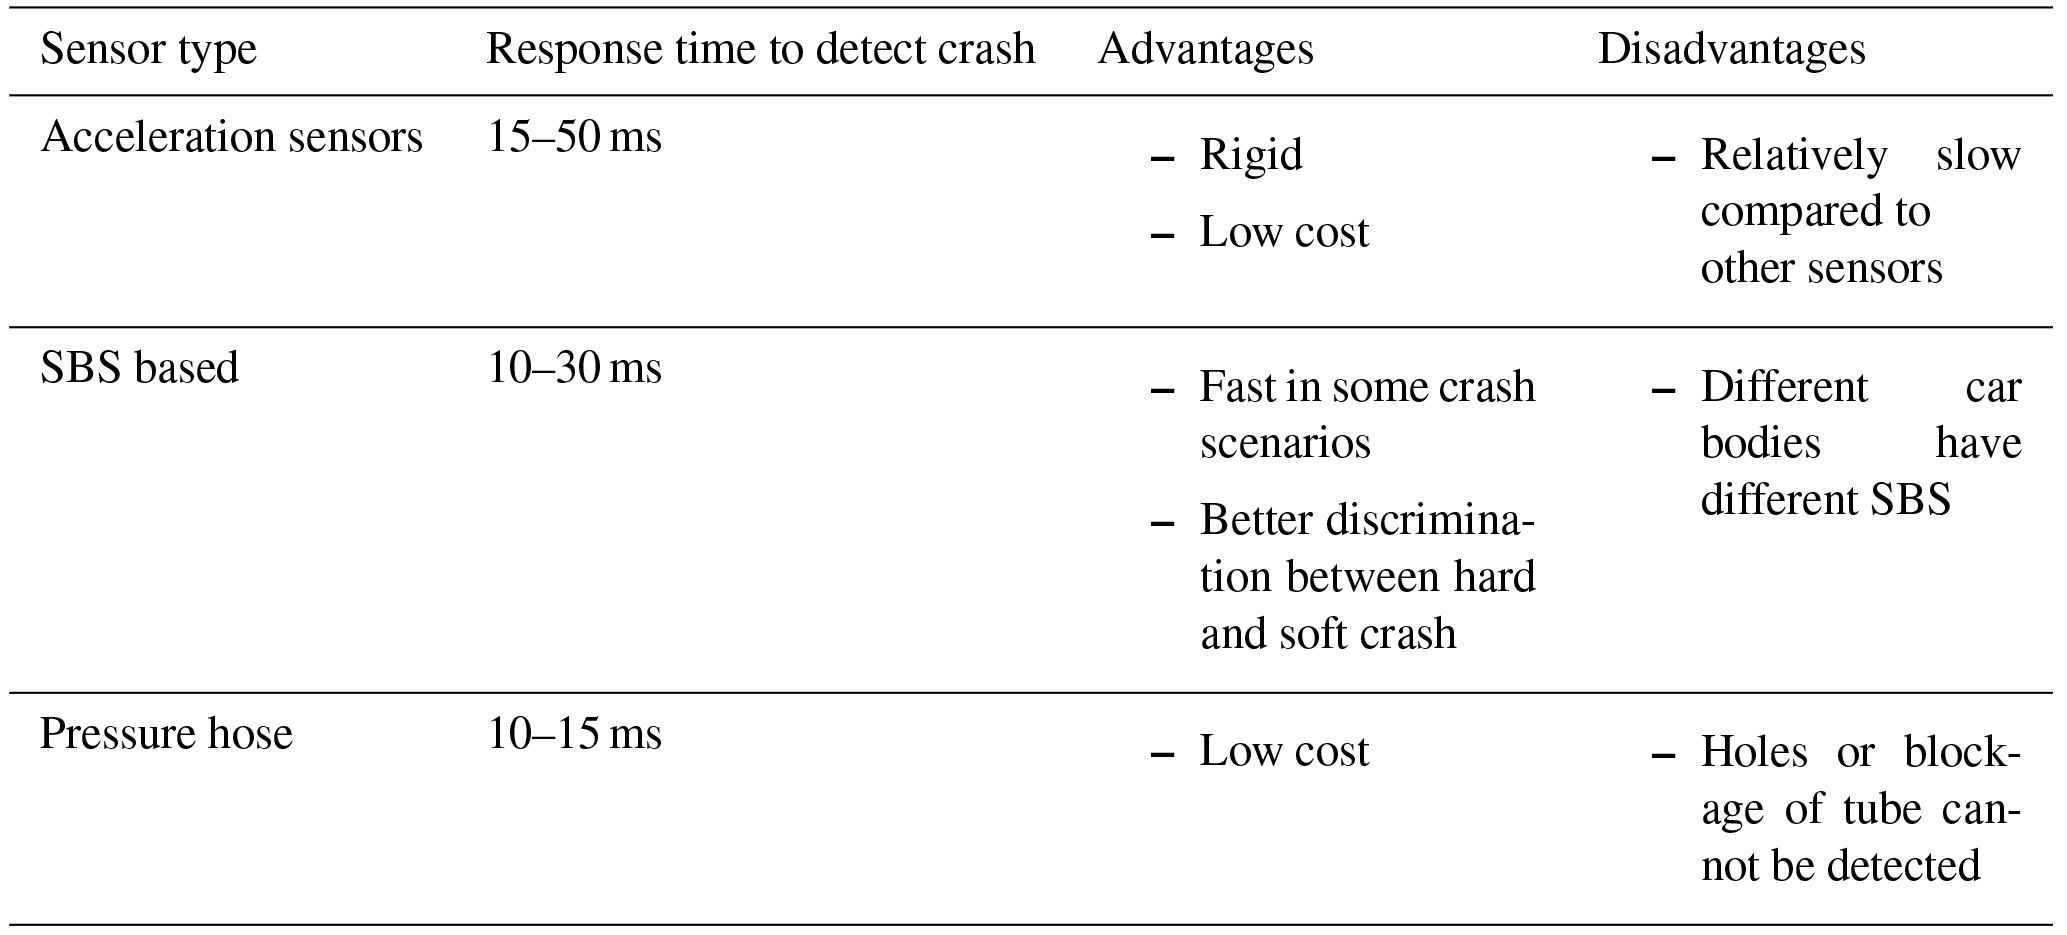
* Some values are derived from curves in Chan (2002), Feser et al. (2006), Brandmeier et al. (2008) and Infineon Technologies AG (2011).
Forward-looking sensors can give information about the geometry of detected objects. These parameters are compared with a database to find the matching object class (truck, small car, tree, etc.). If there is no match found, an unknown object is registered. This sub-algorithm can be called object classification. Next, the crash avoidance system calculates possible trajectories for the object and scans the neighboring regions. The possible trajectories can be estimated using motion tracking, physical motion models and other constraints. With this information, it decides whether the collision can be avoided. If the collision is inevitable, the pre-crash parameter prediction system is activated. In this phase, the position, overlap and impact velocity are estimated using the information from the various forward-looking sensors. Assumptions of vehicle and driver behavior are part of the trajectory calculations and lead to additional uncertainty.
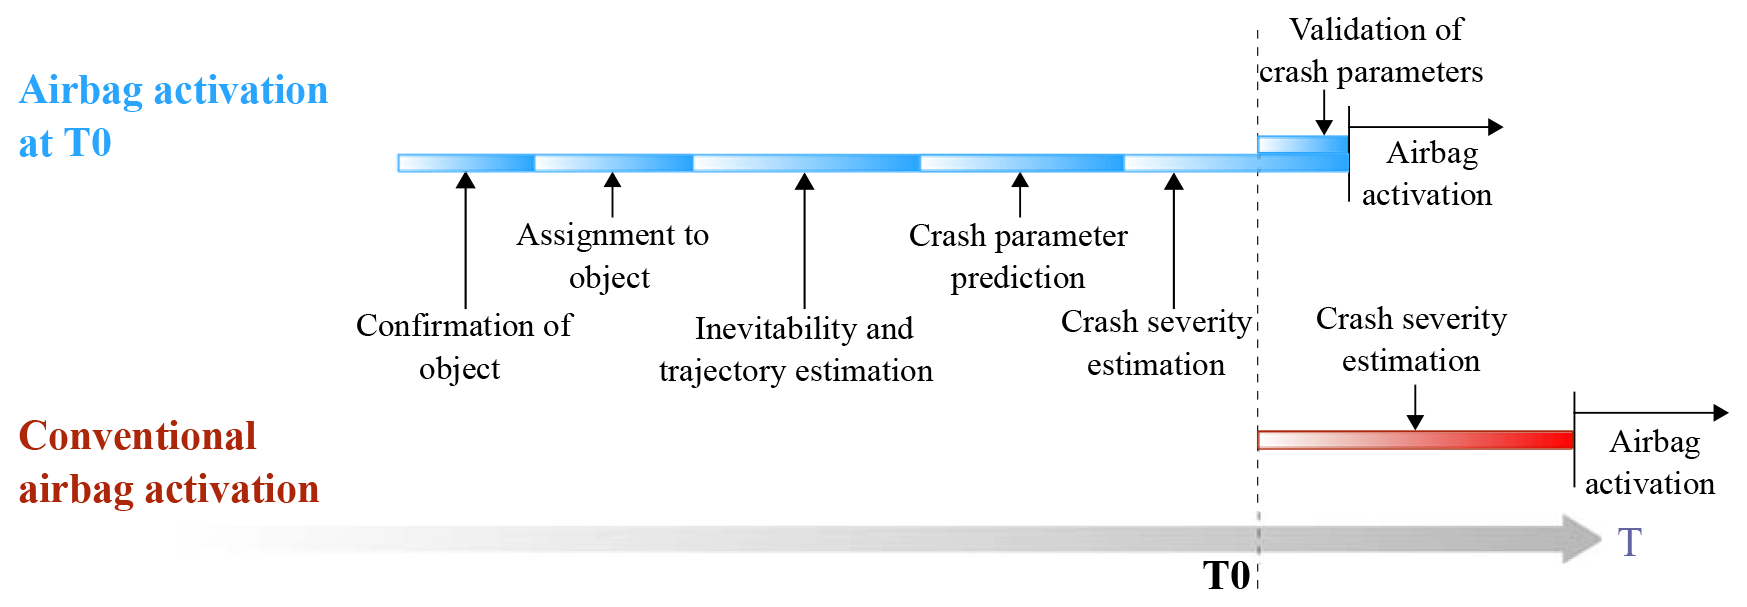
Since the predicted values from forward-looking sensors might be inaccurate, a validation system is required. The proposed sensor validates the occurrence of the collision event. This validation gives the system robustness against ghost objects detected by the forward-looking sensors. False activation due to other sensor problems can also be avoided. For example, light and soft items with large radar cross section might mislead a radar-based system but would actually cause no harm to the occupants. Additional information from the validation sensor can further increase safety. Shortly after T0, the validation sensor also measures the position and overlap of the collision. These values are then compared with the ones estimated by the forward-looking sensors. Validated crash parameters are used for further calculations. If the classification of the object is available, the object mass can be estimated based on a worst-case assumption for the class. Alternatively, the object information can be provided via vehicle-to-vehicle communication. This mass, along with validated crash parameters, is used for crash severity prediction. Based on the crash severity information, the decision on activation of passive safety systems is taken. For example, in a frontal crash scenario with the impact position on the driver side, with a small contact area of approximately 25 % of vehicle width (so-called small overlap) and a crash velocity of 64 km h−1, there is a high possibility of the driver hitting the A-pillar of the car. Hence, the A-pillar airbag must also be triggered in addition to the frontal airbags. Similarly, other crash scenarios would require the triggering of some other combination of passive safety systems. This paper is concerned with a concept for the validation sensor and its investigation for checking its potential.
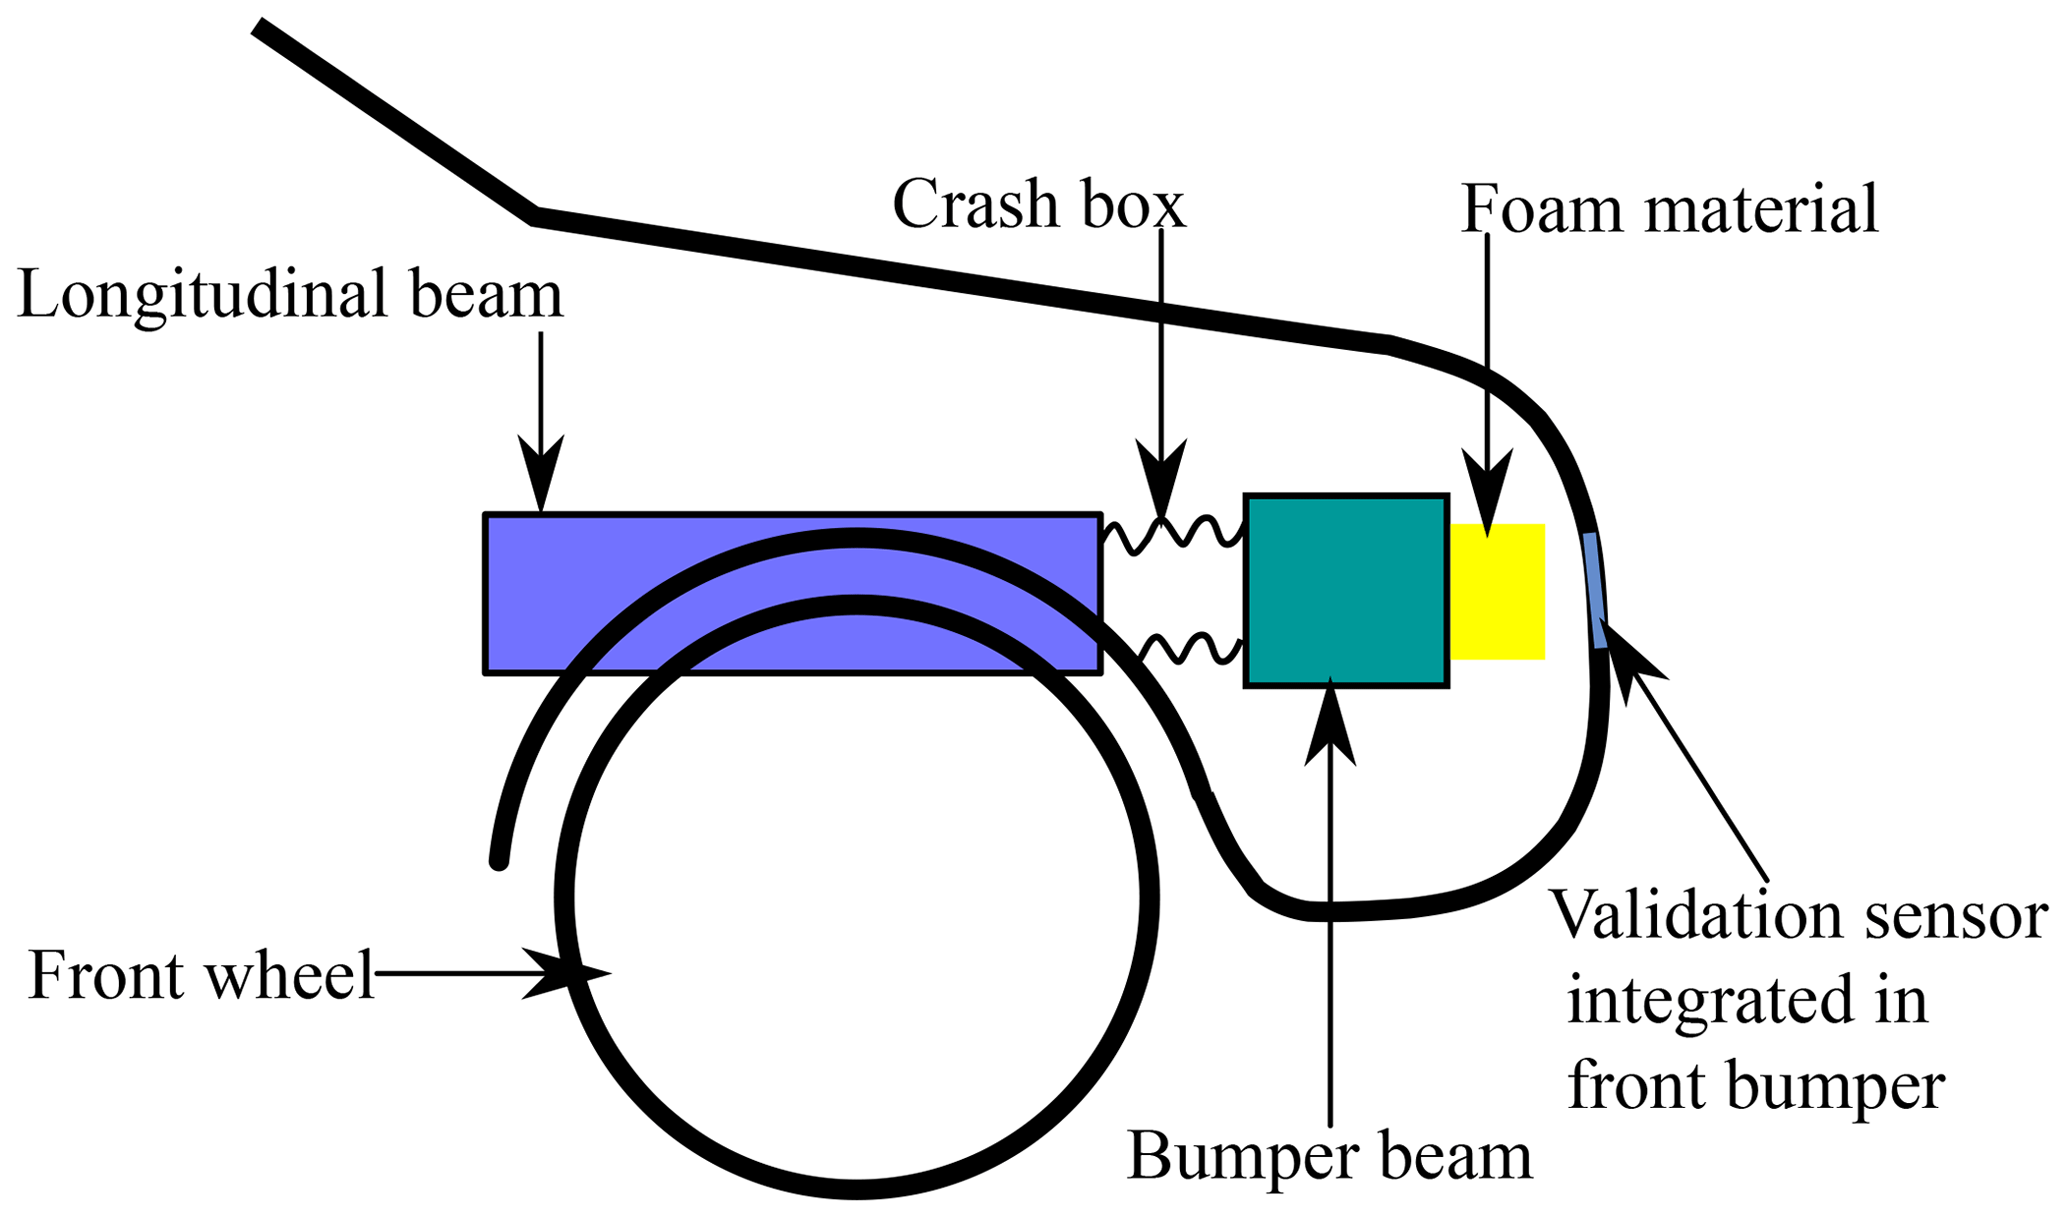
Figure 3 shows the CFRP-based validation sensor integrated in the front bumper of the car. Integrating such a sensor in the bumper material ensures detection of the relevant crash parameters just at the time of contact T0. In order to work under harsh conditions and for a broad range of collision scenarios, the sensing element, system and subsequent algorithms must be robust and reliable. With the critical crash scenario parameters of less overlap and extreme angles, the sensing element must cover most of the vehicle's front.
4.1 Construction
The sensing element consists of three layers: a low resistive layer and a high resistive layer separated by a soft material as shown in Fig. 4a. Initially, a five-layer carbon-fiber composite and a two-layer glass-fiber composite were manually fabricated. After the curing of the composite plates, the top epoxy surface of the carbon-fiber composite was removed to make it electrically conductive by a hand-sanding process. After removing the epoxy layer, the top surface can be used as a low resistive layer. For a high resistance layer, a resistive thread was stitched on the glass-fiber composite using a sewing machine. The resistive thread consists of 65 % silk and 35 % stainless steel (AISI-316L grade) material by mass. In the end, both the layers were joined together using a general silicone sealant. The silicone sealant was applied to form the hollow rectangular shape on carbon-fiber composite as shown in Fig. 4a. Then the high resistive layer was placed over it and allowed to cure under the static load at room temperature. Figure 4b explains the manufacturing process used for preparing the sensor prototype.
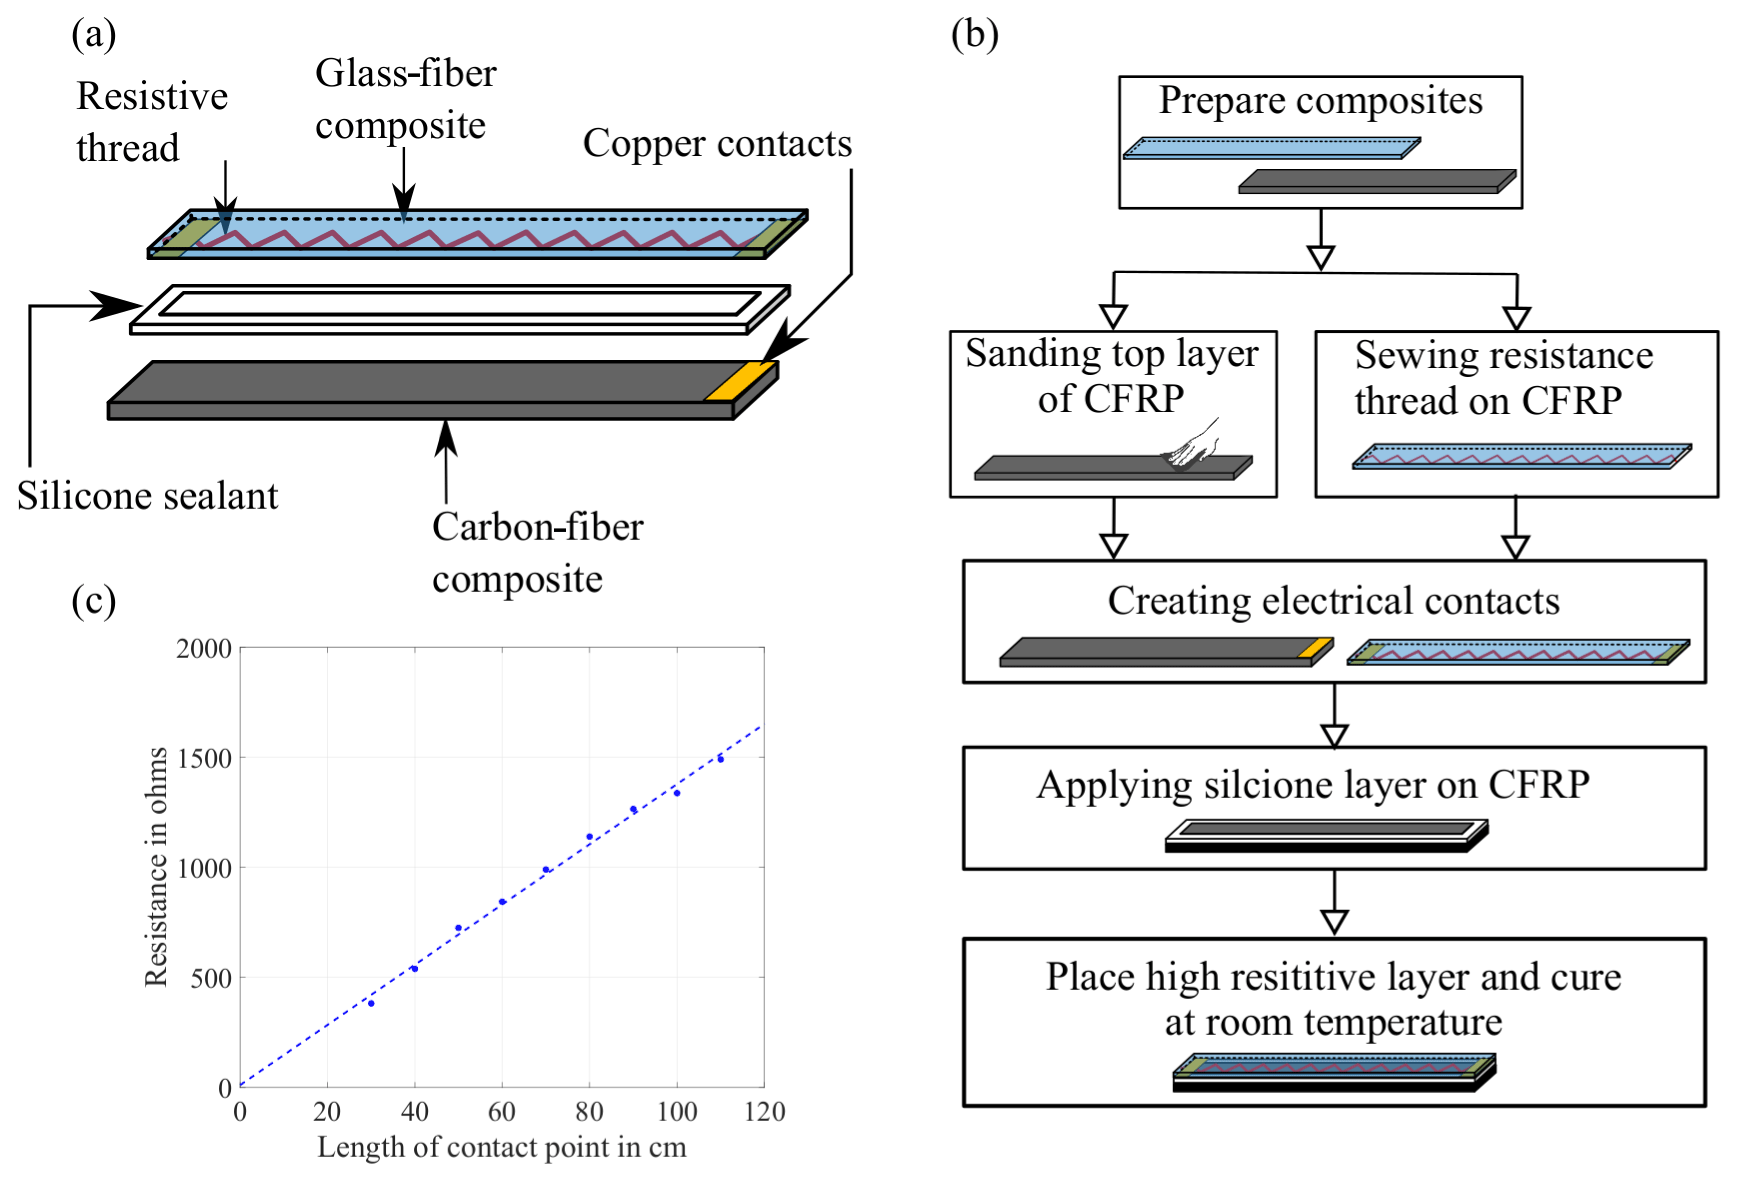
Figure 4CFRP-based validation sensor: (a) construction, (b) manufacturing process and (c) resistance diagram of sensor at different contact points.
For testing purposes, thin plate-like sensor prototypes were manually prepared in the laboratory. The final goal of the research work is to integrate the sensing concept in the vehicle parts like the front bumper, which is the final product, as shown in Fig. 3.
4.2 Working principle
Figure 5 shows the electrical schematic diagram of the sensor. A constant voltage is applied across the high resistive layer in series with a shunt resistance. The shunt resistance is connected to measure the current flowing through the sensor. The voltage across the resistive layer Uin, the current through the circuit Iin (which can be calculated from Ushunt and Rshunt using Ohm's law) and the measured voltage drop Um over the known resistance (Rknown=1 MΩ) are continuously measured with respect to time.

Figure 5Electrical schematic diagram of sensor: (a) no crash, (b) single-point contact and (c) multi-point contact.
During the normal driving condition, there is no electrical contact between the high resistive layer and the low resistive layer. Therefore, the measured voltage drop Um is almost zero. If a crash occurs, the resistive layer is deformed, which causes the two layers to come in contact with each other. As soon as the contact occurs, Um and Iin change depending on the position and the width of the contact (overlap). There are two types of contact which can take place during the crash event: single-point contact (Fig. 5b) and multi-point contact (Fig. 5c).
4.2.1 Single-point contact
When the high resistive layer touches the low resistive layer at only one point along its length, it is called single-point contact. During a single-point contact, Um increases, while the current in the sensor stays same as in the no-contact condition. This is because the overall resistance of the sensor Ro does not change and is equal to the resistance of the complete length of the resistance element. The overall resistance of the sensor can be divided in two parts, as shown in Fig. 5b:
-
Rl is the part of the overall resistance on the left side of the contact point.
-
Rr is the part of the overall resistance on the right side of the contact point.
Applying Ohm's Law, Um is equal to the part Rr multiplied by the current flowing through the sensor. The right side resistance part is given by
Based on the resistivity equation, the position of the contact point is given by
where the following apply:
-
P is the position of the contact point.
-
is the resistance per unit of length of the resistance element (resistivity divided by cross-section area).
4.2.2 Multi-point contact
In multi-point contact, the high resistive layer touches the low resistive layer at multiple points along its length. The midpoint of the two extreme contact points (leftmost and rightmost) is considered the contact point for position determination. During a multi-point contact, Um increases similarly to single-point contact. The overall resistance of the sensor reduces, which causes Iin to increase. The overall resistance of the sensor can be divided into three parts, as shown in Fig. 5c:
-
Rl is the part of the overall resistance on the left side of the leftmost contact point.
-
Rr is the part of the overall resistance on the right side of the rightmost contact point.
-
Rc is the part of the overall resistance between the leftmost and the rightmost contact point.
Since Rm depends on the resistivity of the high conductive layer, which is very low, it can be neglected. Therefore, the overall resistance of the sensor (Ro) is given by
where the following apply:
-
L is the total length of the sensor.
-
O is the distance between the leftmost contact point and rightmost contact point, which is the overlap.
Considering Ohm's Law, the overall resistance of sensor Ro is given by
From Eqs. (3) and (4), the overlap can be calculated by
The position of impact in multi-point contact is given by
and by substituting Eq. (5) in Eq. (6),
During the actual crash event, it is expected that, first, a single-point contact will occur followed by multi-point contact after some milliseconds resulting in the development of an overlap. An important aspect of the sensor is electrical contact resistance. The contact resistance depends on various factors such as contact pressure, surface roughness, material property, environmental conditions, etc. (Kogut and Komvopoulos, 2003; Slade, 2013). The contact resistance can be neglected if it is very small when compared to the overall resistance of the sensor. For measuring the contact resistance, a point of contact was established by pressing with a finger at different lengths, and the measured resistance was calculated by dividing Um by Iin, which is shown in Fig. 4c. The contact resistance for the sensor is about 10 Ω (intercept of ordinate) and can be neglected. Another important aspect is the robustness of sensor against vibrations, which can occur in normal driving conditions as well as during the crash. This can easily be achieved by a relatively stiff design of the sensor, so only impact forces during the crash can overcome the stiffness. Also the silicone sealant used in the sensor functions as a damper to keep the fluctuations of the contact points (intermittent contact) within the required limits. In addition, the silicone sealant ensures high sensor reliability by shielding the electrical contact surfaces against adverse conditions (e.g., dust and de-icing salt).
Pendulum tests were carried out to investigate the behavior of the sensor under low-energy and low-speed impact conditions. This test setup was chosen since it can simulate impact conditions, and at the same time, it requires low costs, very little effort and is simple for carrying out different tests.
5.1 Experimental setup
Figure 6 shows the schematic of an experimental setup used for the pendulum tests. It consists of the pendulum structure, the pendulum rod with the additional impacting mass, trigger (light gate), data acquisition system (LTT24, Labortechnik Tasler GmbH) and power supply. The sensor prototype was fixed on the fixed beam of the pendulum structure. The pendulum rod was attached with an additional mass of 11 kg to ensure that the impact energy is high enough to deform the prototype. A wooden block was fixed on the pendulum arm which acts as an impacting surface. The pendulum rod, along with the wooden block and mass, was locked at an angle and was released to impact the sensor. A light gate was used to trigger the data acquisition system, when the wooden block first touches the sensor.
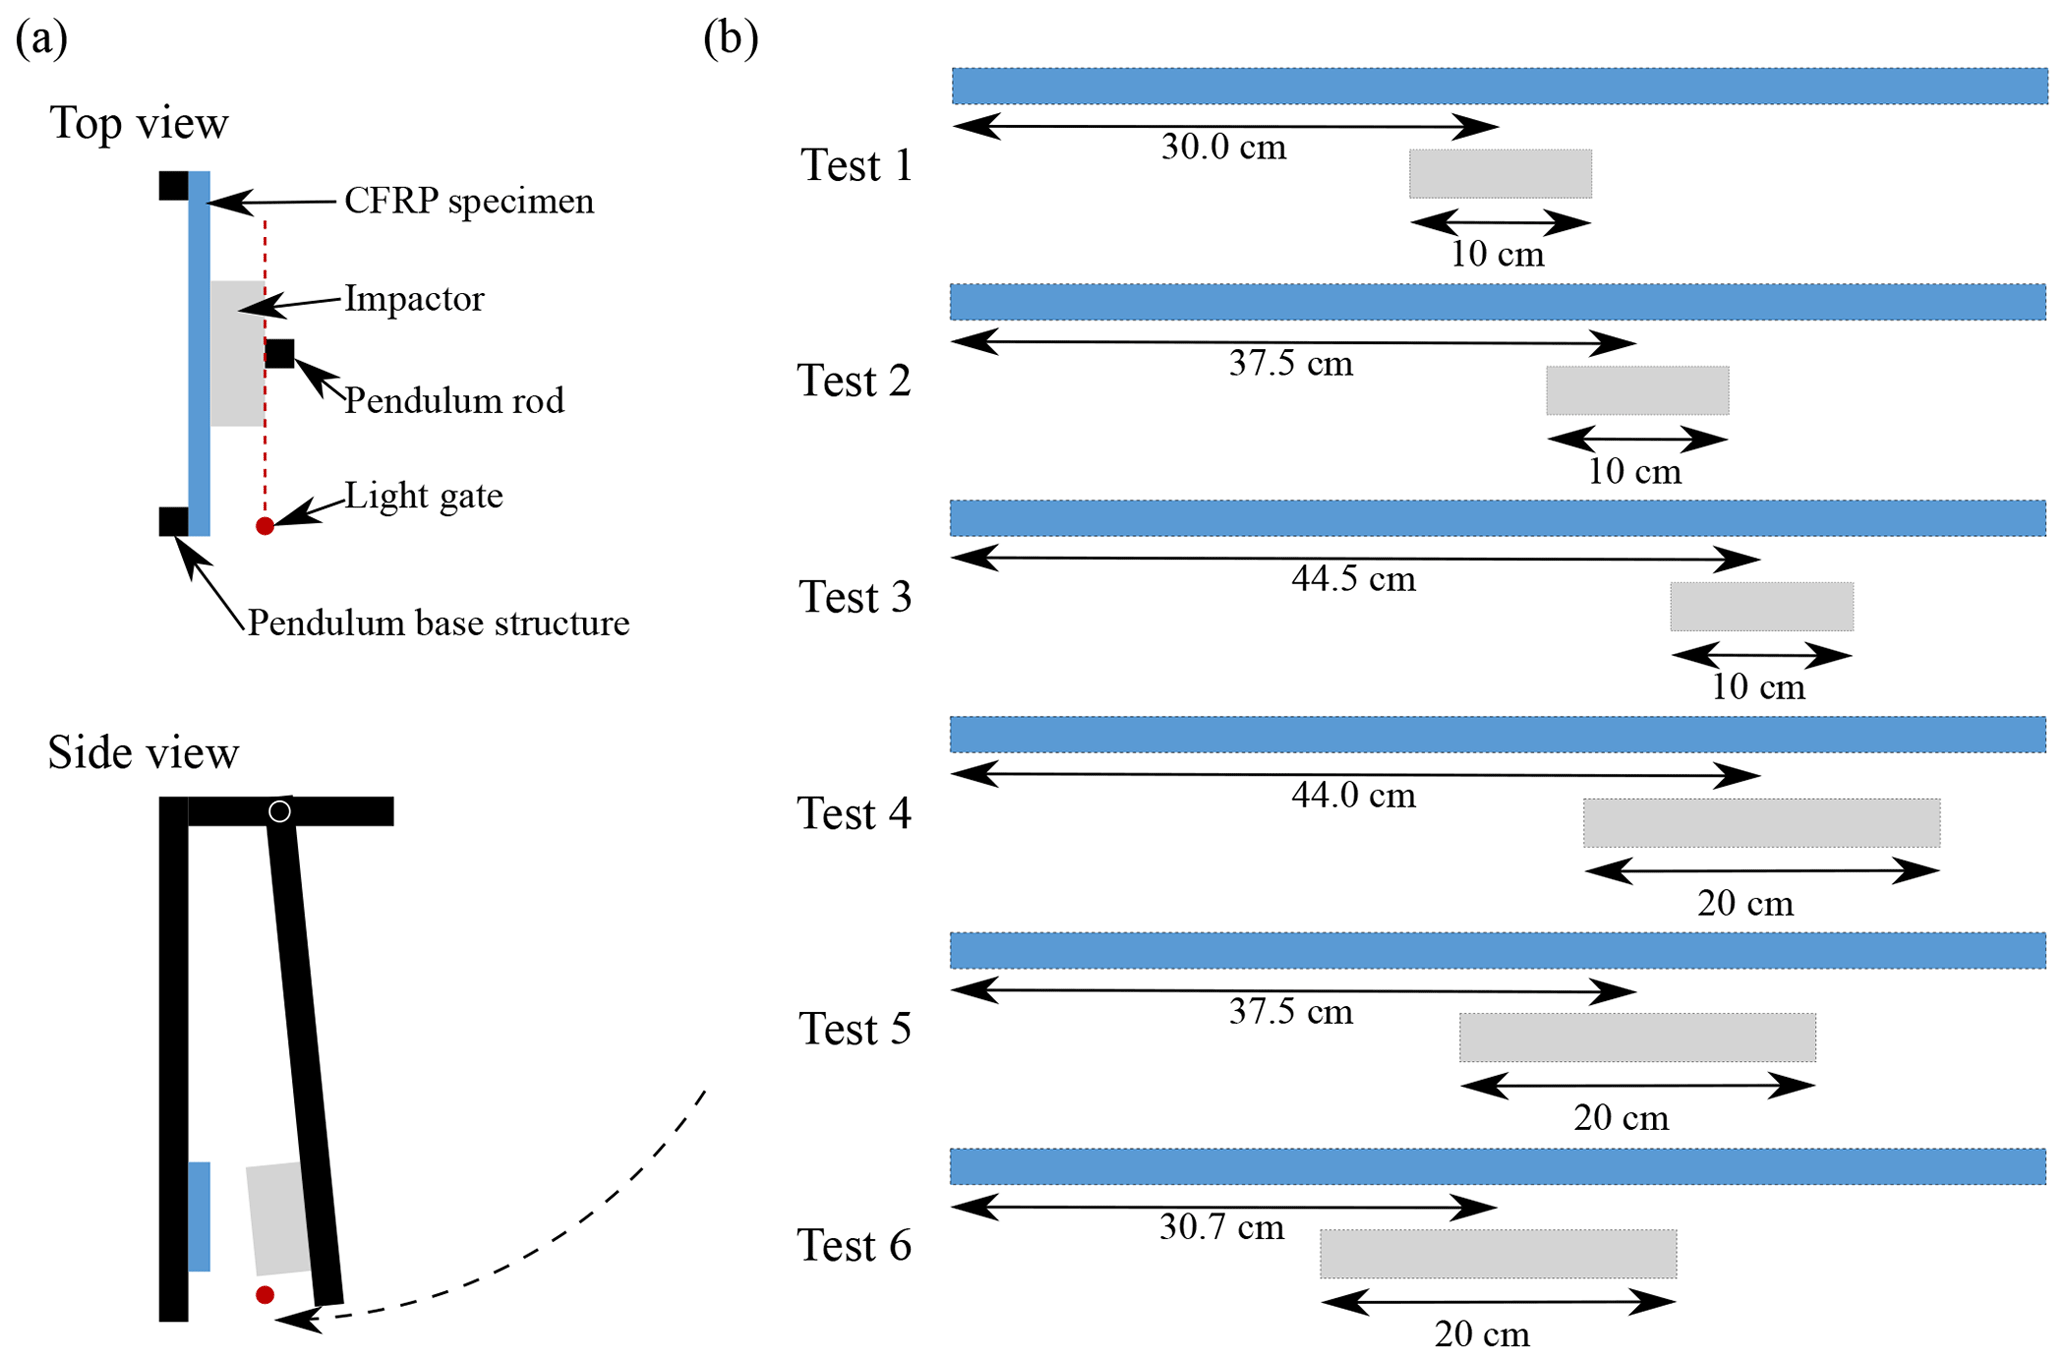
The sensor was tested with impactors (wooden block) of two different widths (10 and 20 cm) at three different impact positions each. The impact speed for all tests was approximately 4.2 m s−1. Figure 6b shows the different tests performed using the pendulum equipment.
5.2 Results and discussion
The raw signals Uin, Iin and Um are measured with data acquisition system with a sampling rate of 10 kHz, which is triggered using the light gate. These raw signals are converted into real-time values of position P and overlap O using Eqs. (7) and (5) respectively. The position and the overlap signals are illustrated in Fig. 7.
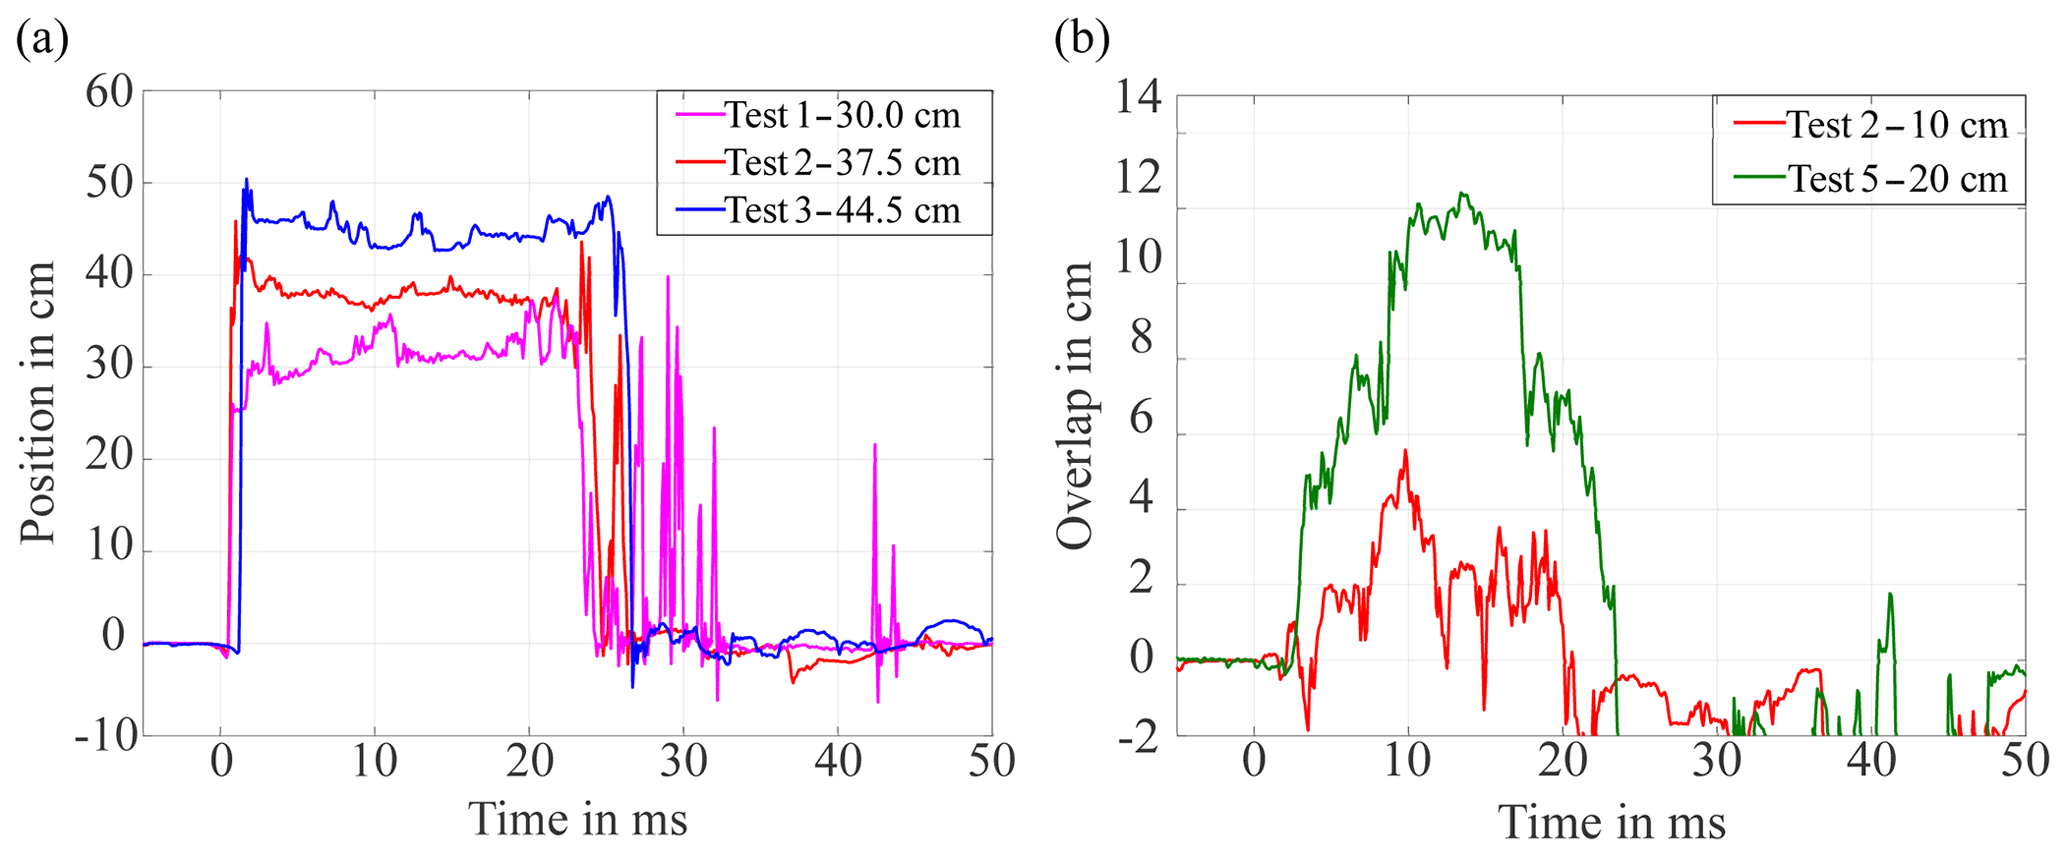
Figure 7Results from pendulum tests: (a) different impact position (with 10 cm impactor) and (b) different overlap (at impact position 37.5 cm).
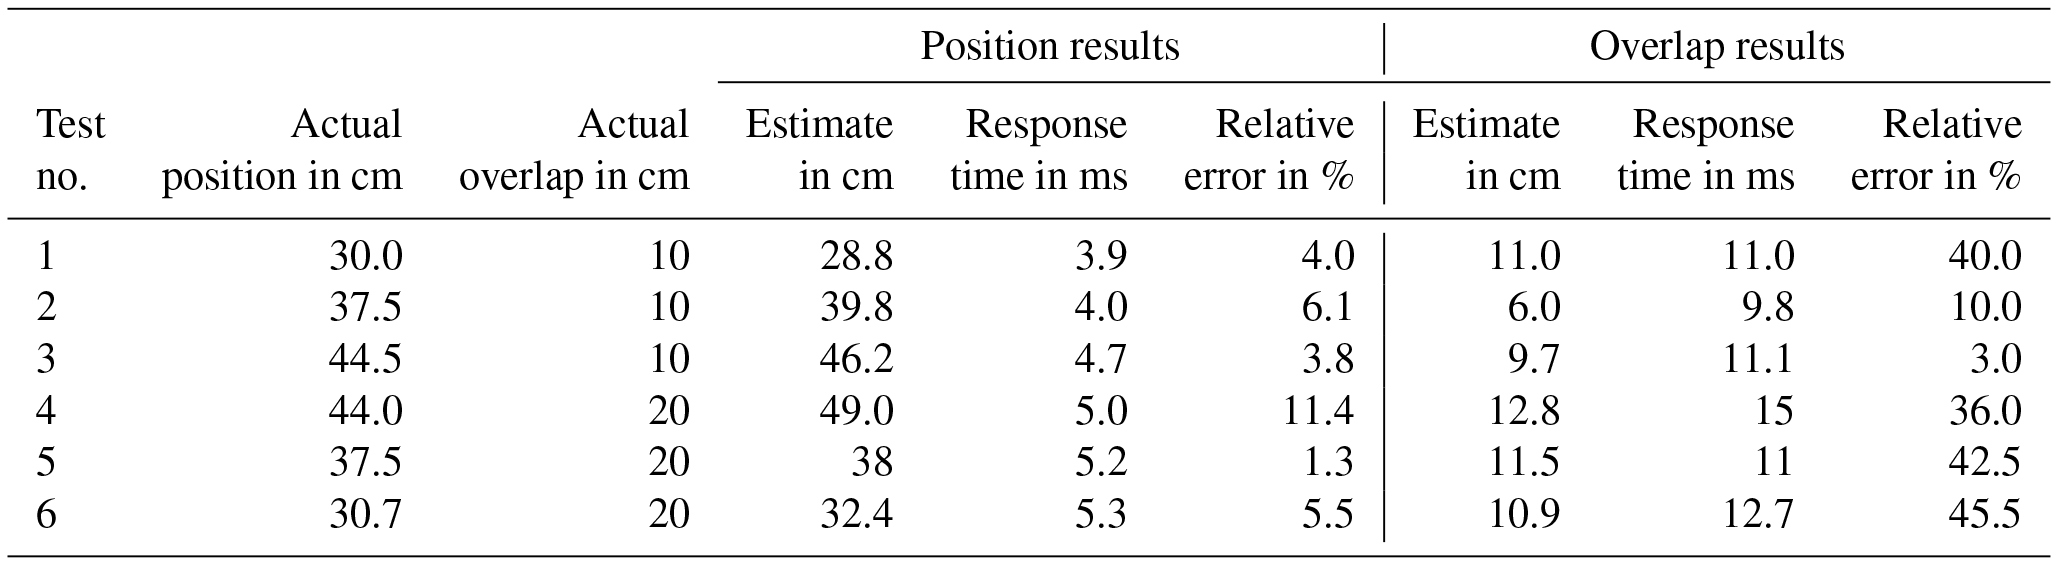
The tests where the sensor impacted at different positions show the capability of the sensor to determine the position of the impact as demonstrated in Fig. 7a. The actual position (corresponding to the midpoint of impactor) and actual overlap values were measured with a measuring scale before the test. In addition to the pendulum motion, the pendulum arm also had minor twisting motion. This caused an initial contact on the edge between the impactor and the sensor, followed by a surface contact (as seen by the signals in Fig. 7). Hence, for the estimate of the position value, an average value of the position signal over a time period of 3 ms was considered. As soon as the contact occurs, the position value rises very steeply (400–1000 m s−1) from zero until the position of the contact point is reached. Then the slope of position signal depends on the contact width or overlap development (which is comparatively low at about 100–150 m s−1). Therefore to select the starting point of average time period, a time instance with considerable change in the slope of the position signal was chosen. For the overlap estimation, the maximum value of the overlap signal was considered. During the rebound phase (when the impactor travels back after the impact), it was observed that the overlap values are negative. The negative values of overlap are realized due to the drop in Iin, which is caused by the increase in resistance of the sensor because of tension loading on the resistive thread. When the high resistive layer is in contact with low resistive layer, the above effect is negligible, because the tensed part of resistance thread is in contact with the CFRP-layer (low resistive layer) of the sensor. As this effect occurs during the rebound phase, this effect is not of importance for a real crash scenario because a safety decision should be taken within the first few milliseconds. The values of actual position and overlap for different tests are displayed in the Table 2. The table also lists the corresponding sensor-estimated values for different tests. The relative error for both position and overlap was calculated using the following equation:
Table 2 summarizes the results from the different pendulum tests performed. It can be seen that the position values can be determined with a relative error below 12 % at 3.9–5.3 ms after T0. Figure 7b displays the results from two tests with different overlap, which demonstrate the potential of the sensor to provide information on the overlap. The average relative error of overlap estimation is about 30 %. The estimation of overlap requires some time for the deformation of the sensor until the width of the contact is equal to the width of the impactor. Hence, the overlap can be estimated at about 9–15 ms after T0 (at 4.2 m s−1). This time will reduce with increased impact speed and therefore faster deformation. In a real crash with higher energy and the sensor installed directly on the bumper, it might be that the sensor is (partially) broken before the complete overlap is measured. Also the development of the overlap will be based on the curvature of the vehicle bumper. But some information is still better than no information, and the available information can be used to validate the overlap development for some samples, as explained in Sect. 6.3.
After the proof of concept by the pendulum tests explained above, it was decided to test the sensor in an actual vehicle crash test. The goals of the crash test were the following:
-
to verify the sensor under the test conditions similar to a real vehicle crash,
-
to compare the working of the sensor with other sensors.
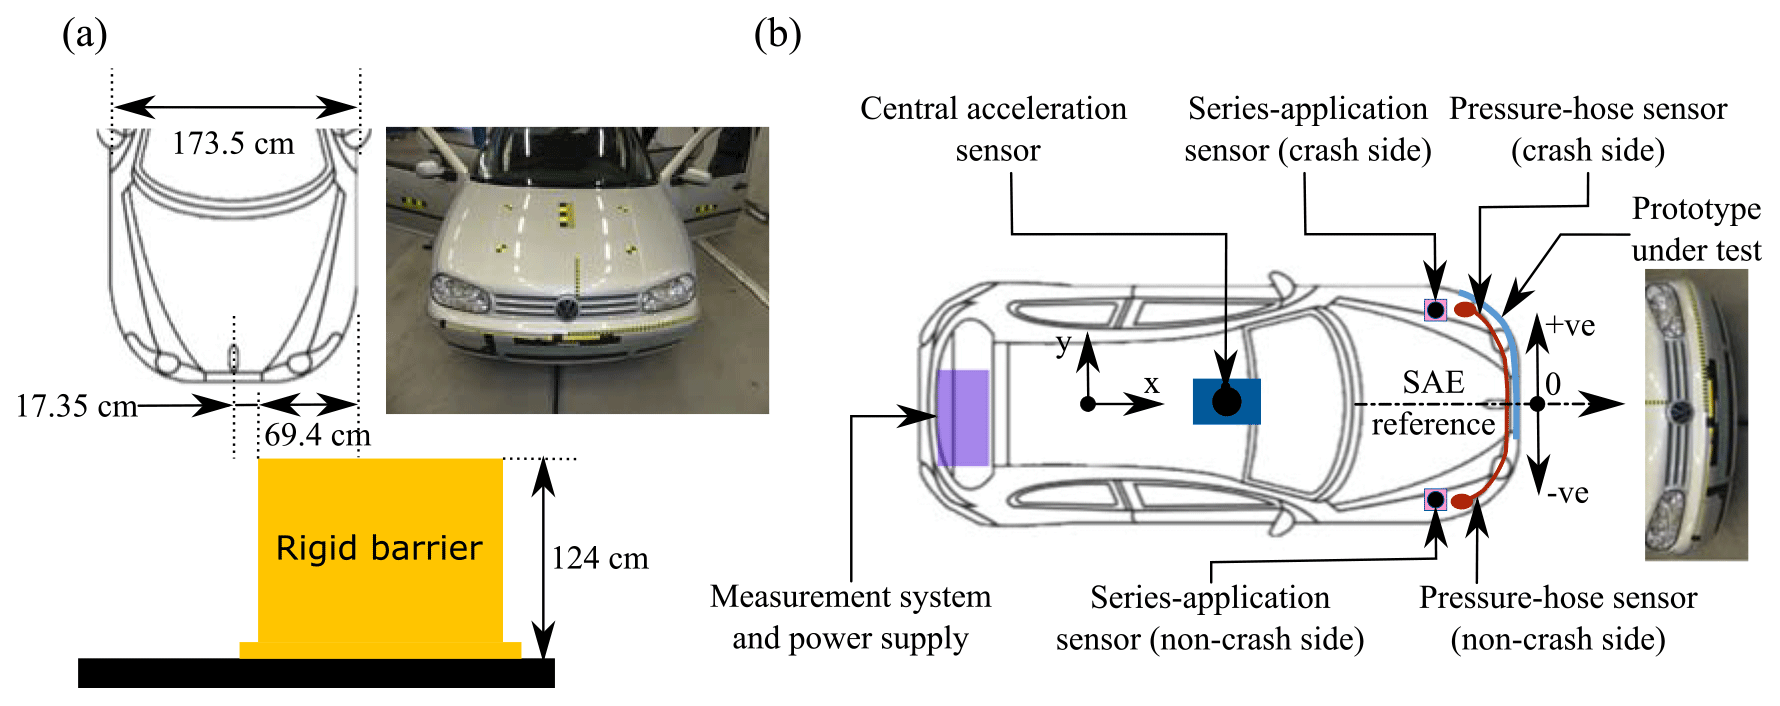
Figure 8Crash test: (a) test setup and (b) sensor positions and measurement system (SAE reference for position values is the center of the vehicle width).
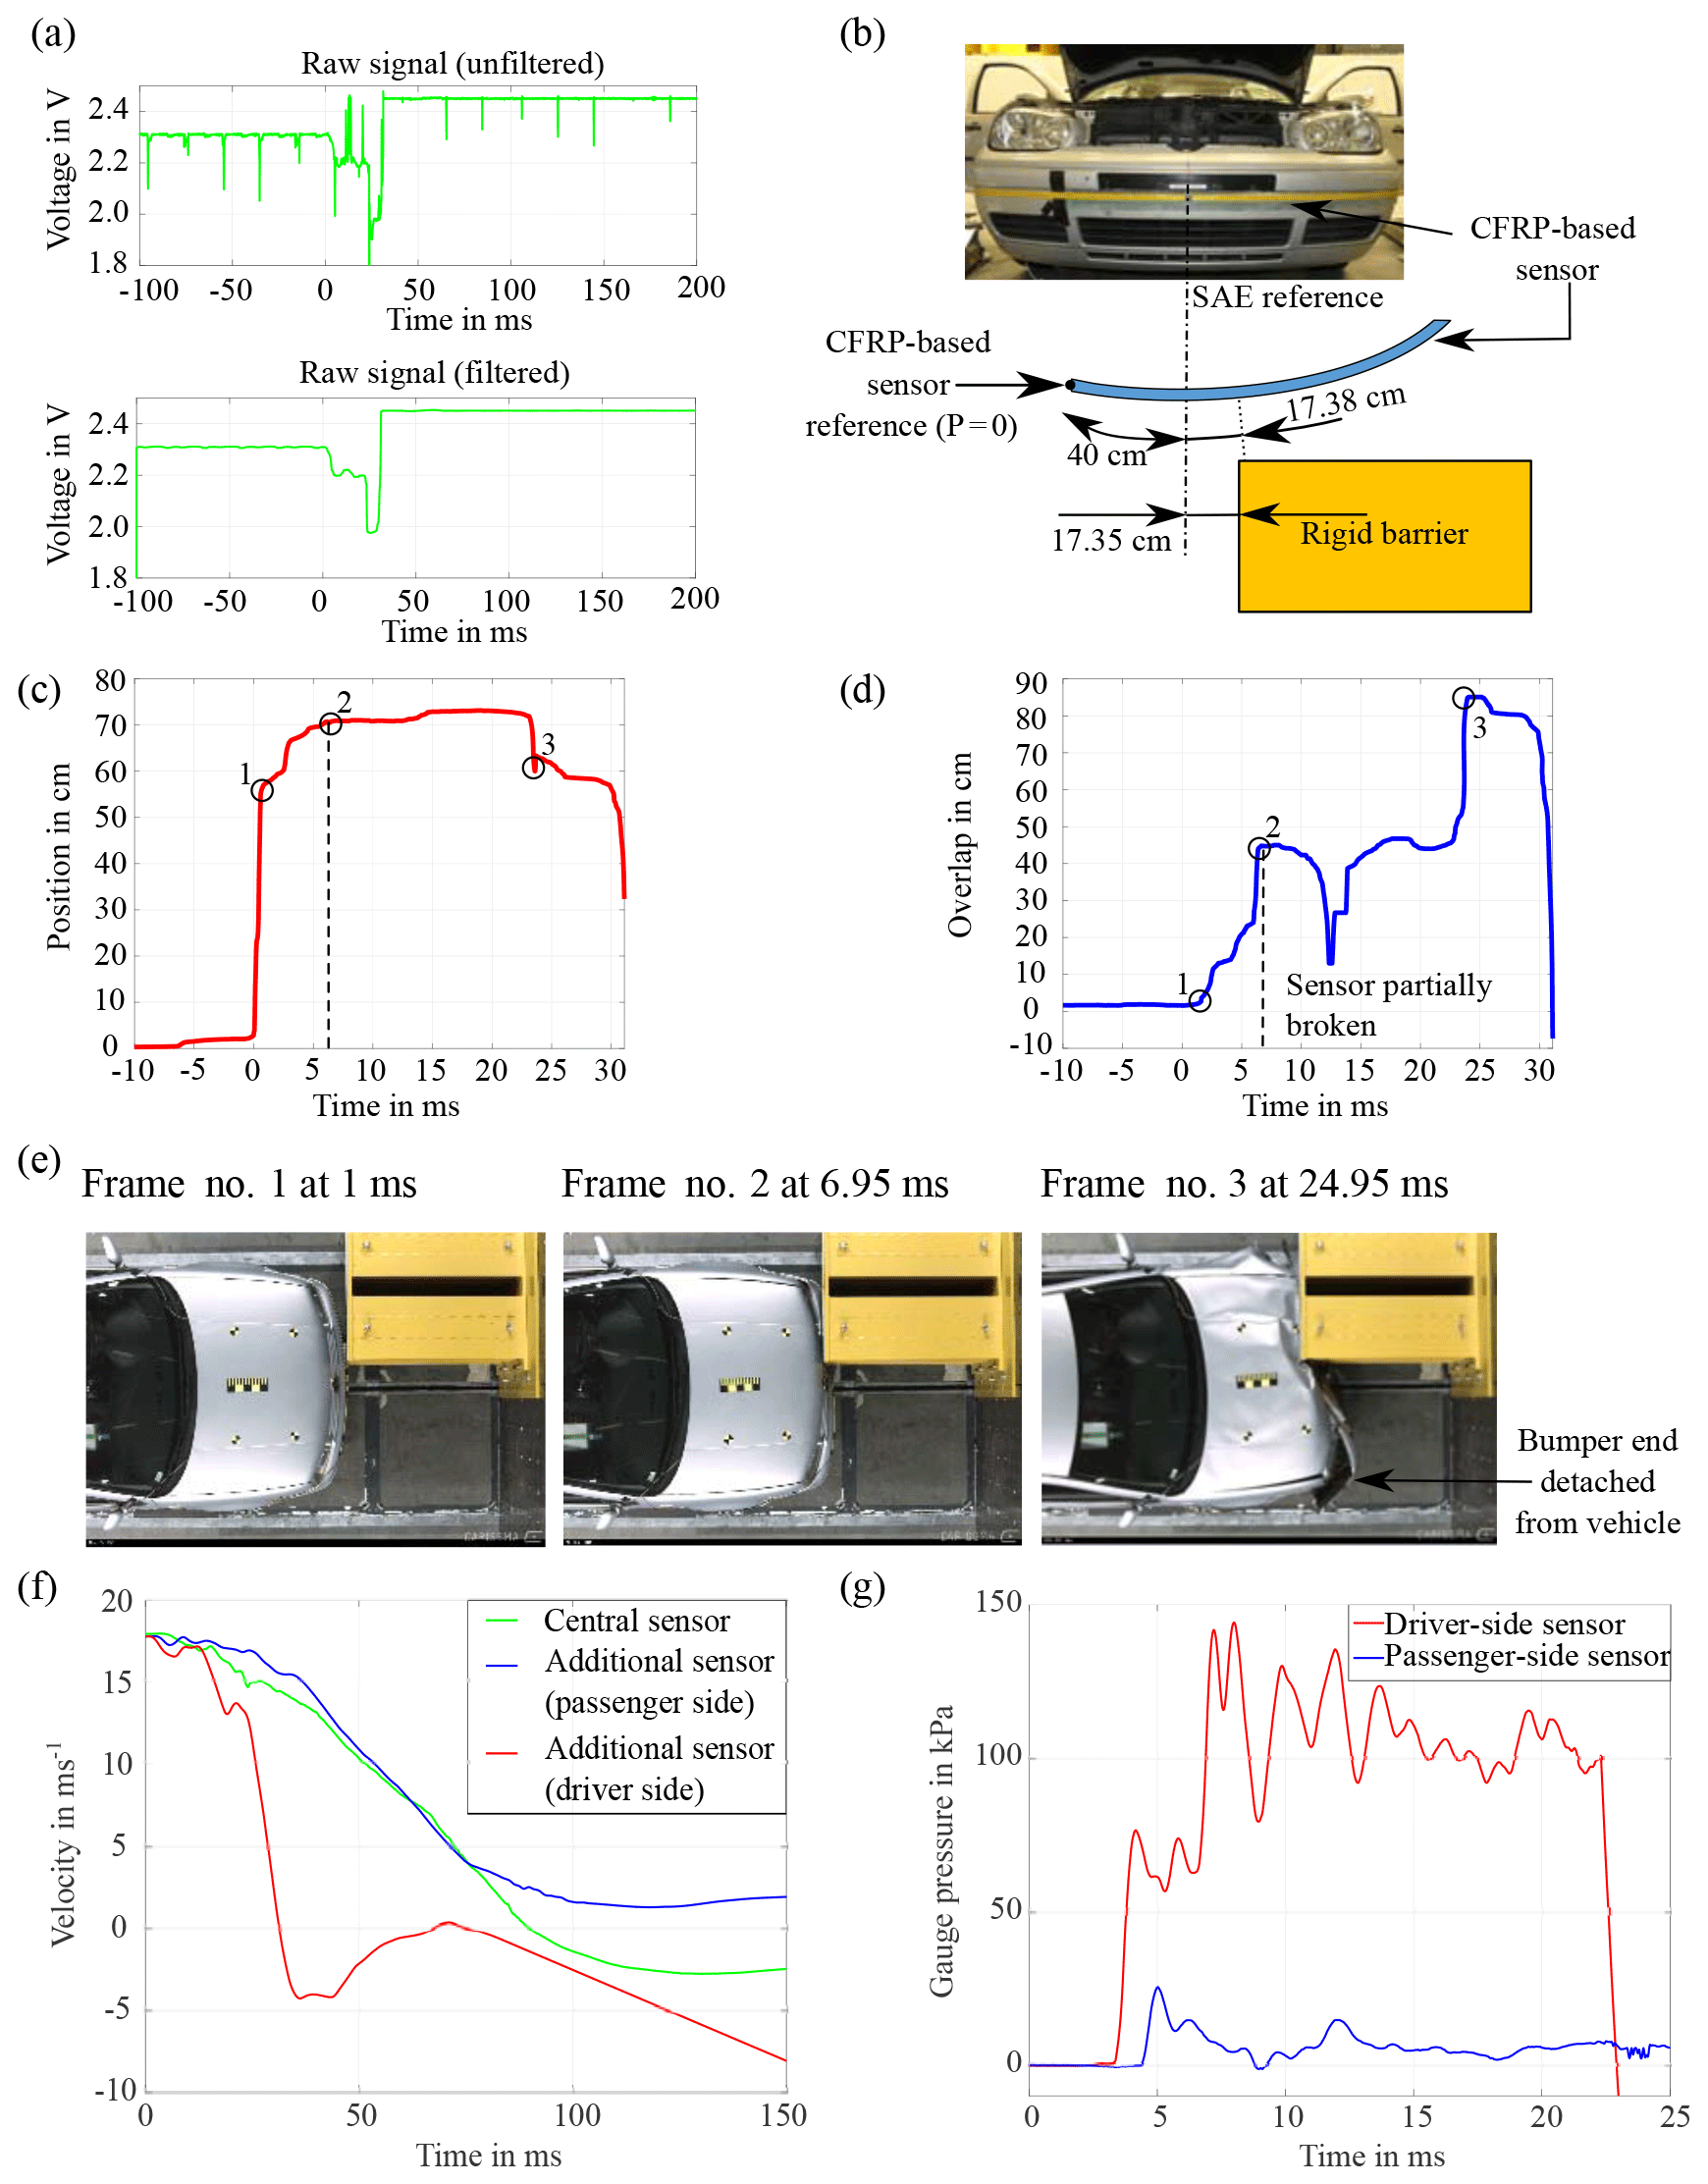
Figure 9Results from crash test: (a) raw and filtered signal, (b) sensor and vehicle reference system, (c) position signal, (d) overlap signal, (e) important events during crash, (f) velocity signal calculated from acceleration sensor, and (g) signals from pressure-hose sensor (pressure measured is gauge pressure, i.e., reference is atmospheric pressure).
6.1 Crash test configuration
Figure 8a shows the crash test setup, and Fig. 8b displays the positions of the different sensors installed in the vehicle during the crash test. The vehicle used for crash test was a Volkswagen Golf IV. The crash test was carried out at 64 km h−1 against a rigid wall with 40 % overlap (40 % of vehicle width will come in contact against the barrier). The vehicle was aligned in such a way that the impact occurs on the driver side. Two types of acceleration sensors were used. A triaxial acceleration sensor (Type-M0053A, Kistler Instruments GmbH) was mounted in the passenger compartment of the vehicle at the airbag control unit. The signals in the x direction alone are of importance for comparison. The other type of acceleration sensor (Early Crash Sensor, Continental) was installed near the crash zone, shown as an additional sensor in Fig. 1. Two such additional sensors were installed, one on the driver side and the other on the passenger side. The positions of both sensors were close to the crash boxes. They measure signals in one direction only (uniaxial) and were mounted on the vehicle structure to measure in x direction. In addition to the acceleration sensors, a pressure-hose sensor was installed in the energy-absorbing foam on the bumper beam. The prototype of the validation sensor manufactured was 130 cm in length (this was limited by the size of the carbon-fiber roll), while the width of the vehicle was 173.5 cm. Hence, it was decided to glue the prototype in such a way that the complete impacting side (driver side) was covered. The prototype was glued on the bumper using superglue (Loctite 401), as shown in Fig. 8b. Since the CFRP-based sensor is glued to the bumper, it measures position and overlap signals in terms of arc length (curved distance) instead of straight distance.
The crash test data were recorded using two data acquisition systems. One system was sampled at a rate of 100 kHz (M=bus Pro Analog module, Messring GmbH), while the other was sampled with a rate of 1000 kHz (LTT24, Labortechnik Tasler GmbH). The systems, along with the power supply box and cable trailing system, were installed in the vehicle trunk, as shown in Fig. 8b. In addition to the data acquisition systems, three high-speed cameras were installed to film from top, left and right views to monitor the crash. The data acquisition systems and the camera system were triggered by a standard trigger sensor used in a crash test. The trigger ensures all the systems have the same zero time (T0) at the first contact of the test vehicle with the rigid barrier.
6.2 Results and discussion
The vehicle crash management structure absorbed the energy of such a critical collision, with some deformation caused to the A-pillar on the driver side. The maximum deformation was measured to be about 95 cm (in the longitudinal direction or x direction as per Society of Automotive Engineers – SAE – norms). It was observed that the raw signals (Uin, Iin and Um) measured during the crash test contained a noise of 50 Hz. This noise was induced by the DC power supply and the cable system of the crash test facility. A 1-D median filter (“medfilt1” function with n=300 in MATLAB software Mathworks, 2015) was used to remove the noise from the raw signals as shown in Fig. 9a. After filtering the 50 Hz interference, the position and the overlap signals were calculated as explained in the pendulum experiments. Figure 9b describes the reference points used for the crash test. As per the SAE norms, the center of the vehicle width is considered the zero position or reference for position values. For the CFRP-based sensor, this reference or zero position is the end of the sensor at the passenger side. This end is at 40 cm (arc length) from the vehicle center, hence for calculating the relative error, this value is subtracted from the position value. The actual value for calculating the relative error is 17.38 cm, which is the arc length corresponding to the offset 17.35 cm (i.e., the distance between the edge of rigid barrier and vehicle center) and bumper radius of 150 cm (see Sect. 6.3.2 for the calculation of the radius). The position and the overlap values are shown in Fig. 9c and d, respectively. It can be observed from the position signal that the crash event can be detected within 1 ms of the crash. In Fig. 9e frames extracted from the high-speed video at three important time instances are displayed in frame no. 1–3. At about 1 ms after T0, the high resistive layer contacts the low resistive layer at one point, displayed as point 1 in the position signal. As the time progresses, the contact length of the high resistive layer and the low resistive layer increases, which can be observed in both position and overlap signals. The front of the car has a round profile, which is the reason for the increase in overlap with time. At about 6.3 ms, the maximum contact width comes in contact with the barrier. At about 10 ms the partial breakage of the resistive layer starts (the part of the resistive thread in between the contact end points is broken). This was observed by a drop in the current signal. At about 24.95 ms, the bumper is deformed considerably. The passenger-side end of the bumper is detached from the vehicle, causing bending of the sensor. At this time instance, the resistive layer (the unbroken part of the resistive thread) connects with the CFRP layer again and can be observed by the overlap and position signals. One of the contact end points (passenger side) shifts to the other side of the center (caused by the deformation and bending of the bumper). This can also be seen by a drop in the position signal, since it is the midpoint of two contact end points.
Three criteria were considered for comparison of the sensor signals. The first criterion of comparison is the sensor response time for crash detection. A crash event can be identified by a considerable change in the signal, which should be higher than the signal noise. For all the sensors, the time when the threshold of 10 % of the maximum value of the signal from the same sensor is exceeded was considered as the time at which a crash event is detected. The second criterion was whether the sensor can provide additional information about the position of impact. The third criterion was whether the sensor can provide information about the overlap.
Most of the algorithms for activating restraint systems use velocity signals from the acceleration sensor for airbag activation (Kendall and Solomon, 2014). Hence, the acceleration signals from the sensor are filtered with a low-pass filter with a cutoff frequency of 100 Hz and then integrated to get the velocity signals. The derived velocity signals were used for comparison. The central acceleration sensor can only detect a crash event when the value is greater than the threshold (10 % of 20.6 m s−1 is 2.06 m s−1). The acceleration signal from the additional sensor on the crash side (driver side) has higher amplitude compared to the non-crash side (passenger side) sensor. For additional sensors, the maximum of velocity signal of passenger-side sensor was considered for calculating the 10 % threshold for both the sensors. In addition to crash event detection, these sensors can provide information, such as driver-side, central or passenger-side impact.
The pressure-hose sensor also displayed higher pressure on the driver side than passenger side. The maximum pressure for driver-side sensor was about 144 kPa, while for the passenger-side sensor, it was about 25.3 kPa. For the threshold the lower value of the two maximum values was selected (10 % of 25.3 is 2.53 kPa). Since the impact was on the driver side, the pressure signal of the driver-side sensor crosses the threshold (2.53 kPa) earlier (at about 3.40 ms) than the passenger-side sensor (at about 4.48 ms). The position of impact can be calculated using the time difference of the two sensors when the value crosses the threshold pressure, represented as
where the following apply:
-
Tright is the response time when the passenger-side pressure sensor crosses the threshold pressure.
-
Tleft is the response time when the driver-side pressure sensor crosses the threshold pressure.
-
c is the speed of sound in air.
The position of the impact calculated with the above equation is with reference to the center of the pressure hose, which is same as the center of the vehicle width (zero position). The pressure-hose sensor cannot provide information on the overlap during the crash.
Table 3Comparison of different sensor types.
a measured at vehicle tunnel, b measured near crash zone (additional sensor) and c pressure-hose sensor incorporated in the foam behind the bumper. Please see Fig. 1.
Table 3 summarizes the comparison of the sensor signals. It describes the temporal advantage of CFRP-based validation sensor compared to the other sensors. Since the CFRP-based sensor breaks partially before the complete development of the overlap or contact width, the complete overlap value cannot be estimated. But it provides the development of overlap until the sensor breaks partially. The table also shows that CFRP-based sensor can provide all the information which no other sensor can provide.

Figure 10Overlap development: (a) vehicle bumper outline up to 30 ms (red line represents overlap), (b) example frame showing the procedure for drawing vehicle outline, (c) comparison of overlap development of CFRP-based sensor with video analysis results, (d) comparison of overlap development of CFRP-based sensor with predicted with upper and lower limits, and (e) geometrical schematic for predicting overlap development.
6.3 Overlap development
6.3.1 Overlap development from video analysis
To verify the overlap development measured by the CFRP-based sensor, a video analysis was performed. The frame rate of the video was 1000 frames per second. For video analysis, frames from 0 up to 30 ms were extracted and analyzed. A vehicle outline was drawn on each frame extracted from the video (as shown in Fig. 10a and b). The red line shows the overlap for each frame. The length of this line was multiplied by the scaling factor (real vehicle width or width of vehicle in frame) to find the actual overlap. The comparison of the overlap development given by the video analysis and by the CFRP-based sensor is shown in Fig. 10c. It shows that the measurement is in agreement with the test until 10 ms, after which the partial breakage of the sensor occurs.
6.3.2 Prediction of overlap development
A vehicle crash against a rigid barrier is considered. The curvature of the bumper can be assumed as a circle with a large radius R, as shown in Fig. 10e. Point C is the center of the assumed circle. B0 and B1 are the two contact end points. For the prediction of the overlap development, the lateral movement of the vehicle during the crash is neglected. Hence, the distance of point B0 from the center line is constant and equal to the position of impact at the first contact point (PT0 = 17.35 cm). The distance of point B1 from the center line varies with time, which is dependent on the vehicle deformation x(t) during the crash.
Consider △CA0B0 in Fig. 10e, where
Consider △CA1B1, where
The overlap (O(t)) is given by the length of the arc B0B1:
The deformation of the vehicle during a crash can be calculated using simplified mass-spring vehicle crash models (Huang, 2002; Lauerer, 2010). An offset vehicle crash can be modeled by a simplified two-mass-spring model, as explained by section frontal offset impact in Huang (2002). The mass of the impacting side was considered to be 60 % of vehicle mass (vehicle mass is 1090 kg), while the stiffness of the impacting side was assumed to be 16 538 N m−1. The remaining 40 % of the vehicle mass was attached to the impacting-side mass by a stiff spring (spring stiffness of 165 380 N m−1). This two-mass-spring model was simulated. The displacement response of the impacting-side mass is the deformation x(t) of the vehicle for the offset vehicle crash scenario. Using Eq. (12) and the deformation calculated from the simplified vehicle model, the overlap development can be predicted. This predicted overlap development can be compared with the measured overlap development using the CFRP-based contact sensor for validation.
For the crash test performed, the radius that fits the test vehicle bumper curvature is 150 cm. Two conditions (time shift and maximum limit) were included in the predicted overlap development. Since the CFRP sensor requires some time after T0 for deformation of the sensor (about 1.2 ms) to determine the position at the first contact point, a time shift of 1.2 ms was added in predicted overlap signal. The overlap development is limited by the maximum contact width, which is the other condition. For the crash test performed, the theoretical maximum overlap is the maximum possible length of arc B0B1 (58.1 cm). This can be calculated based on the geometry and considering point B1 at a distance of 55 cm from the edge of the rigid barrier as shown in Fig. 10e as the maximum limit for the overlap. Figure 10d shows the comparison of the overlap development calculated using equations and the overlap development measured using the CFRP-based sensor. As discussed in Sect. 6.2, considerable deformation and bending of the sensor at 24.95 ms can lead to contact at locations where the sensor bends. Hence, for validation methodology a comparison of the overlap signals until the sensor partially breaks (from 1.2 to 8 ms) should be considered. This is also in line with the time requirements for crash detection and airbag deployment.
As observed by the pendulum experiments, the measured overlap value is always smaller than the actual overlap value. Hence, the lower limit is critical as compared to the upper limit. Two conditions were considered for setting the limit from the predicted value. The first condition is the relative change of the predicted value, which should be considered when the overlap values are low. The other condition is the maximum allowable change from the predicted overlap, which should be considered for large overlap values. For the lower limit at different time instances, the larger value of 50 % of predicted overlap or predicted overlap minus 15 cm was chosen. Similarly for upper limit, the lower value of either 1.25 multiplied by predicted overlap or predicted overlap plus 10 cm was chosen. If for the 90 % of the time instances (between validation time period, 1.2 to 8 ms), the overlap values measured by the CFRP-based sensor are within the upper and lower limit, then the validation is considered positive, otherwise it is considered negative. The conditions for limits are assumed, and these should be optimized based on the requirements of the complete safety system and the possibilities of the restraint system.
A rigid barrier test represents a vehicle crash against a rigid wall. Similarly, the equations for a crash with other objects (opponents) like another vehicle, tree, truck, etc. can be calculated using the geometrical simplifications. Forward-looking sensors can also provide information about the geometry of the opponents (Andres et al., 2013; Broßeit et al., 2016; Steinemann et al., 2011). Considering this information along with the other crash parameters (position, velocity, etc.), a particular equation for predicting the overlap development can be selected. Using this methodology, the overlap development can be predicted based on the information of forward-looking sensors.
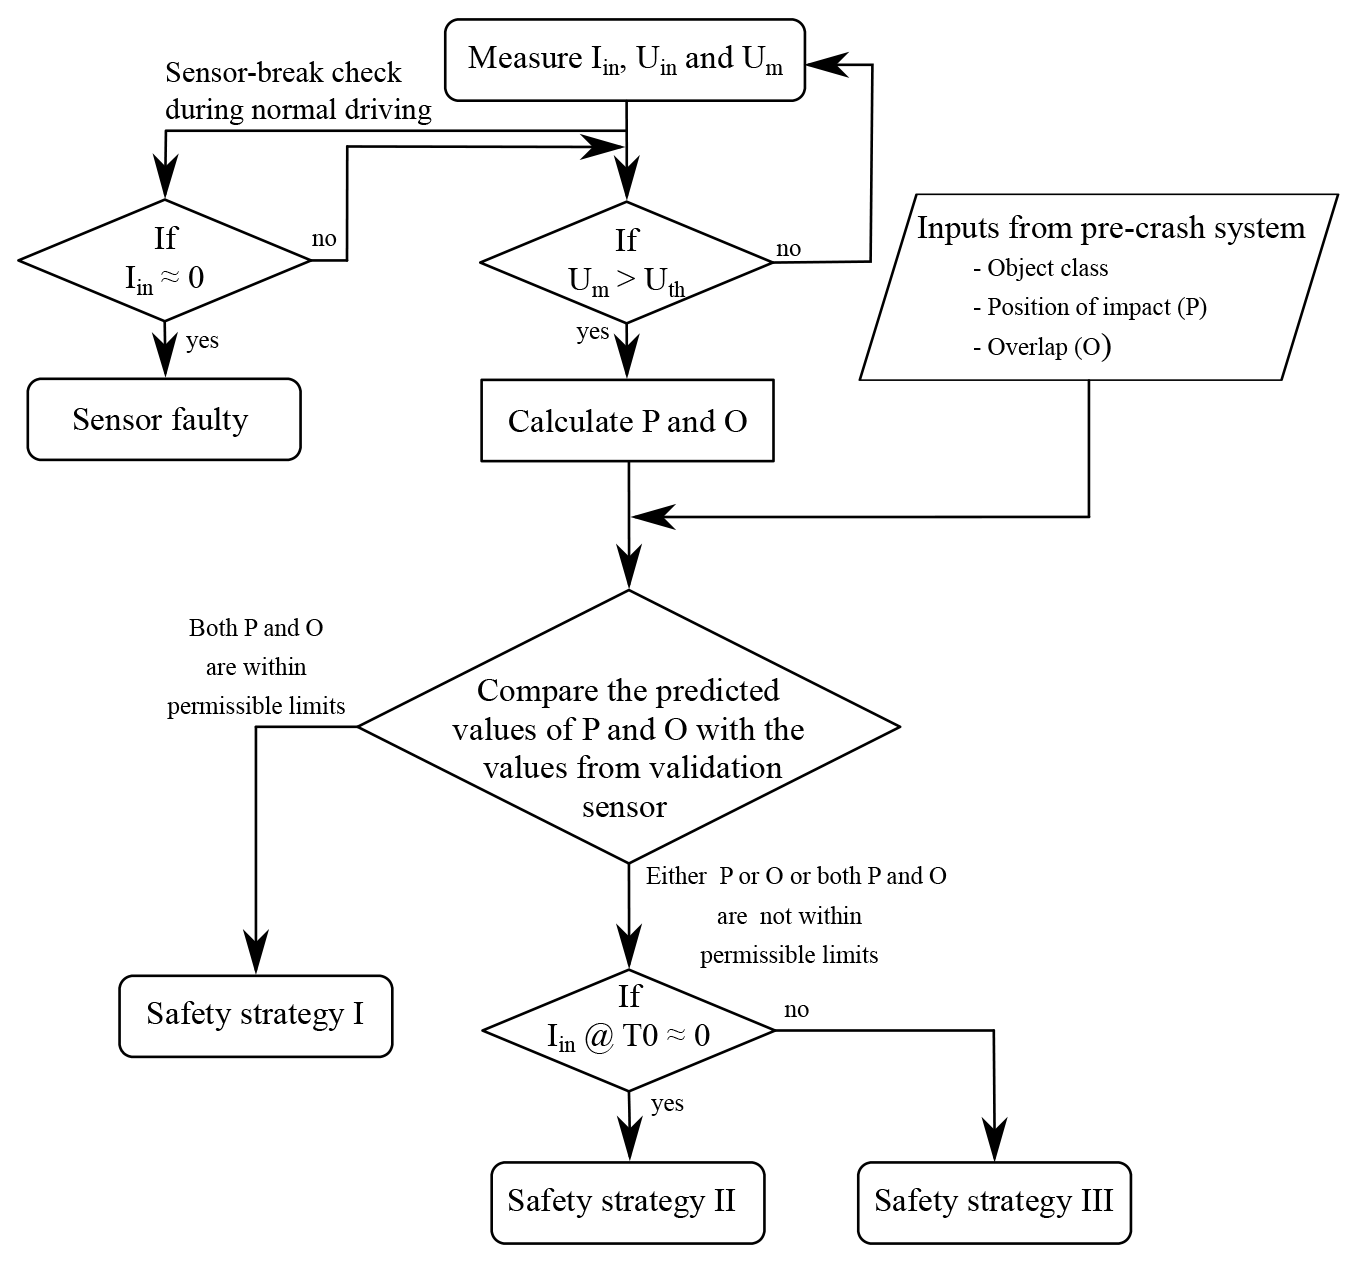
Figure 11 describes the algorithm for activating the occupant restraint systems using a predictive crash detection system with a validation sensor. This algorithm focuses only on the part with the validation sensor. The pre-crash system provides different inputs which are to be validated. The raw signals Uin, Iin and Um are measured with the help of a microcontroller at high sampling frequency (at least 10 kHz) to ensure the required response time. The controller checks regularly for the Iin≈0 condition. A failure of sensor functionality by mechanical influences like breakage can be detected by monitoring Iin. If the value is approximately equal to zero, it signifies a breakage of the current path in the high resistive layer. In this case, a message to visit the service center should be displayed. The controller performs a conditional check on the measured value of Um at predefined time intervals. If this value is above the threshold value Uth, it signifies the contact of the high resistive with low resistive layer. This correlates with the crash event. As soon as Um crosses the threshold, the microcontroller calculates the value of position P and overlap O. The position value P measured at the time instance corresponding to the first considerable change in slope after T0 (shown by point 1 in Fig. 9c) is considered for validation. If the difference between the measured position value and predicted value is within acceptable limits, then the validation of the position value is considered positive, otherwise it is considered negative. The overlap O development curve from T0 up to some fixed time Top is compared with the predicted overlap development (an example method for comparison is explained in Sect. 6.3). If this comparison is within the acceptable limits, then the validation is positive. The sensor design should be optimized in such a way that the sensor should not break in a worst-case crash scenario (for example, a crash with highest possible velocity against a rigid object) up to the above fixed time Top. If the validation for both position and overlap development is positive, the safety strategy I (see Fig. 11), based on the validated crash parameters from pre-crash sensors, can be activated. If the difference for either the position, overlap or both is not within the acceptable limits, the information cannot be validated. A sensor-break check for the current values at timestamp near predicted T0 is performed. If the sensor-break check is positive, either one or both sensors (forward looking and validation) could be faulty, in which case it is not possible to decide which sensor to trust. Hence, the safest solution is to use a safety strategy II, i.e., the use of a fallback system, and wait for the response from conventional crash sensors to detect and classify the crash event. When the sensor-break check is negative, the safety strategy III could consider the confidence level of the signals. As illustrated by the results from the tests, the validation sensor has high accuracy in position estimation, while overlap cannot be estimated with high accuracy. Hence, a high confidence level can be given to the position signal of the validation sensor when compared to forward-looking sensors. Similarly, different confidence levels can be allotted to the signals from different senors, and a respective safety strategy can be planned.
The pendulum experiments and crash test performed prove the concept, functionality and robustness of the CFRP-based validation sensor. The following points can be concluded:
-
The results from the crash test demonstrate the capability of this sensor to detect the crash situation at T0, which fulfills the requirement for the ultimate aim to activate occupant restraint systems at T0.
-
The sensor also provides information about the position. The accuracy of the position estimation is better than the pressure-hose sensor (the only presently used sensor which can give information on position).
-
In addition, the sensor gives information about the overlap. The average relative error of the overlap estimation is comparatively high. The overlap information is intended to be used to verify the classified objects. This task does not require high accuracy of overlap estimation for the validation of the object class from the object classification algorithm of the pre-crash system.
-
One of the important features of this sensor is the ability to implement a fail-safe check. This function is one of the most important for meeting the ASIL-D requirement.
-
The measuring principle of the validation sensor is relatively simple, and the computation requires very few resources.
The prototype was manufactured manually in the laboratory. One of the challenges of the concept discussed above is mass-scale production for incorporating the validation sensor in the vehicle components. For the realization of the sensor in a series application, the design of the sensor along with the manufacturing process has to be optimized. The other challenge is the material selection, in that the sensor functions for the desired lifespan. The materials chosen, carbon fiber and stainless steel are oxidation and corrosion resistant. The study of the carbon-fiber contact under the temperature-cycle dither test and steady-state humidity and elevated-temperature dither test shows a negligible effect of ageing on carbon-fiber contact over a period of 10 million cycles of operation (Stinson and Sarro, 2002). However, the authors feel it is important to investigate the effects of ageing on the sensor over a longer period in order to optimize its functionality. These investigations are planned as part of the next development phase for series application. In this paper, a conceptual algorithm for predictive crash detection with validation is described. Some of the parameters of this algorithm, like the confidence level of sensors and methodology to utilize overlap information and its validation, for example, should be studied in detail. The aspects mentioned above are planned by the authors to be future research work.
The data that support the findings of this study are available from authors, but restrictions apply to the availability of these data, which were used under license for the current study and are thus not publicly available. Data are, however, available from the authors upon reasonable request.
The main concept of the validation sensor was a result of the discussions between GS, UJ and TB. As the main author, GS manufactured the prototypes, planned and performed all the experiments, carried out data processing and analysis, and drafted the paper. RL helped in deriving the conclusions from the data and with structuring and writing some sections of the paper. UJ and TB discussed experimental results and supervised the equations derived and drafting the paper.
The authors declare that they have no conflict of interest.
This article is part of the special issue “Sensors and Measurement Systems 2018”. It is a result of the “Sensoren und Messsysteme 2018, 19. ITG-/GMA-Fachtagung” conference in Nürnberg, Germany, from 26 June 2018 to 27 June 2018.
The authors are grateful to Duy-Giap Tran (laboratory engineer) and
Christopher Ruzok (crash engineer) for their support. This work is supported
under the funding program Forschung an Fachhochschulen of the German Federal
Ministry of Education and Research (BMBF) under contract number 13FH7I03IA
(SAFIR IP3).
Edited by: Eric
Starke
Reviewed by: two anonymous referees
Andres, M., Feil, P., Menzel, W., Bloecher, H., and Dickmann, J.: 3D Detection of Automobile Scattering Centers using UWB Radar Sensors at 24/77 GHz, IEEE Aero. El. Sys. Mag., 28, 20–25, https://doi.org/10.1109/MAES.2013.6495649, 2013. a
Brandmeier, T., Feser, M., Jacob, S., Paggel, J., Saulich, S., and Spannaus, P.: Vorrichtung zur Detektion der Charakteristik eines Aufpralls auf ein Kraftfahrzeug, available at: https://patents.google.com/patent/EP2279100A1/de (last access: 2 August 2018), 2008. a, b
Broßeit, P., Rapp, M., Appenrodt, N., and Dickmann, J.: Probabilistic Rectangular-Shape Estimation for Extended Object Tracking, in: 2016 IEEE Intelligent Vehicles Symposium (IV), 19–22 June 2016, 279–285, https://doi.org/10.1109/IVS.2016.7535398, 2016. a
Chan, C.-Y.: On the Detection of Vehicular Crashes – System Characteristics and Architecture, IEEE T. Veh. Technol., 51, 180–193, https://doi.org/10.1109/25.992078, 2002. a, b
Chitnis, K., Mody, M., Swami, P., Sivaraj, R., Ghone, C., Biju, M. G., Narayanan, B., Dutt, Y., and Dubey, A.: Enabling Functional Safety ASIL Compliance for Autonomous Driving Software Systems, Electronic Imaging, 2017, 35–40, https://doi.org/10.2352/ISSN.2470-1173.2017.19.AVM-017, 2017. a
Coelingh, E., Eidehall, A., and Bengtsson, M.: Collision Warning with Full Auto Brake and Pedestrian Detection – a Practical Example of Automatic Emergency Braking, in: 2010 13th International IEEE Conference on Intelligent Transportation Systems, 155–160, IEEE, 19–22 September, Funchal, https://doi.org/10.1109/ITSC.2010.5625077, 2010. a, b
Dirndorfer, T.: Integrale Nutzung von Pre-Crash-Sensorik zur Ansteuerung frontaler Rückhaltesysteme im Fahrzeug – Möglichkeiten und Grenzen, in: Audi Dissertationsreihe, Cuvillier Verlag, Göttingen, 2015. a
Eidehall, A. and Gustafsson, F.: Combined Road Prediction and Target Tracking in Collision Avoidance, in: 2004 IEEE Intelligent Vehicles Symposium, 14–17 June, pp. 619–624, IEEE, https://doi.org/10.1109/IVS.2004.1336455, 2004. a, b
Eidehall, A., Pohl, J., and Gustafsson, F.: Joint Road Geometry Estimation and Vehicle Tracking, Control. Eng. Pract., 15, 1484–1494, https://doi.org/10.1016/j.conengprac.2007.02.010, 2007. a, b
European Union: Road Safety in the European Union – Trends, Statistics and Main Challenges, https://doi.org/10.2832/060333, 2018. a
Feser, M., McConnell, D., Brandmeier, T., and Lauerer, C.: Advanced Crash Discrimination using Crash Impact Sound Sensing (CISS), in: SAE Technical Paper Series, SAE International, Warrendale, PA, https://doi.org/10.4271/2006-01-1590, 2006. a, b
German Insurance Association: Accidents Statistics and the Potential of Driver Assistance Systems, 2014. a
Hasirlioglu, S., Kamann, A., Doric, I., and Brandmeier, T.: Test Methodology for Rain Influence on Automotive Surround Sensors, in: 19th International Conference on Intelligent Transportation Systems (ITSC), 1–4 November, 2242–2247, IEEE, Piscataway, NJ, https://doi.org/10.1109/ITSC.2016.7795918, 2016. a
Huang, M.: Vehicle Crash Mechanics, available at: https://books.google.de/books?id=QYHLBQAAQBAJ (last access: 7 November 2018), CRC Press, Florida, 2002. a, b
Infineon Technologies AG: New Applications for Integrated Pressure Sensors: Application Note, available at: https://www.infineon.com/dgdl/New+Applications+for+Integrated+Pressure+Sensors_Rev1.1.pdf?fileId=db3a3043345a30bc01345fef695e31b3 (last access: 8 November 2018), 2011. a, b
Kendall, J. and Solomon, K.: Airbag Deployment Criteria: Institute of Risk & Safety Analyses, The Forensic Examiner, 2014. a
Kogut, L. and Komvopoulos, K.: Electrical Contact Resistance Theory for Conductive Rough Surfaces, J. Appl. Phys., 94, 3153–3162, https://doi.org/10.1063/1.1592628, 2003. a
Lauerer, C.: Ein Beitrag zur Erhöhung des Insassenschutzes durch Körperschallmessung in der Crasherkennung, available at: https://books.google.de/books?id=QwtgmwEACAAJ (last access: 7 November 2018), 2010. a
Luo, X., Du, W., Li, H., Li, P., Ma, C., Xu, S., and Zhang, J.: Occupant Injury Response Prediction Prior to Crash Based on Pre-Crash Systems, in: SAE Technical Paper Series, SAE International, Warrendale, PA, https://doi.org/10.4271/2017-01-1471, 2017. a
Mathworks, I.: 1-D median filtering, available at: https://de.mathworks.com/help/signal/ref/medfilt1.html (last access: 8 November 2018), 2015. a
Pipkorn, B.: Crash Sensing and Algorithm Development for Frontal Airbag Systems Using CAE Methods and Mechanical Tests, in: SAE Technical Paper Series, SAE International, Warrendale, PA, https://doi.org/10.4271/2004-01-1633, 2004. a
Rasshofer, R. H. and Gresser, K.: Automotive Radar and Lidar Systems for Next Generation Driver Assistance Functions, Adv. Radio Sci., 3, 205–209, https://doi.org/10.5194/ars-3-205-2005, 2005. a, b
Slade, P.: Electrical Contacts: Principles and Applications, Second Edn., available at: https://books.google.de/books?id=N7LMBQAAQBAJ (last access: 9 November 2018), CRC Press, Florida, 2013. a
Speth, T., Kamann, A., Brandmeier, T., and Jumar, U.: Precise Relative Ego-Positioning by Stand-Alone RTK-GPS, in: WPNC'16, 1–6, IEEE, Piscataway, NJ, https://doi.org/10.1109/WPNC.2016.7822852, 2016. a
Statistisches Bundesamt: Verkehrsunfälle: Fachserie 8 Reihe 7, available at: https://www.destatis.de/DE/Publikationen/Thematisch/TransportVerkehr/Verkehrsunfaelle/VerkehrsunfaelleJ2080700167004.pdf?__blob=publicationFile (last access: 5 August 2018), 2016. a
Stein, G. P., Mano, O., and Shashua, A.: Vision-based ACC with a Single Camera: Bounds on Range and Range Rate Accuracy, in: 2003 IEEE Intelligent Vehicles Symposium (IV), 9–11 June, 120–125, IEEE, https://doi.org/10.1109/IVS.2003.1212895, 2003. a
Steinemann, P., Klappstein, J., Dickmann, J., Wünsche, H.-J., and v. Hundelshausen, F.: Determining the Outline Contour of Vehicles in 3D-LIDAR-Measurements, in: 2011 IEEE Intelligent Vehicles Symposium (IV), 5–9 June, 479–484, https://doi.org/10.1109/IVS.2011.5940498, 2011. a
Stinson, R. F. and Sarro, J. A.: The Use of Carbon Fiber Composites in Sliding Contacts, in: Proceedings of the Forty-Eighth IEEE Holm Conference on Electrical Contacts, 23 October, 175–183, https://doi.org/10.1109/HOLM.2002.1040839, 2002. a
Weitzel, D. A., Winner, H., Peng, C., Geyer, S., Lotz, F., and Sefati, M.: Absicherungsstrategien für Fahrerassistenzsysteme mit Umfeldwahrnehmung: Bericht zum Forschungsprojekt FE 82.0546/2012, in: Berichte der Bundesanstalt für Straßenwesen Fahrzeugtechnik, Fachverl. NW, Bremen, available at: http://bast.opus.hbz-nrw.de/volltexte/2015/836/pdf/F98b.pdf (last access: 18 August 2018), 2014. a
- Abstract
- Introduction
- Present crash detection sensors for frontal crash
- Predictive crash detection concept
- Concept of CFRP-based validation sensor
- Pendulum experiments
- Crash test
- Algorithm for activation of restraint systems
- Summary and outlook
- Data availability
- Author contributions
- Competing interests
- Special issue statement
- Acknowledgements
- References