the Creative Commons Attribution 4.0 License.
the Creative Commons Attribution 4.0 License.
 | 07 May 2019
Employing correlation for wireless components and device characterization in reverberation chambers
Christoph Cammin
Dmytro Krush
Ralf Heynicke
Gerd Scholl
Reverberation chambers are well-proven test environments for radio frequency (RF) measurements. Typically, mean values are taken from the measurements to characterize the equipment under test. In the novel approach presented in this paper, the correlation of measured sample sequences is utilized to detect deviations, in particular of the radiation characteristics, from reference equipment. This approach is exemplified by a measurement setup using several different antennas with the same housing. The complex correlation coefficient and the correlation coefficient with respect to the transferred power of two measured sample sequences are calculated and evaluated for a suitable frequency range to detect differences between the radiation characteristics.


Reverberation chambers (RCs) are suggested as reproducible test environments for electromagnetic compatibility (e.g., Schwab and Kürner, 2011; Deutsches Institut für Normung e.V. (DIN), 2011) and antenna and wireless module performance testing (e.g., Holloway et al., 2006; Kildal et al., 2012). RCs generally consist of an electromagnetically shielded volume with an equipment under test (EUT) inside, at least one fixed antenna for electromagnetic field excitation and at least one mode stirrer. The latter may be, e.g., mechanically moving or rotating mode stirrers or a turntable to modify the wave propagation inside the volume. Single measurements are performed for the various conditions provided by the mode stirrer(s). Over a full mode stirring sequence, the EUT is exposed to a stochastically quasi-isotropic and quasi-homogeneous electromagnetic field with Rayleigh-distributed magnitude. The mean value of the characteristic parameter is independent of the EUT's position and orientation (e.g., Deutsches Institut für Normung e.V. (DIN), 2011; Kostas and Boverie, 1991).
Usually, mean values are processed from the raw data captured in the RC, e.g., by averaging the individual measurement samples over the mode stirring sequence. So the exact chronological order of individual sample points within a time series is typically not relevant for the overall measurement result, such as the “total radiated power (TRP)”, “total isotropic sensitivity (TIS)”, or radiated emissions in general (e.g., 3GPP, 2017a, 2016; Deutsches Institut für Normung e.V. (DIN), 2011). As a consequence, the detailed radiation characteristics of an EUT like the polarization properties are not specified in a RC such that differences between the radiation characteristics of two EUTs remain undetected as the RC provides a quasi-isotropic field. Instead, only differences in mean radiated power or radiation efficiency can be detected.
Fabrication tolerances between two antennas or minor changes in the circuit placement inside the housing may affect the radiation characteristics. In the novel approach presented here, correlation between a succession of measurement samples of two sequences for different EUTs is employed in order to detect deviations between them, in particular, also differences in the radiation characteristics other than the radiation efficiency. Therefore, the RC measurements of a first EUT were stored and serve as a reference for subsequent measurements with different EUTs by correlating the measurement results. The new approach is exemplified with the help of a test setup. In this work measurements were performed for passive EUTs, in particular antennas. However, the approach can also be transferred to active EUTs, like wireless sensor/actuator nodes, or included in wireless test equipment (e.g., as presented in Cammin et al., 2018).
Various studies on correlation between the individual measurement series were performed, typically with the intention of estimating the uncertainty of RC measurements (e.g., Chen, 2013; Pirkl et al., 2012). In particular, commonly the number of individual samples is estimated by utilizing autocorrelation of a measurement sample sequence (e.g., Delangre et al., 2009; Pfennig, 2016). Spatial correlation and correlation between multiple ports of a multi-port antenna are important factors of influence for multiple-input multiple-output (MIMO) wireless devices, and therefore they need to be evaluated for comparable performance analysis and test scenarios (e.g., Kildal and Rosengren, 2004; Amador et al., 2011; Chen et al., 2011; Janssen et al., 2013; Gradoni et al., 2013; Chen and Kildal, 2015; 3GPP, 2017b). Nevertheless, to the authors' knowledge, no studies on sample correlation of similar or identically constructed EUTs have already been presented.
2.1 Measurement setup
The measurements presented in the following sections were performed in five trials (1 to 5) on different days. A vector network analyzer (VNA) was used to capture the sample sequences of complex-valued S21 parameters and was re-calibrated for every measurement trial. Each trial consisted of one full mode stirring sequence per EUT (antenna), resulting in a particular “sample sequence” for every antenna listed in Table 1.
The VNA (type: ZNB4, Rohde & Schwarz, 2019) was set to sweep over the frequency band from 2.4 to 2.5 GHz in 1001 frequency steps with a measurement bandwidth of 100 kHz and an output power of 0 dBm. The VNA was connected with port 1 at the outer connector of the RC to the fixed antenna and with port 2 at the connector of the EUT antenna, as shown in Fig. 1. The VNA was re-calibrated at the indicated calibration planes for every measurement trial.
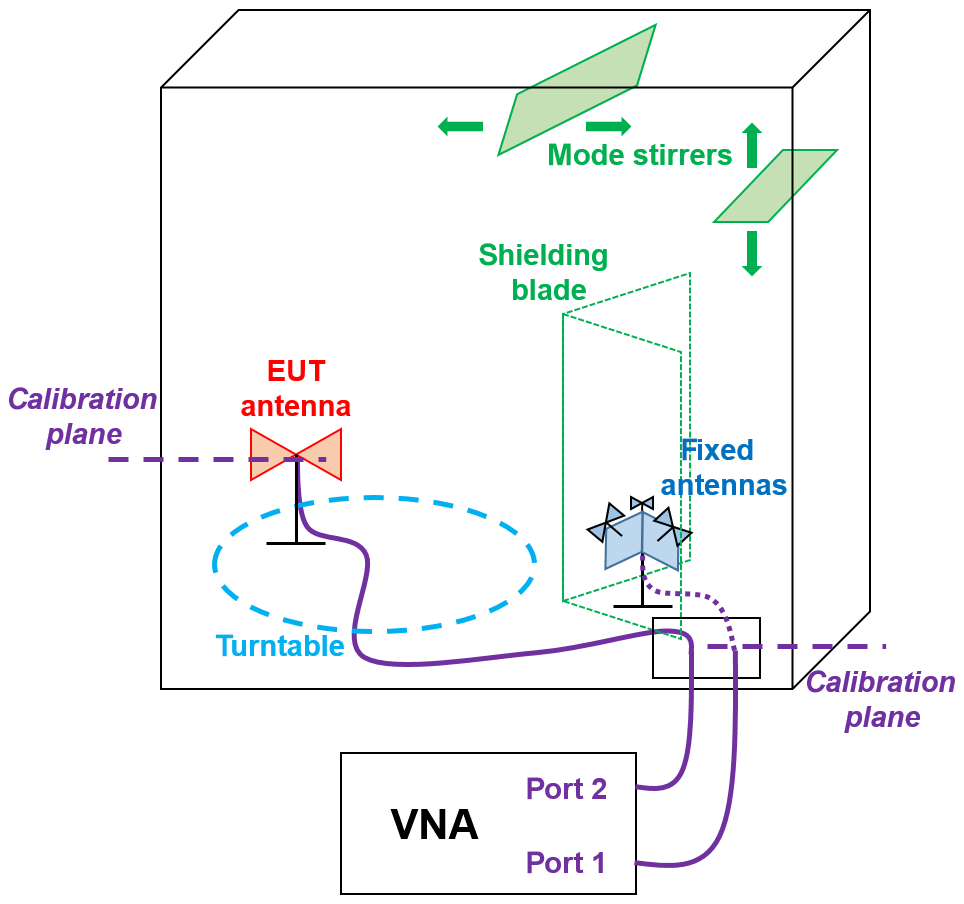
The measurements were all performed in a RTS60-type RC from the manufacturer Bluetest (datasheet: Bluetest AB, 2018). This RC has two translational moving mode stirrers (one at the side wall and one at the ceiling), a turntable for the EUT and three fixed antennas which are switched to excite different polarizations, as shown in Fig. 1. A shielding blade is mounted between the fixed antennas and the turntable in order to suppress a direct line-of-sight (LOS) path. A detailed explanation of the construction of this RC is also given in Kildal et al. (2012). The RC was stepwise operated with a total of 600 steps or, more specifically, combinations of fixed antennas and mode stirrer states. No absorbers were installed to load the RC. The RC has an exponentially decreasing power delay profile with a time constant τRMS≈200 ns, according to Cammin et al. (2017).
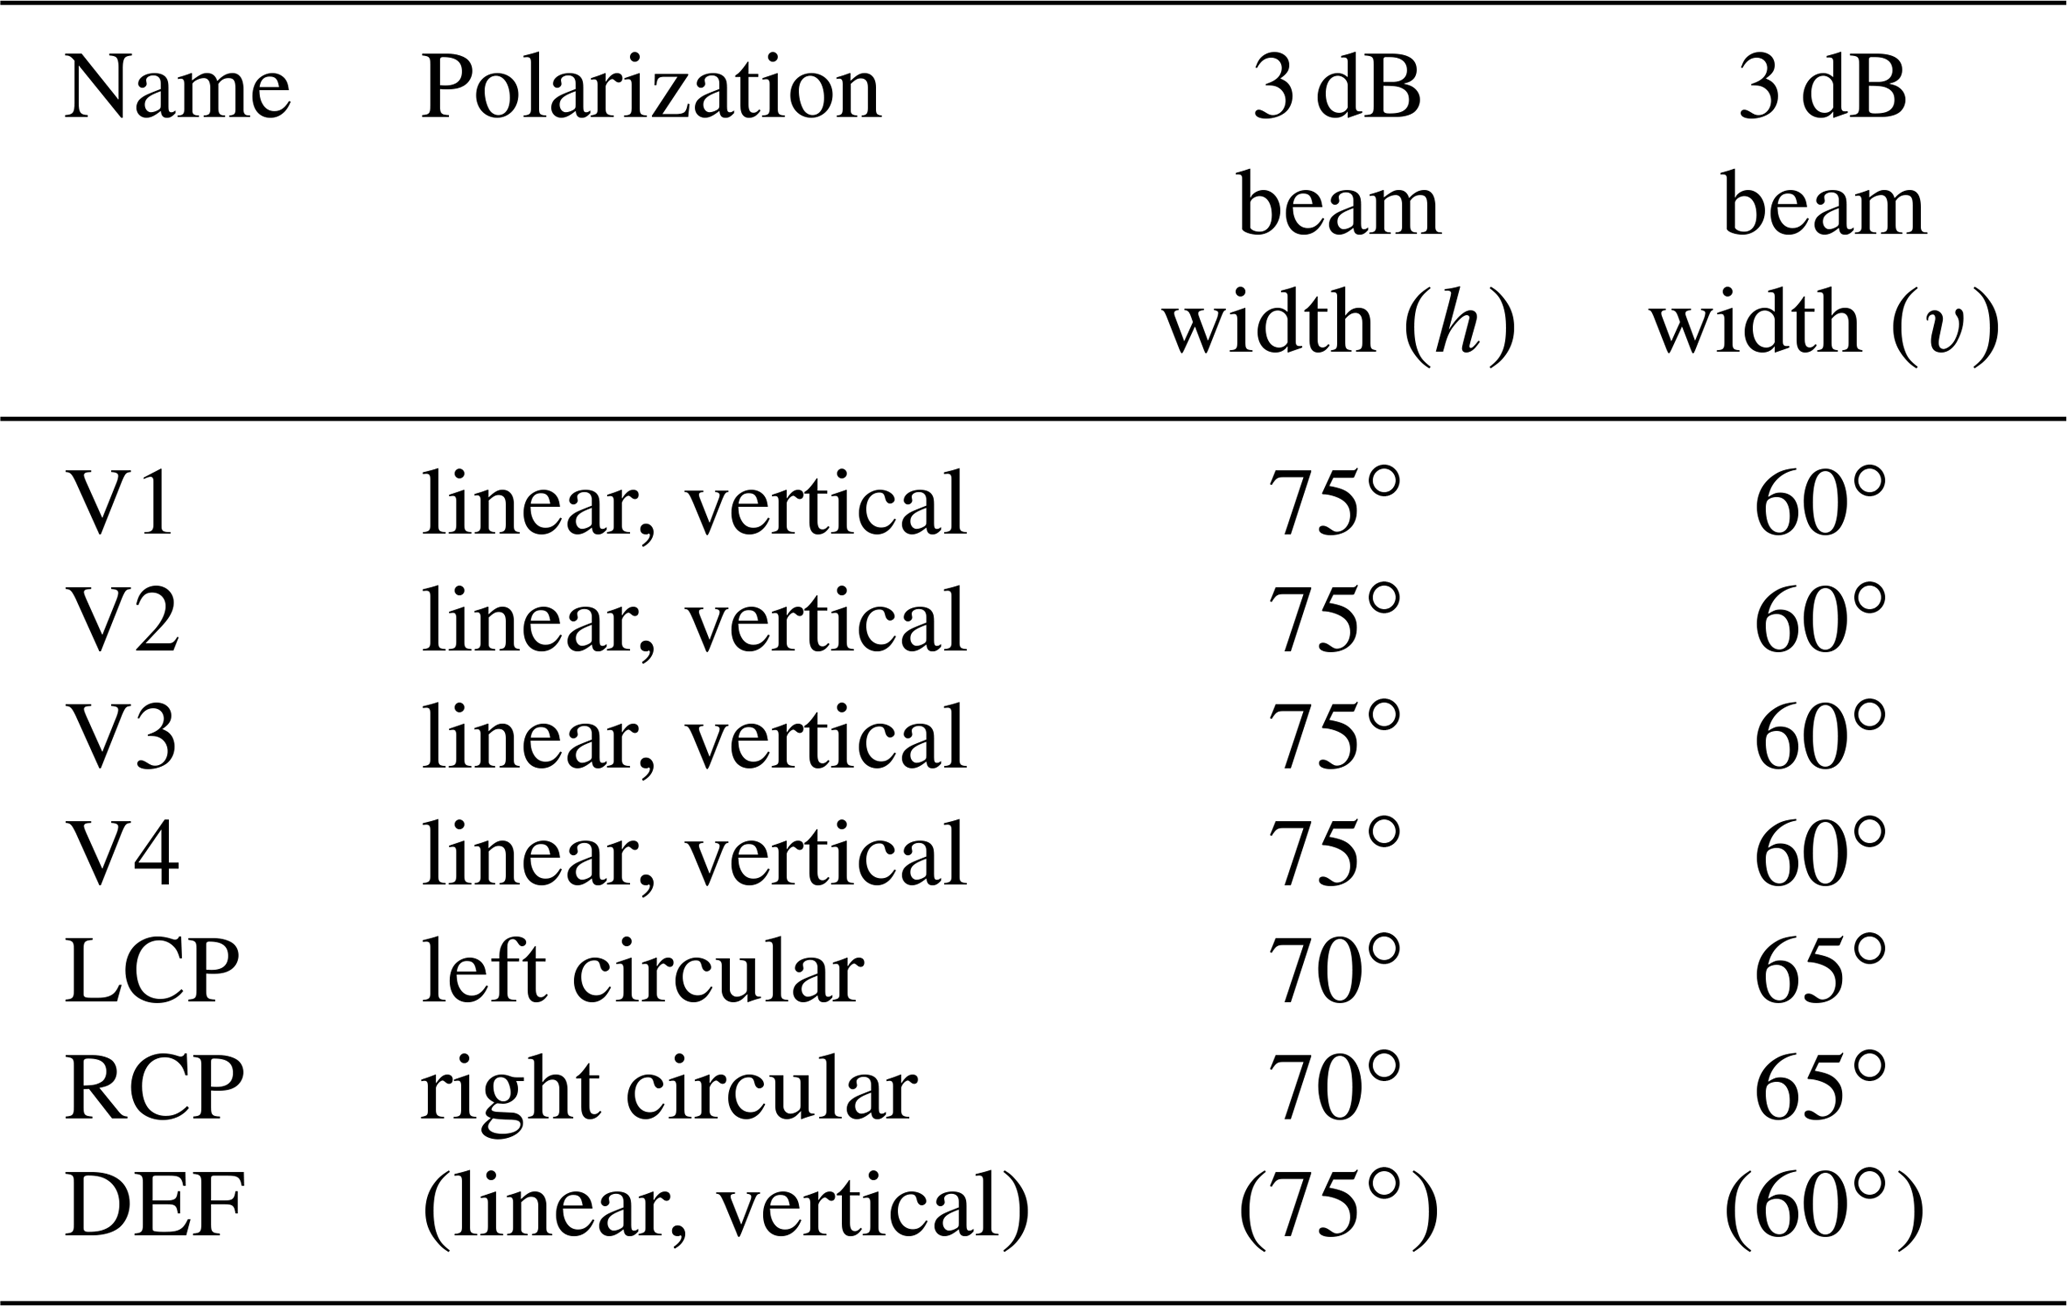
Different antennas were utilized as EUTs. All antennas originate from the same product family by Huber + Suhner, have the same casing and were mounted within the RC in the same orientation. As indicated in Table 1, antennas “V1” to “V4” are identically constructed vertically polarized types (datasheet: Huber + Suhner, 2019c). Antenna “LCP” is left circularly polarized (datasheet: Huber + Suhner, 2019a) and antenna “RCP” is right circularly polarized (datasheet: Huber + Suhner, 2019b). Antenna “DEF” is identical to antennas “V1” to “V4”, but the casing was intentionally opened and the cover in the radiation direction was removed. Therefore, it is treated as a defect antenna.
In the following sections, the complex-valued correlation coefficient with respect to the complex-valued S21 parameters, as well as the correlation coefficient with respect to the transferred power to the ith and jth antenna of two sample sequences, were calculated.
The definition of is given in Eq. (1), where n is the individual mode stirrer step (combination) and Ntotal=600 is the total number of steps (or step combinations). and are the S21 parameter for the nth mode stirrer step and antenna i or j, respectively, and represents its mean value over the mode stirring sequence. The (…)* indicates the complex conjugate and |…| represents the absolute value of their arguments, respectively.
The definition of with respect to the transferred power to the ith and jth antenna is given in Eq. (2), whereby n is the individual mode stirrer step (combination), Ntotal=600 is the total number of steps (or step combinations) and represents the mean value of |S21,i|2 over the mode stirring sequence for the ith antenna, respectively.
In order to distinguish easily between the two correlation coefficients, will be denoted “complex correlation coefficient”, whereas will be denoted “power correlation coefficient” in the following sections. Note that both correlation coefficients depend on frequency.
The approach to consider the power correlation coefficient in terms of transferred power has the advantage that it can also be applied for measurements of active devices (e.g., a wireless sensor/actuator node), which typically provide only a RSSI (received signal strength indication) value without any information on phase or reflections due to a mismatched antenna.
The mode stirring sequence and other settings such as the loading of the chamber were kept constant for all measurement trials. The antenna holder was kept in the same position during measurement trials 1 to 4. For measurement trial 5, the position of the antenna holder for the EUT antennas was changed on the turntable.
This section is subdivided into different parts, focusing on distinct configurations and corresponding measurements. In the following subsections the measured sample sequences are correlated within the trials with the same configuration and antenna holder position (either trials 1 to 4 or trial 5), as a modification causes decorrelation (e.g., Amador et al., 2011). (The values in the following tables are rounded to two digits after the decimal point.)
3.1 Identically constructed antennas within the same measurement trial
Within the scope of the proposed scenario, typically identically constructed EUTs will be considered within an associated measurement trial.
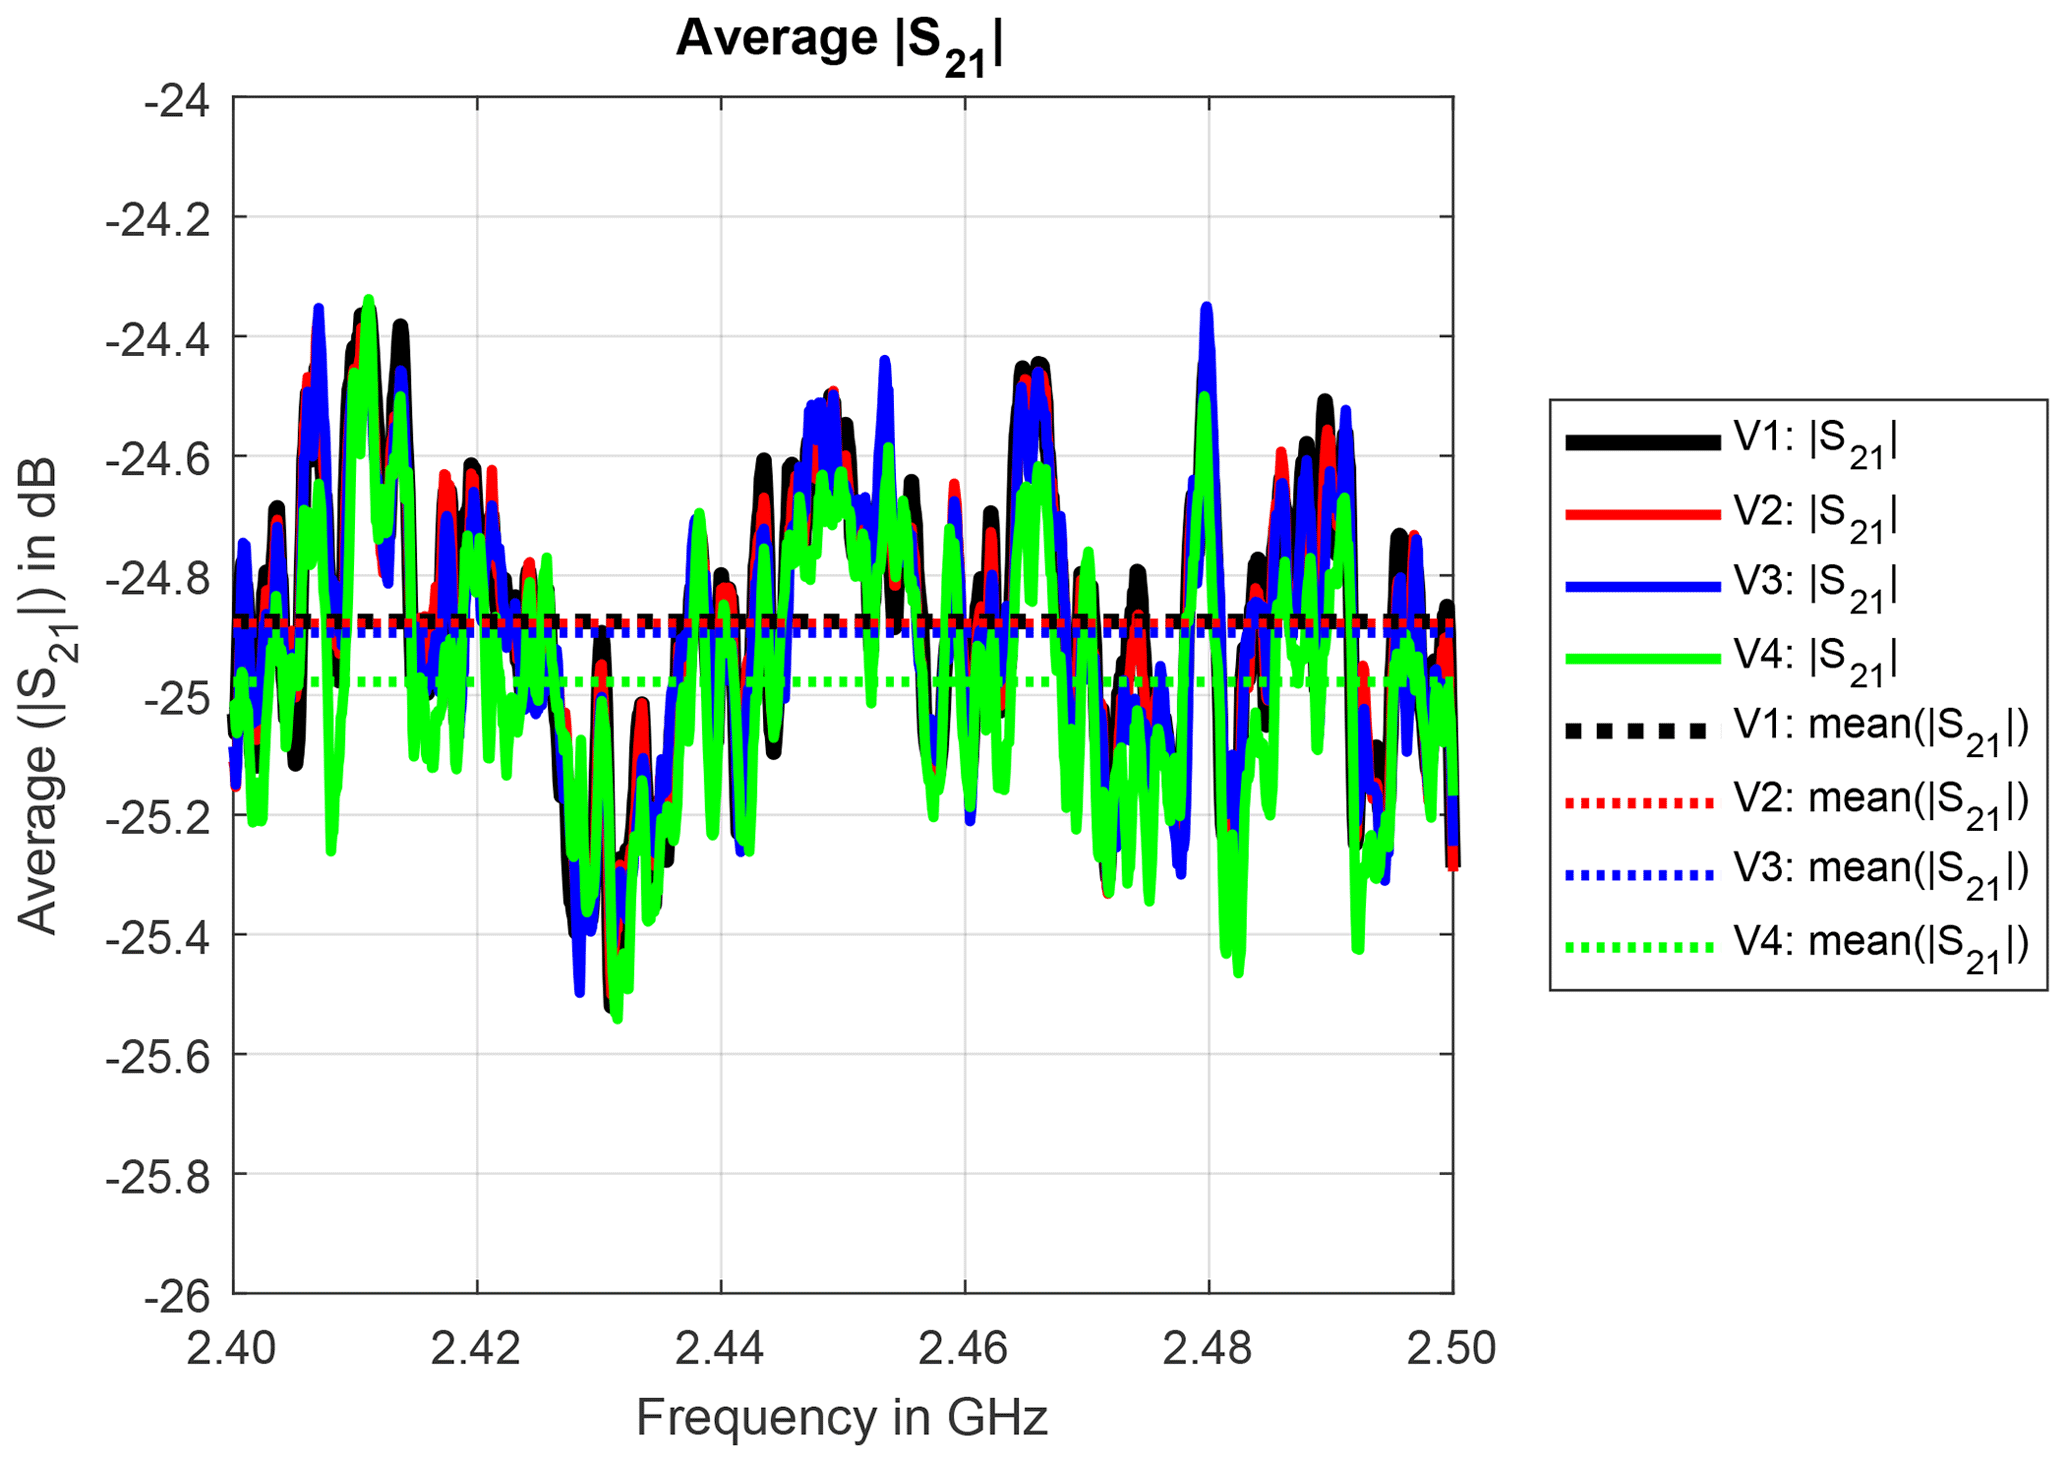
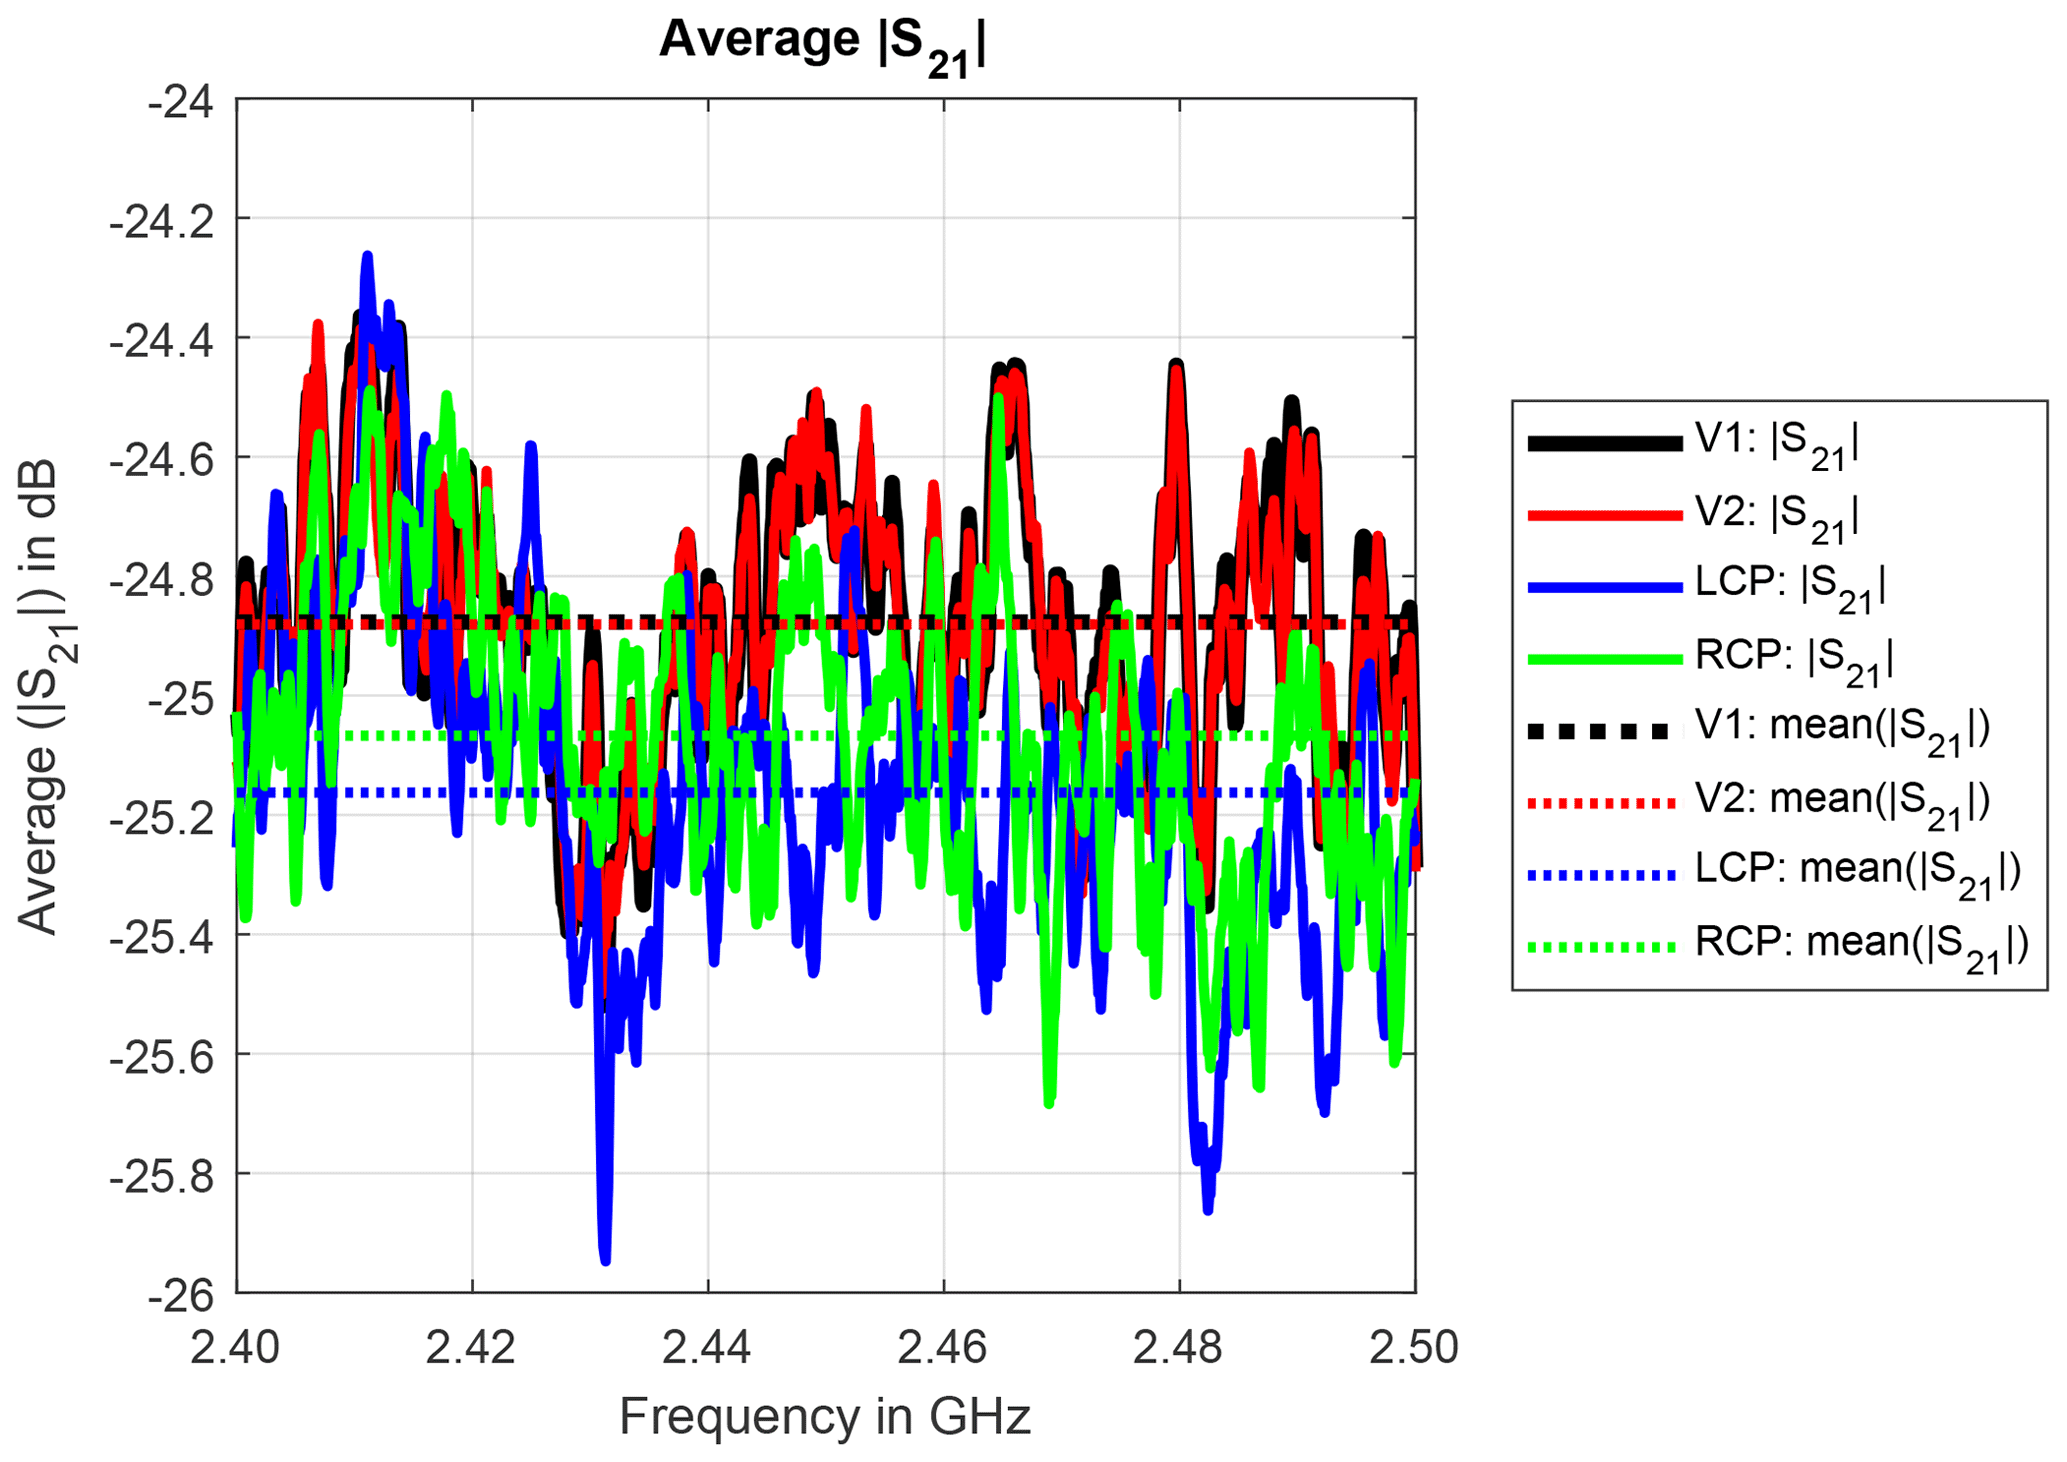
The magnitude of the average transmission over the full mode stirring sequence for the different antennas is exemplarily shown for measurement trial 4 in Fig. 2. Since the antennas are identically constructed, they exhibit nearly the same characteristics, in particular the same magnitude of the average transmission over the full mode stirring sequence. The mean values over frequency differ by less than 0.2 dB. Corresponding figures for the other measurement trials are not shown here as they essentially show the same behavior.
The real and imaginary parts of the complex correlation coefficients over frequency are shown in Figs. 3 and 4, respectively. As expected, the measured sample sequences for identically constructed antennas are highly correlated: the real part of the complex correlation coefficients is close to 1 and independent of the frequency. The imaginary part is almost 0 and also independent of the frequency. This can be interpreted as no difference in the phases of the underlying sequence of complex-valued S21 parameters.
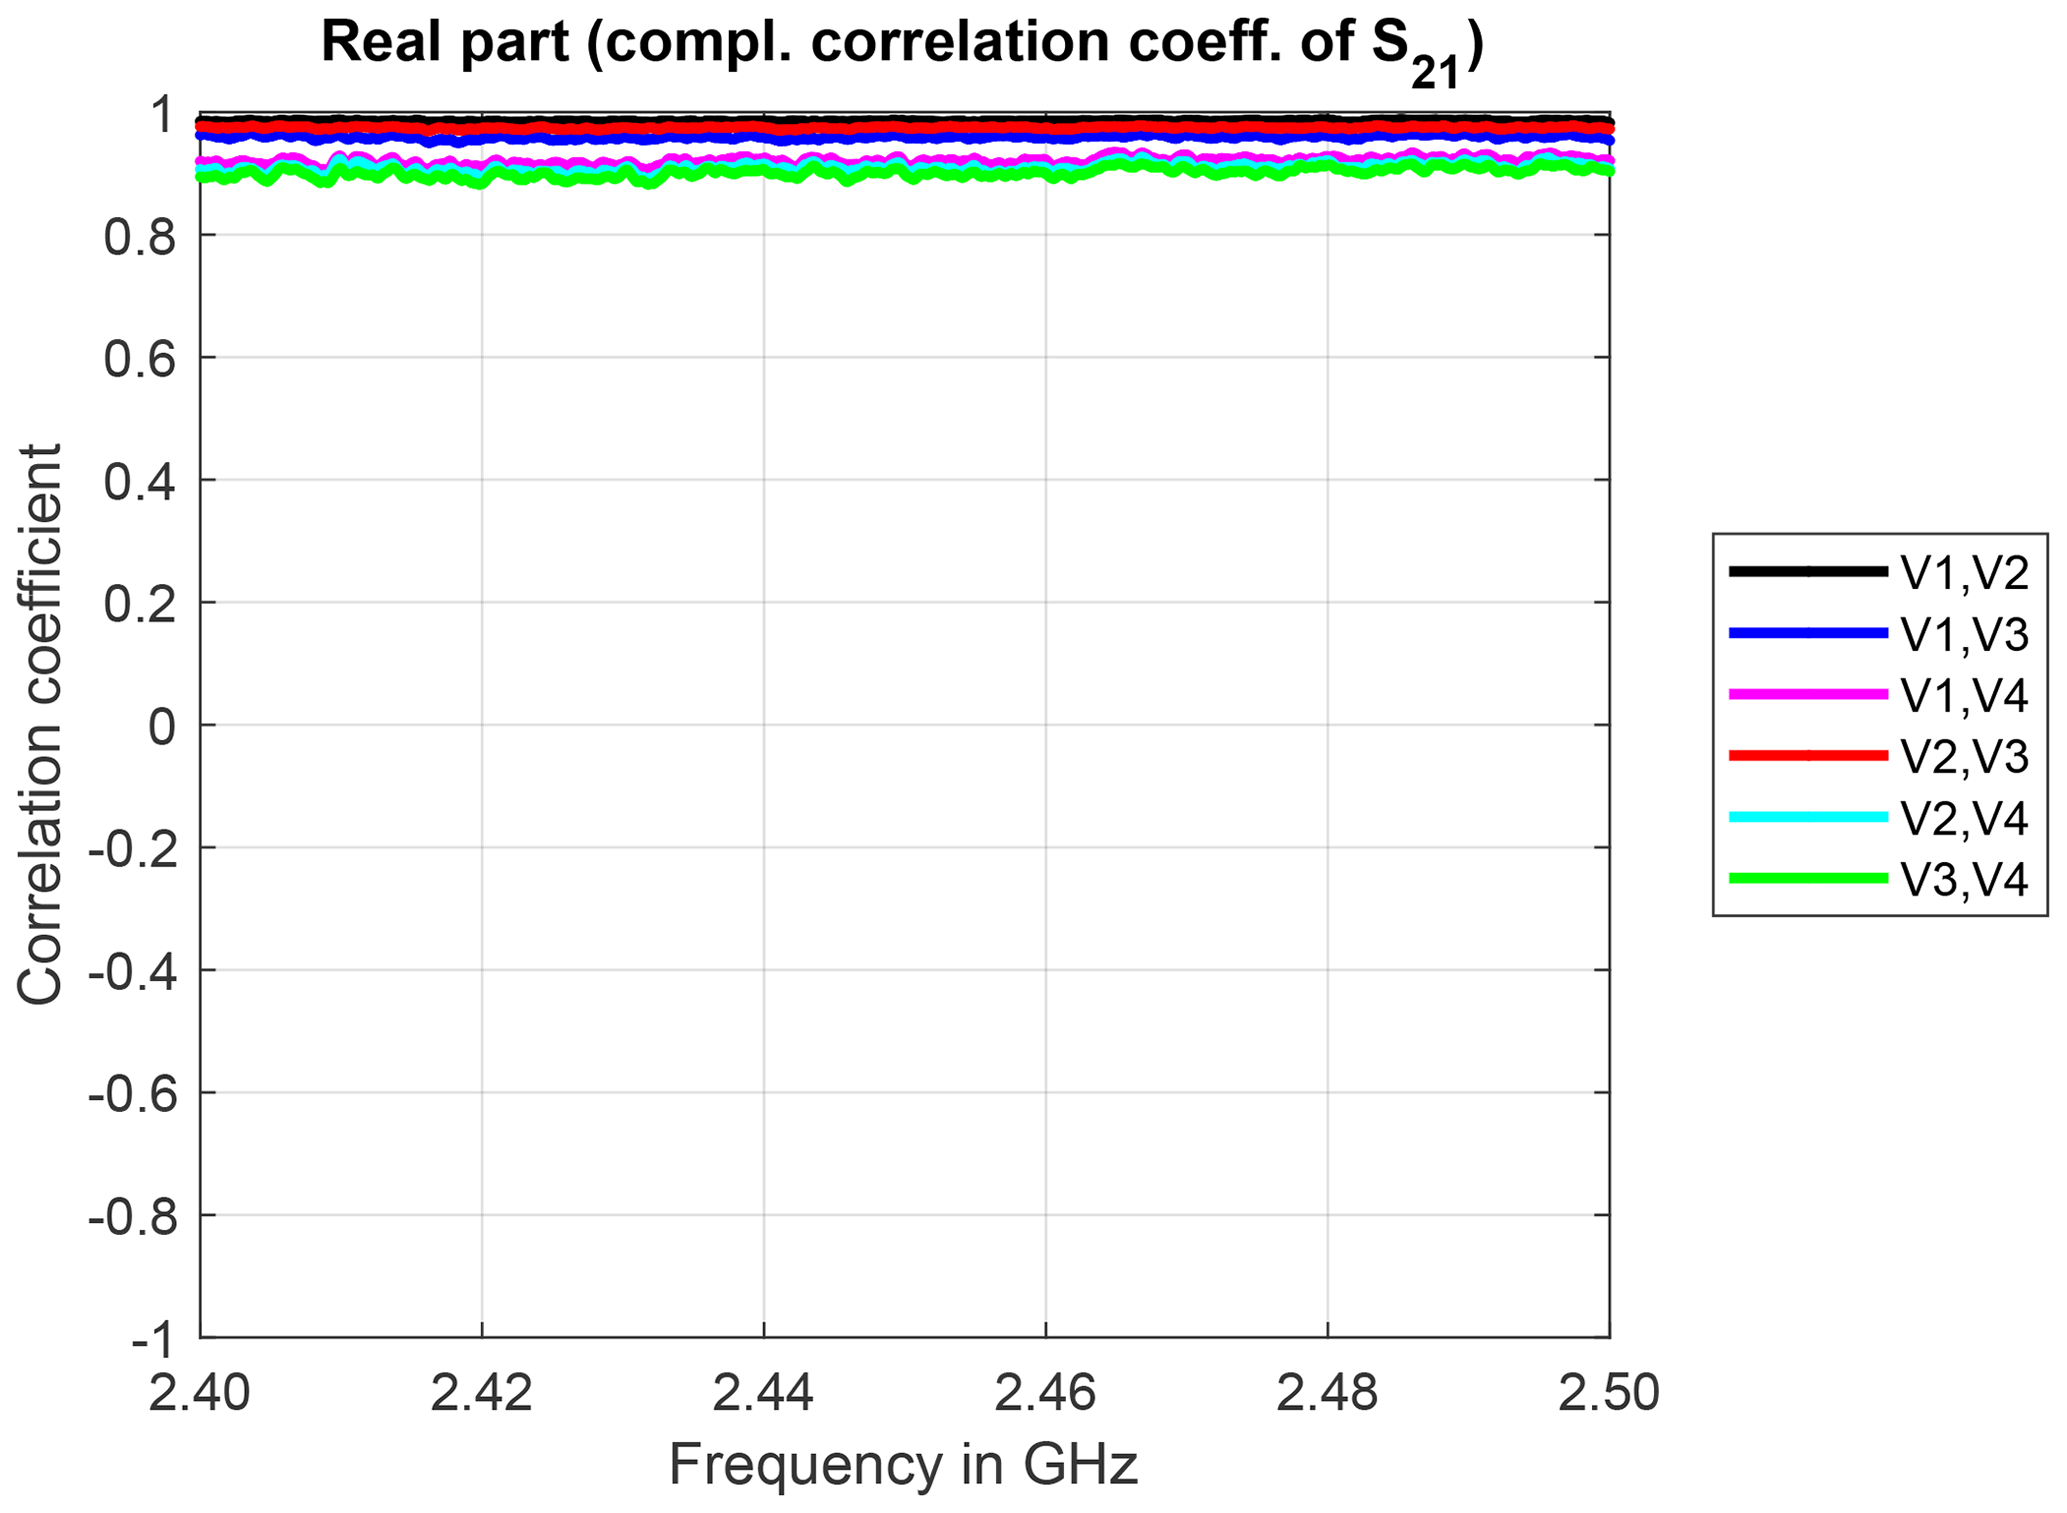
Figure 3Real part of the complex correlation coefficients for identically constructed antennas and measurement trial 4.
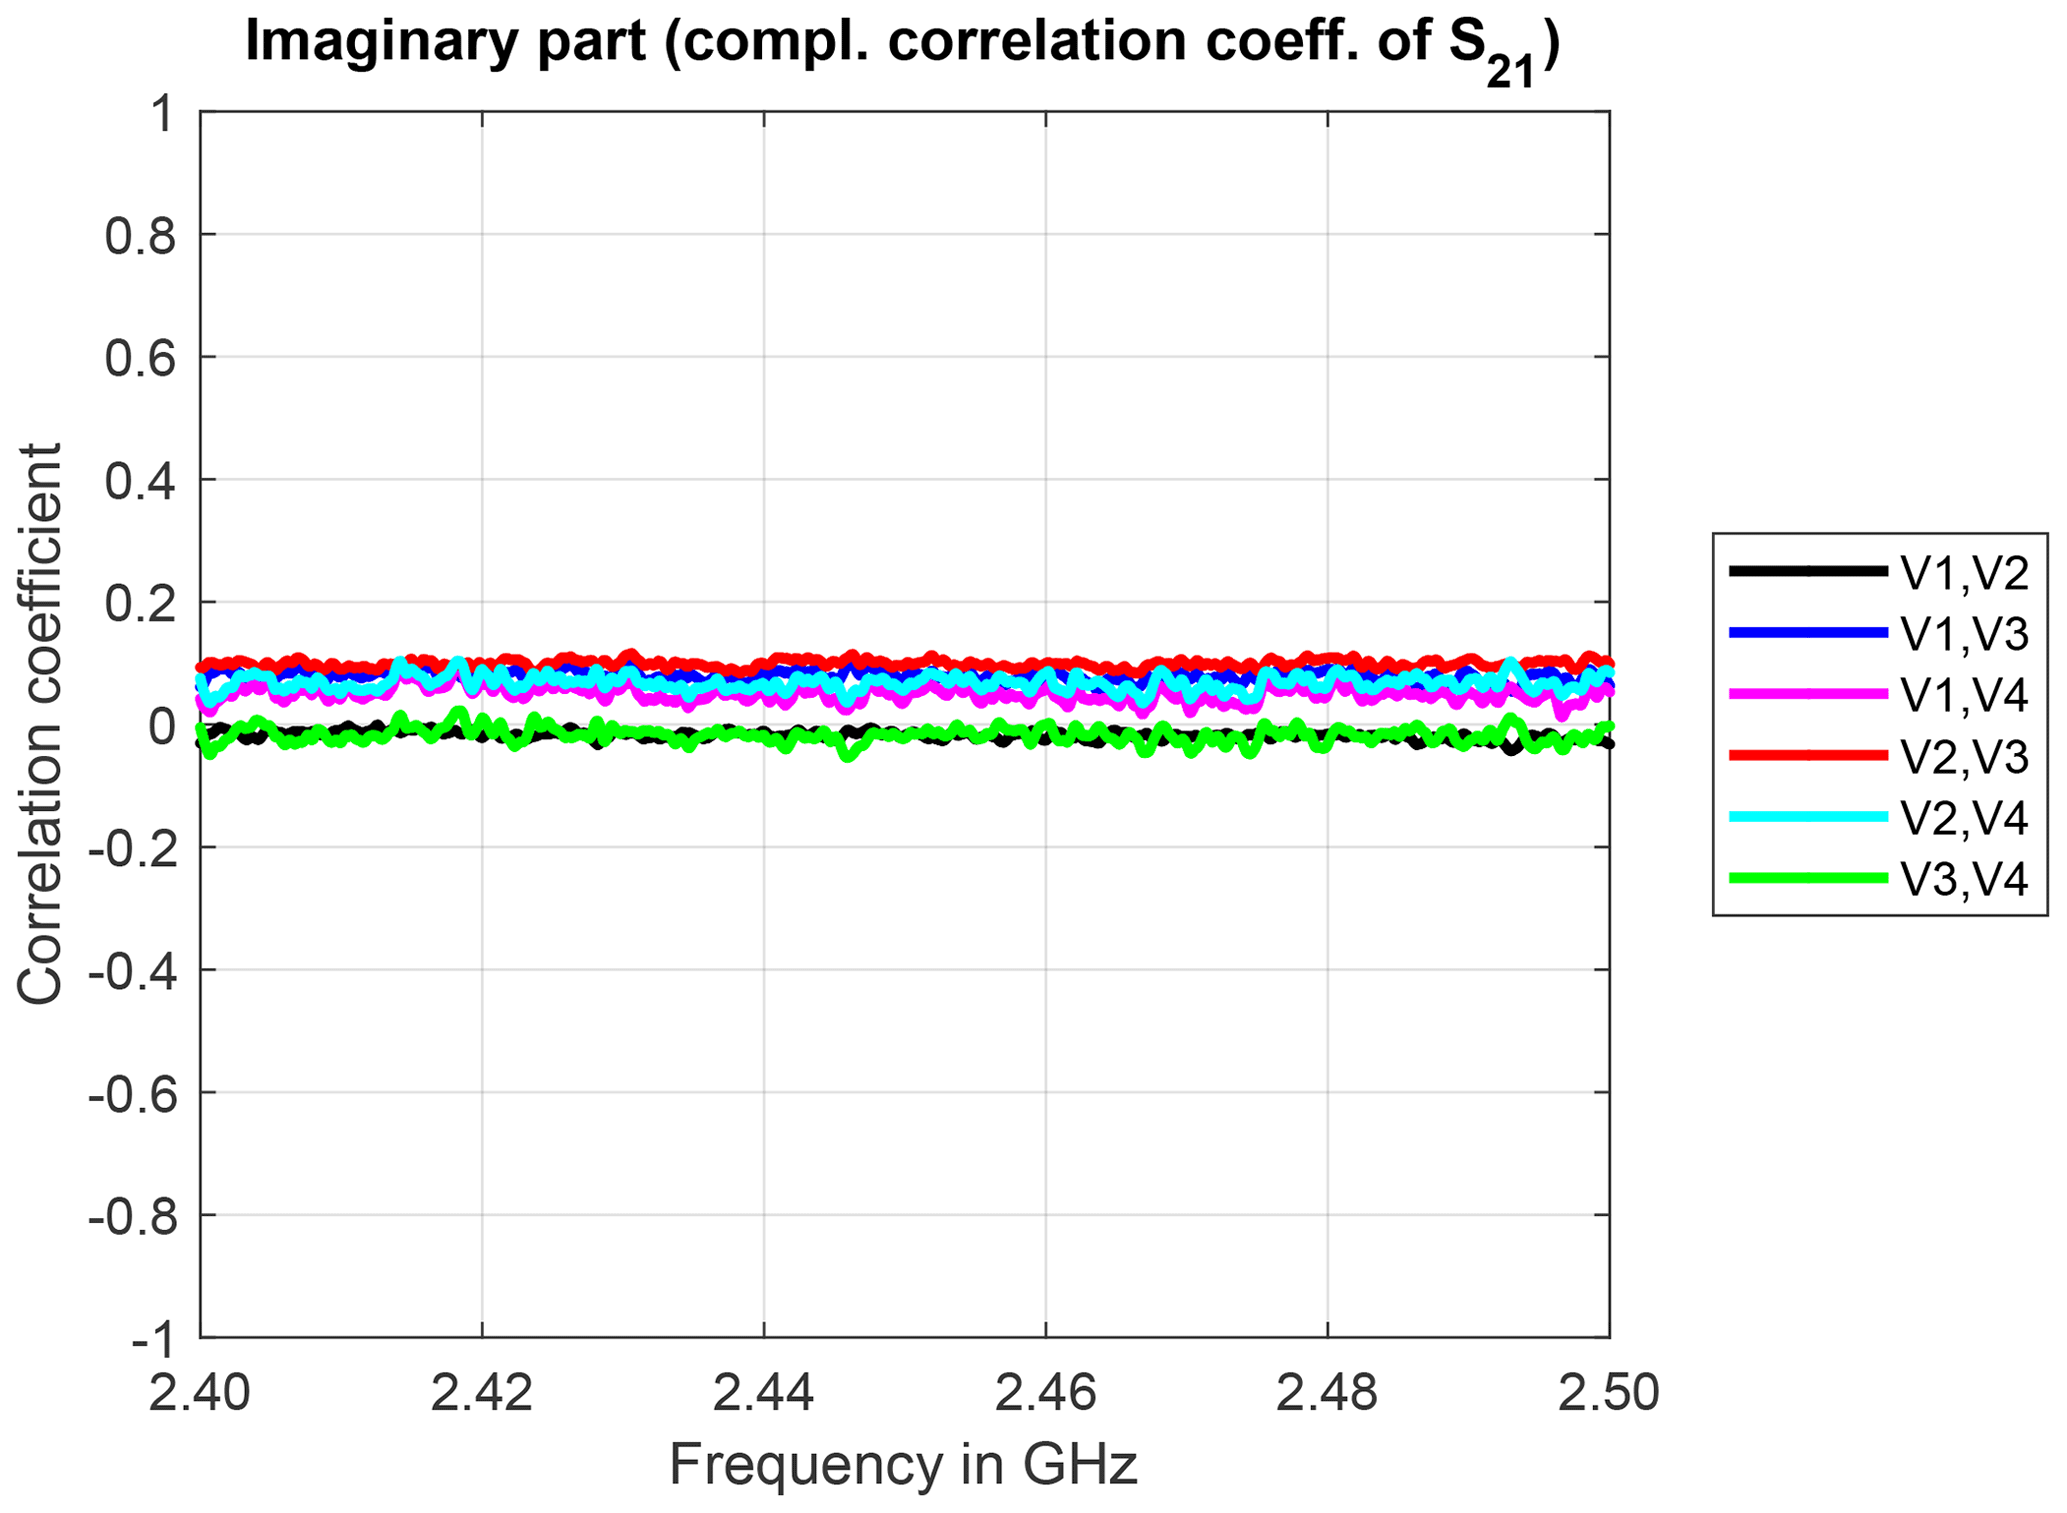
Figure 4Imaginary part of the complex correlation coefficients for identically constructed antennas and measurement trial 4.
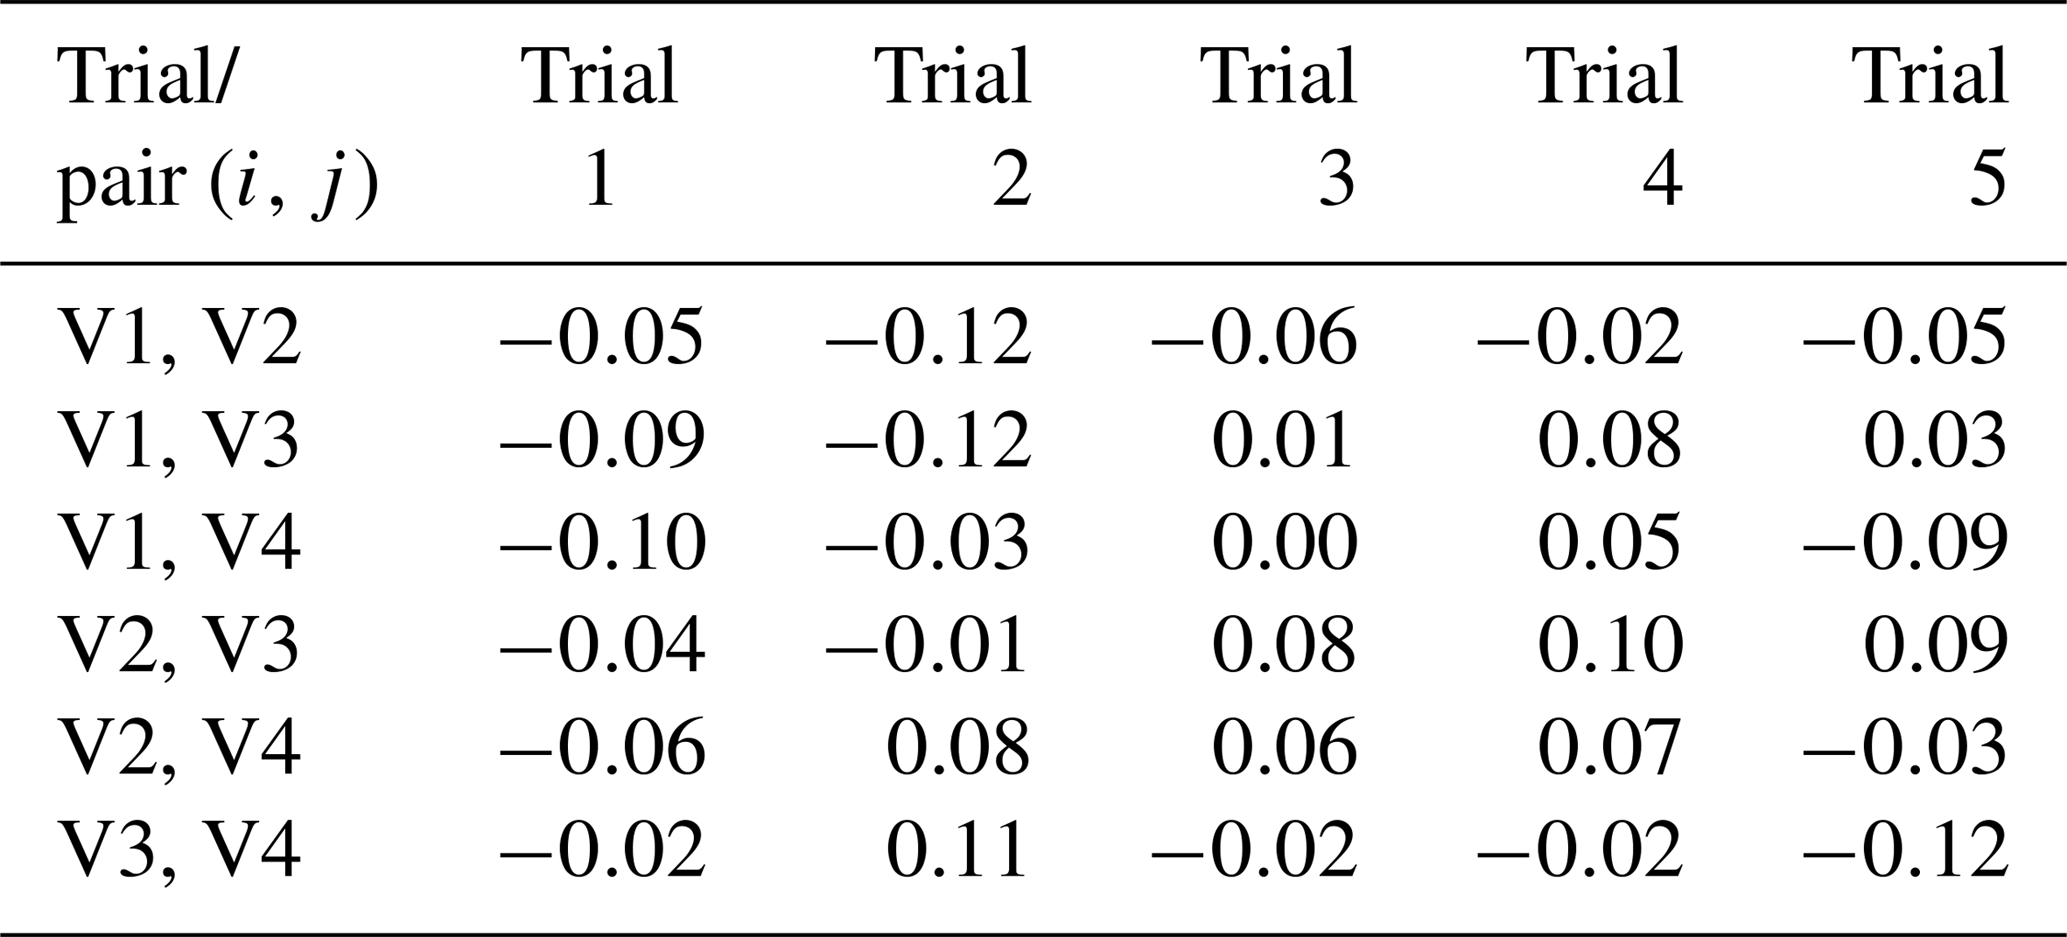
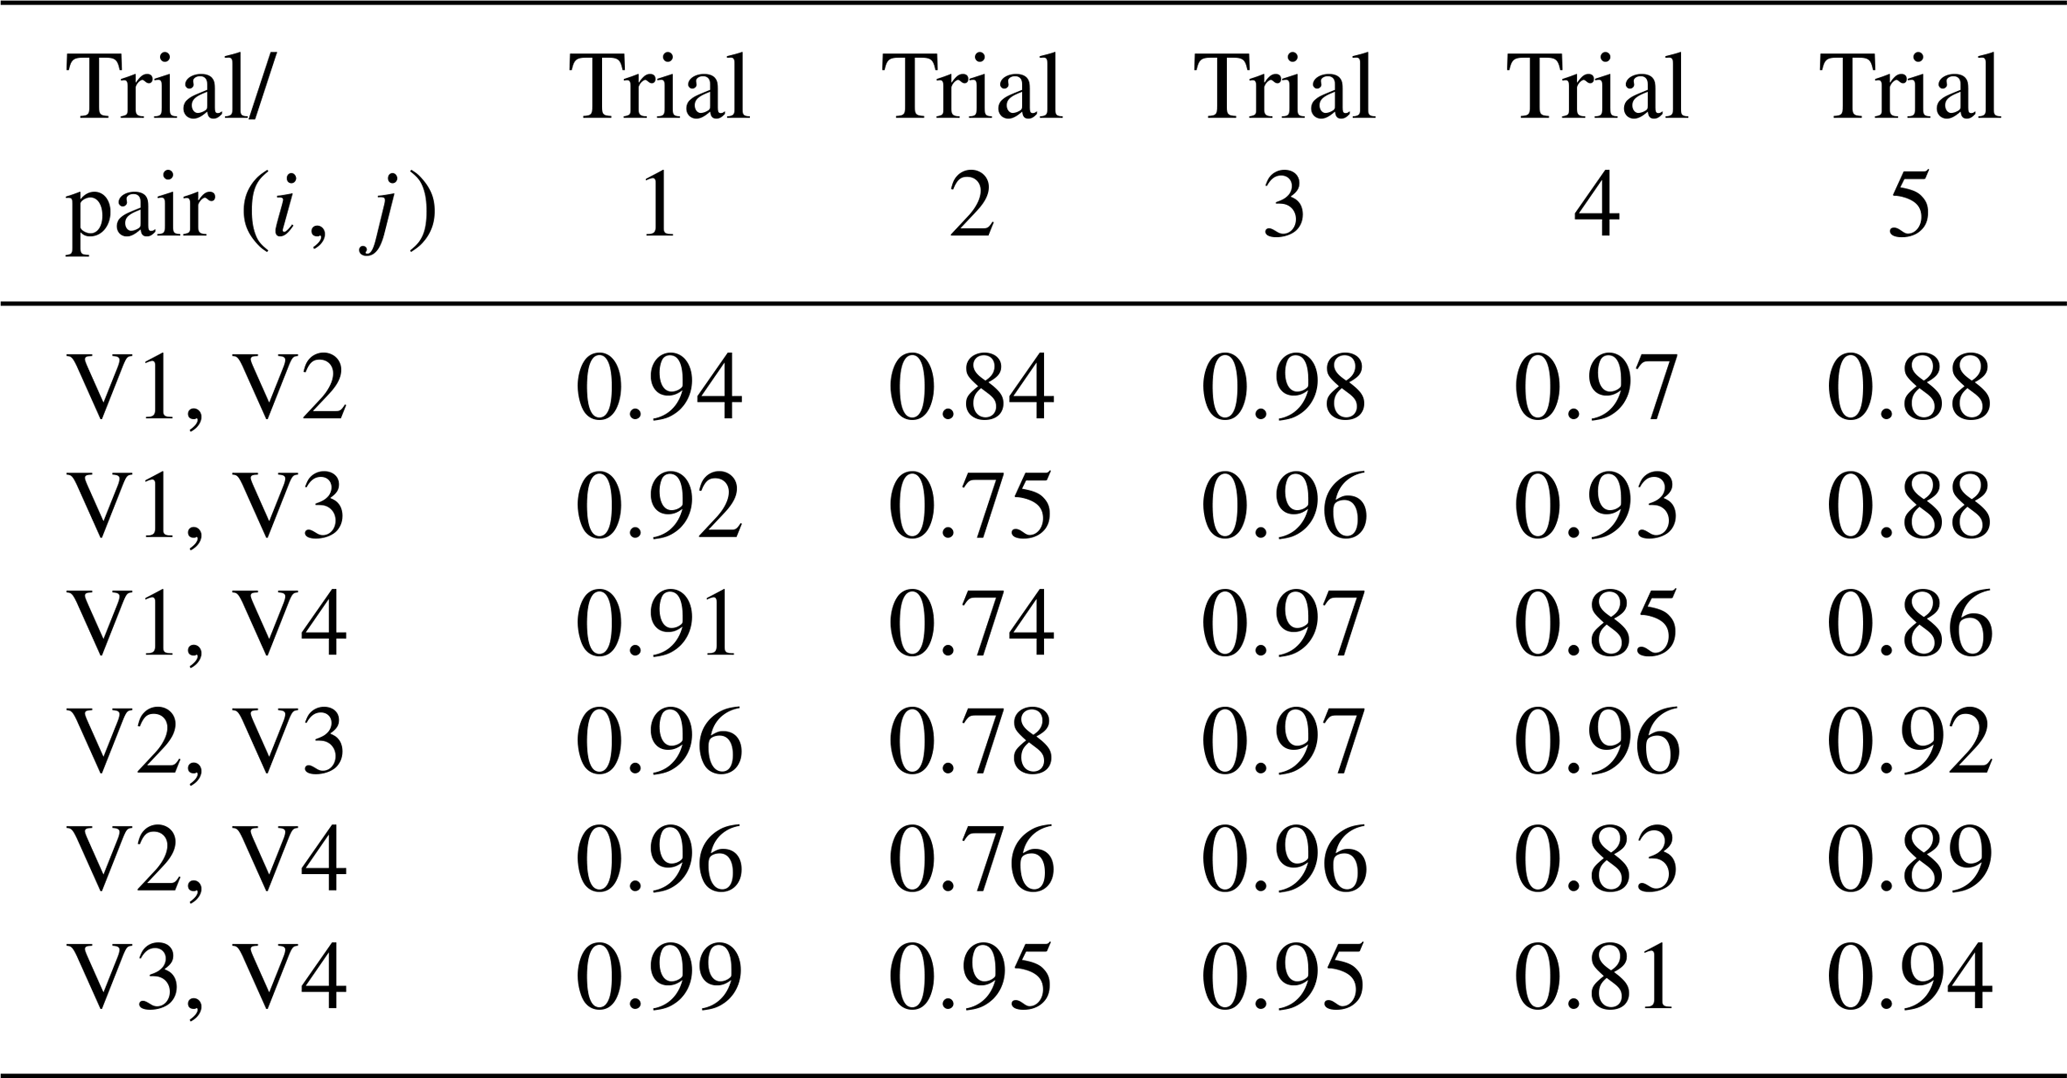
The mean values over frequency of the real and imaginary parts of the complex correlation coefficients are listed in Tables 2 and 3, respectively. Within each of the measurement trials these mean values are almost identical for the identically constructed antenna pairs. Furthermore, also over the different measurement trials the antenna pairs show almost the same behavior, but slight fluctuation may occur. For example, the antenna pair V3 and V4 has the highest mean values of the real part of the complex correlation coefficients in measurement trials 1 and 2 but the lowest mean values in measurement trial 4. Nevertheless, all of these identically constructed antenna pairs lead to absolute values and real parts of the complex correlation coefficients of almost 1.
Table 2Mean values of the real part of the complex correlation coefficient over frequency for different antenna pairs.

Table 3Mean values of the imaginary part of the complex correlation coefficient over frequency for different antenna pairs.
The power correlation coefficients over frequency are exemplarily shown for measurement trial 4 in Fig. 5. As expected, the measured sample sequences in terms of transmitted power for identically constructed antennas are also highly correlated and almost constant over frequency.
Table 4 lists the mean values (over frequency) of the power correlation coefficients for the identically constructed antenna pairs and the different measurement trials 1 to 5. The overall mean value of the power correlation coefficients in this scenario is about 0.9. The power correlation coefficients are slightly lower than the absolute values of the complex correlation coefficients, by tendency.

Figure 5Power correlation coefficients for identically constructed antennas and measurement trial 4.
Table 4Mean values of the power correlation coefficient over frequency for different antenna pairs.
3.2 Identically constructed antennas across different measurement trials
If measurements are performed over a large time span, the original calibration of the VNA might not be available or valid any more. The extent to which the measured sample sequences correlate for identically constructed antennas originating from different measurement trials (i.e., different VNA calibrations) is evaluated in this section.
Antenna V1 is considered here as a reference, whereby the first columns in the tables in this section indicate from which measurement trial (1 to 5) the sample sequences originate. The correlation coefficients over frequency and the average transmission are not shown here, as they are essentially equivalent to the results in Sect. 3.1.
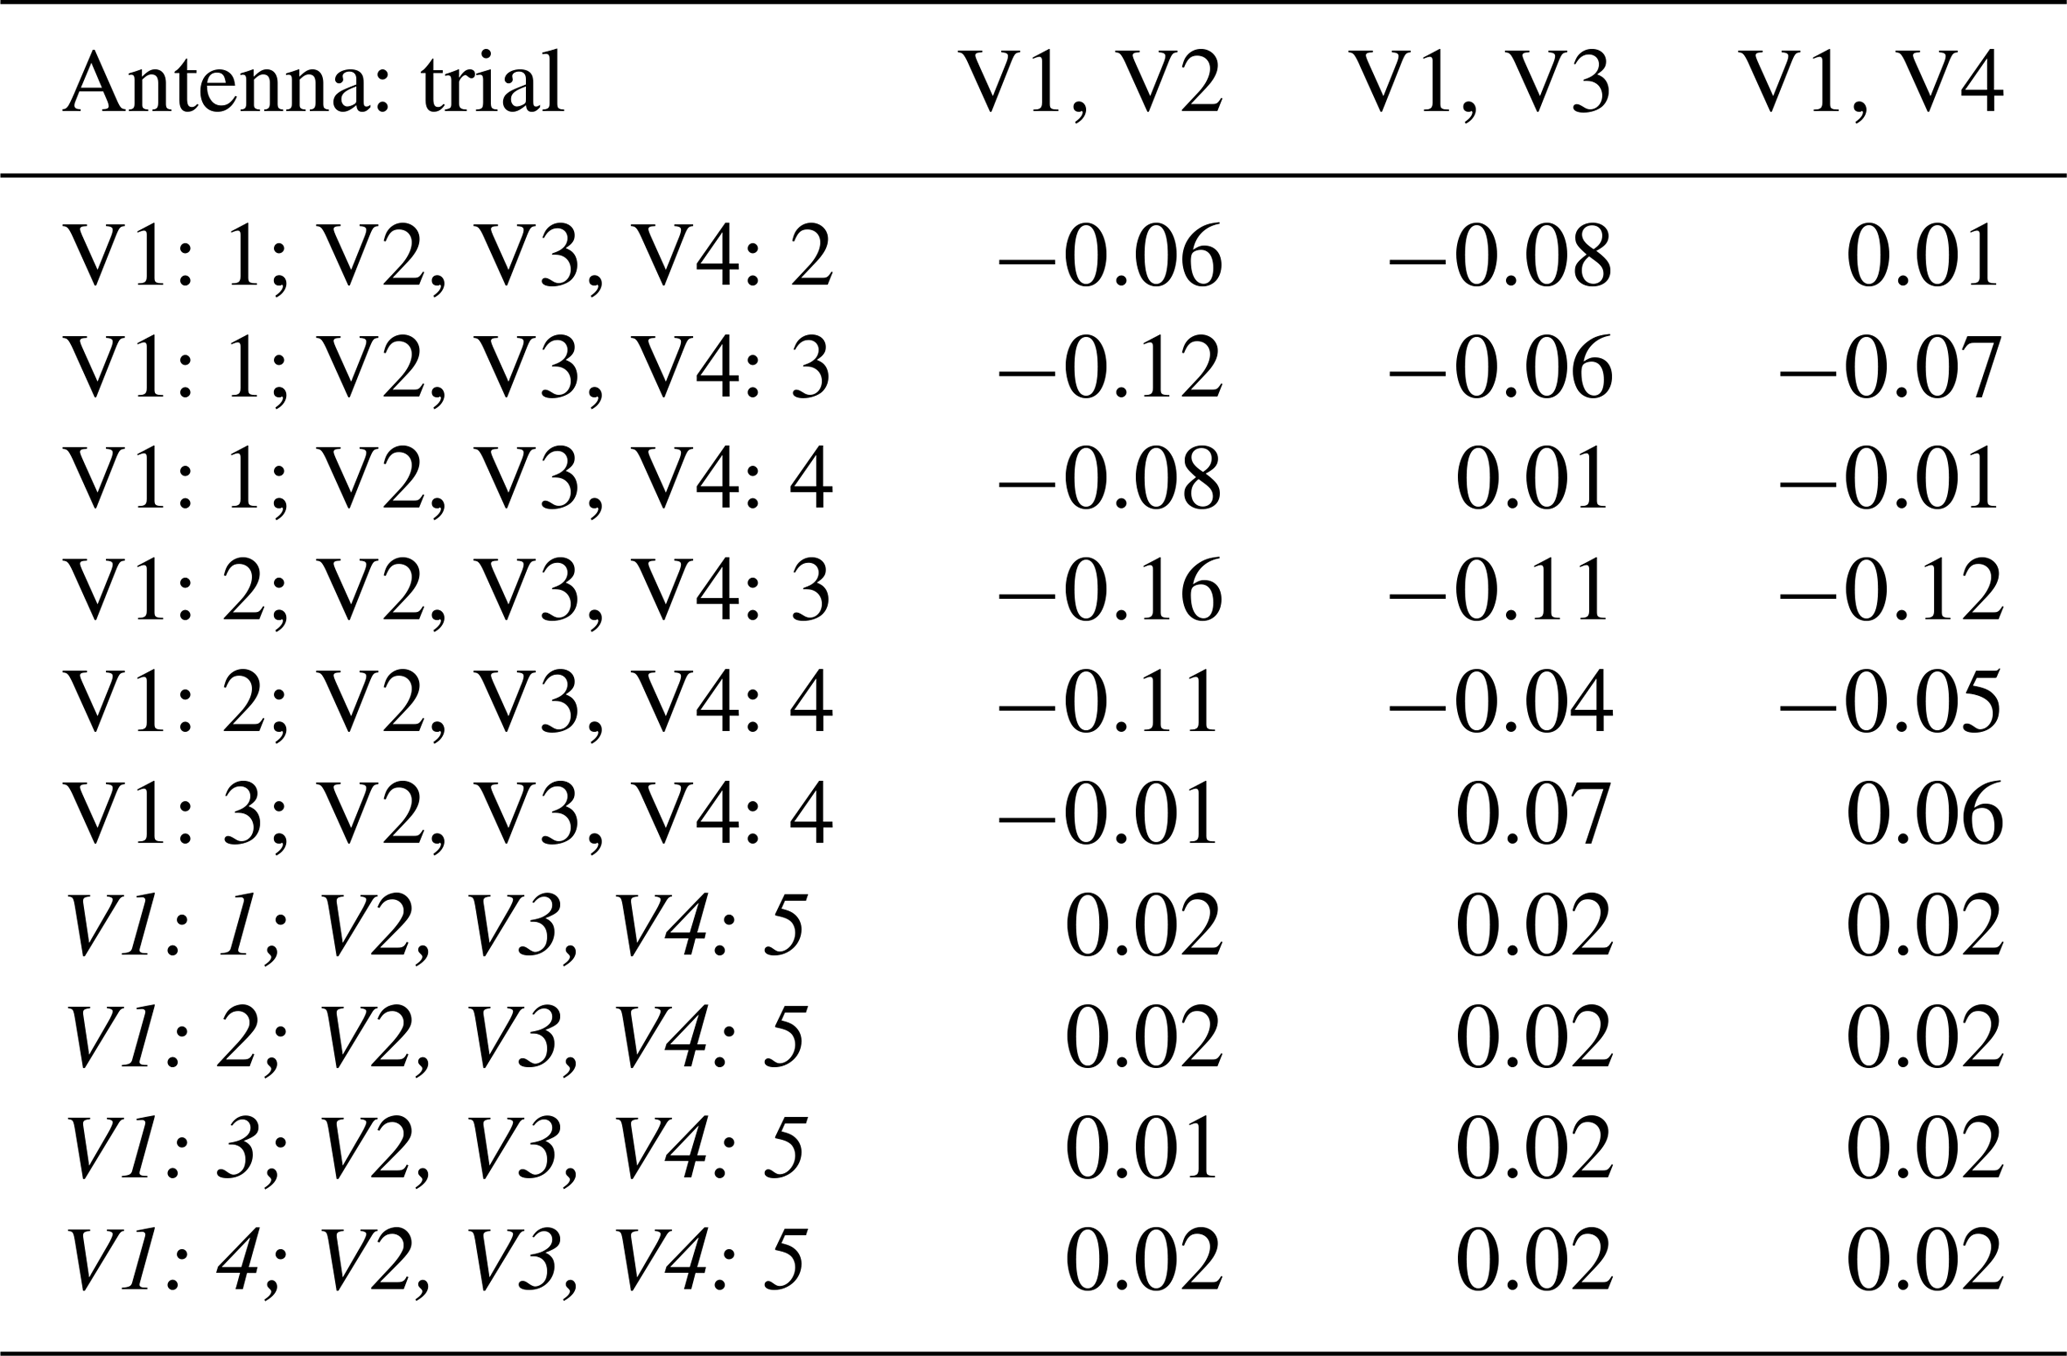
The mean values (over frequency) of the real part and imaginary part of the complex correlation coefficient are listed in Tables 5 and 6, respectively.
The results containing sample sequences from measurement trial 5 are shown in italics, as the position of the antenna holder for the EUT antennas was changed in this trial. These rows show correlation values around zero, which affirms the decorrelation due to the modification of the position, as indicated before. In comparison to the previous section, where the reference measurement sequence was taken from the same measurement trial, the (remaining non-zero) mean values of the real parts are slightly lowered, whereas the mean values of the imaginary part are slightly increased by tendency. The different underlying calibrations of the VNA between the measurement trials correspond to slight differences in the measured sample sequences. However, the measured sample sequences are still highly correlated.
Table 5Mean values of the real part of the complex correlation coefficients over frequency for different antenna pairs. The first column indicates from which measurement trial the measured sample sequences of the specified antenna originate.
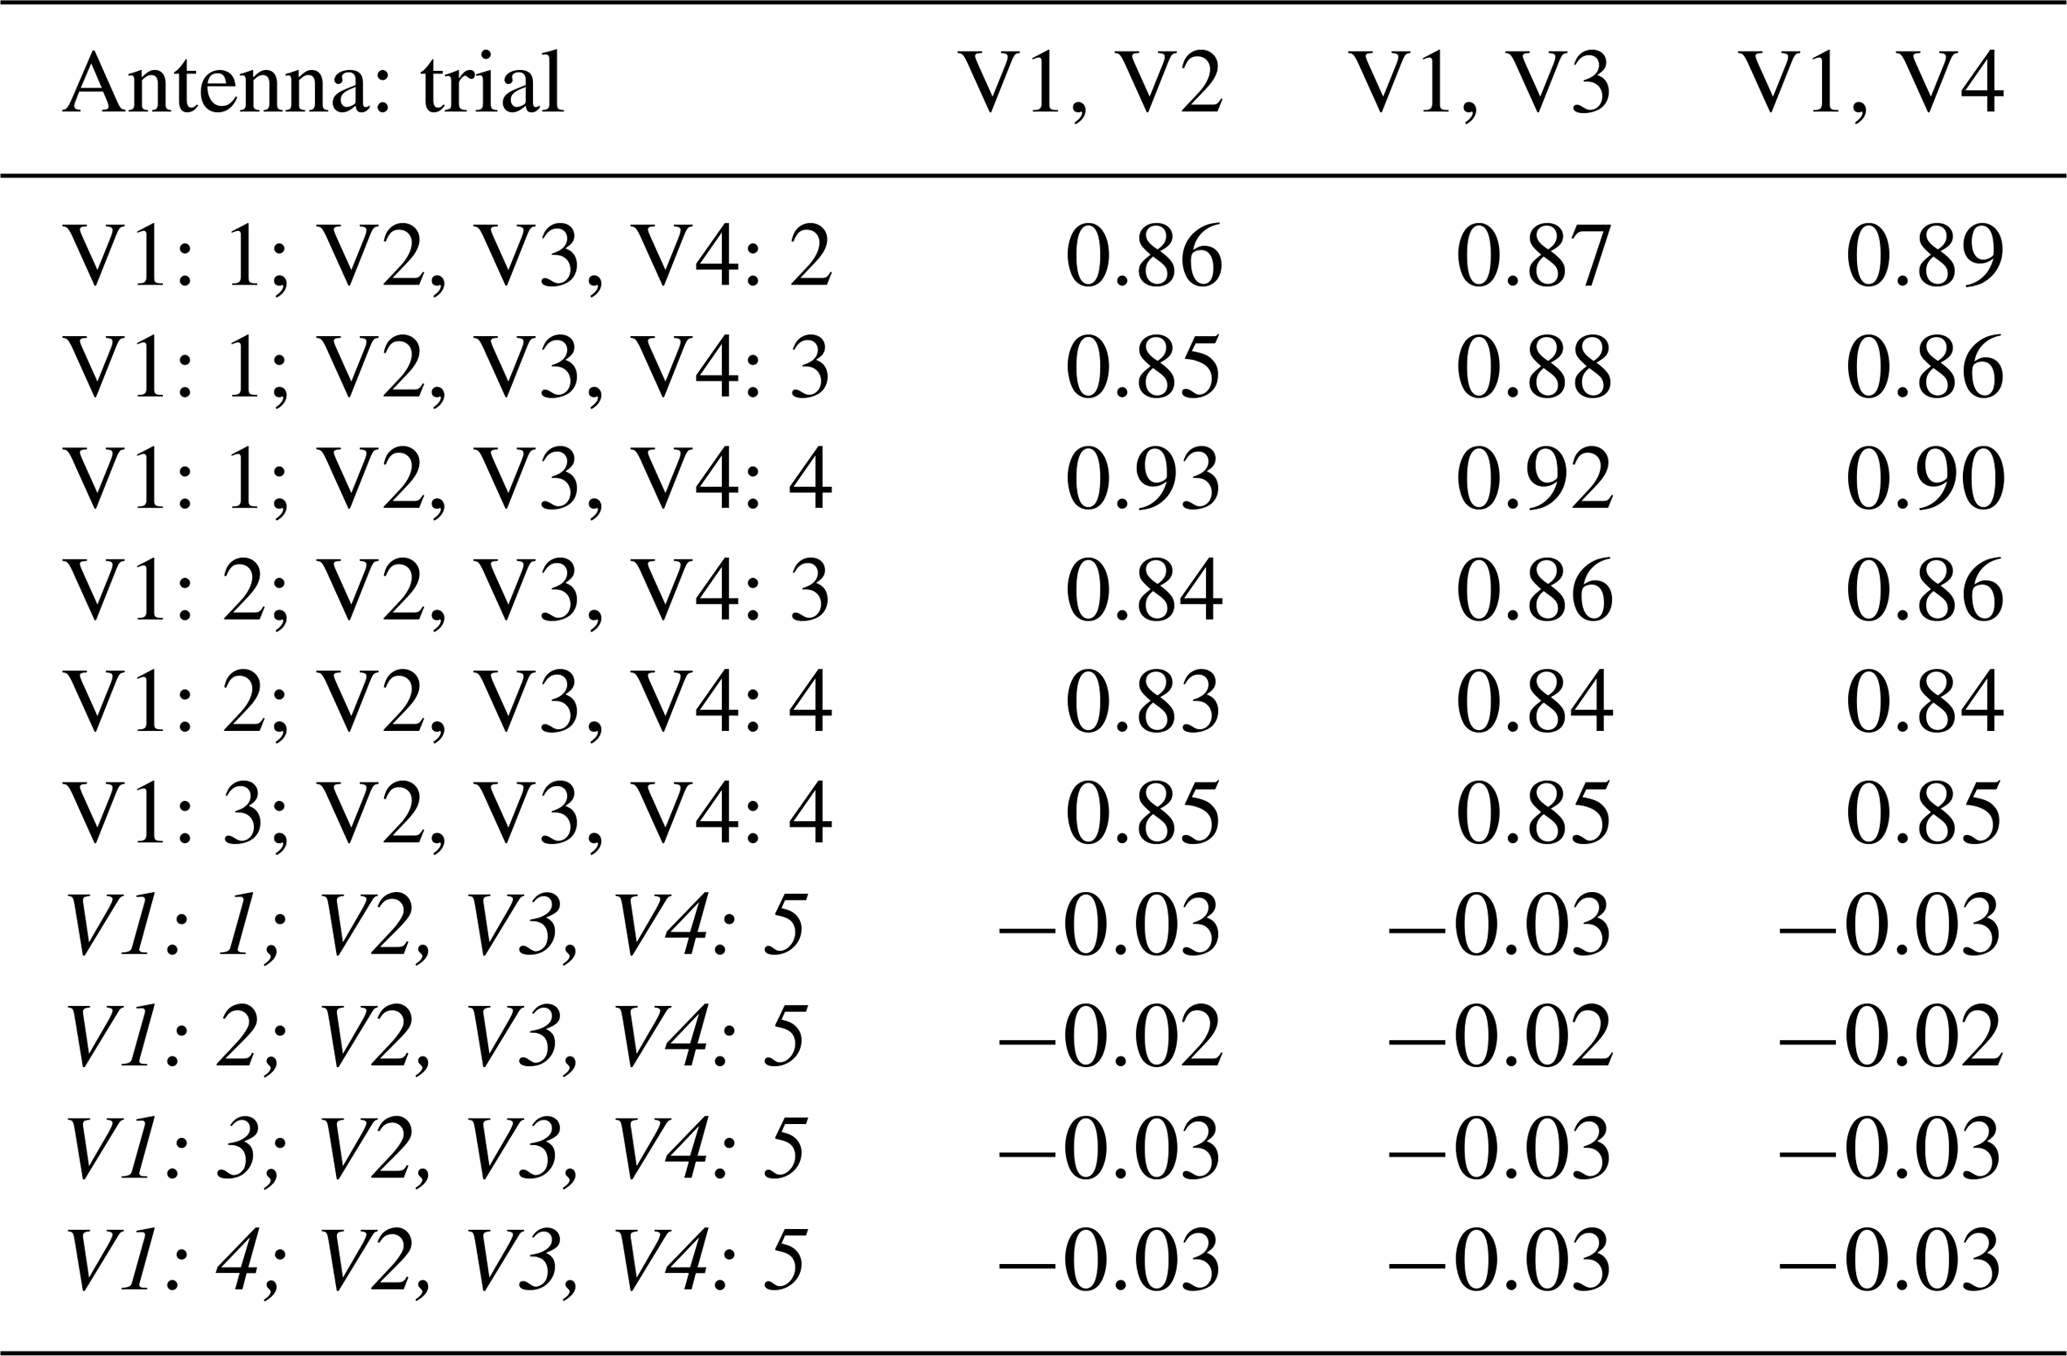
Table 6Mean values of the imaginary part of the complex correlation coefficients over frequency for different antenna pairs. The first column indicates from which measurement trial the measured sample sequences of the specified antenna originate.
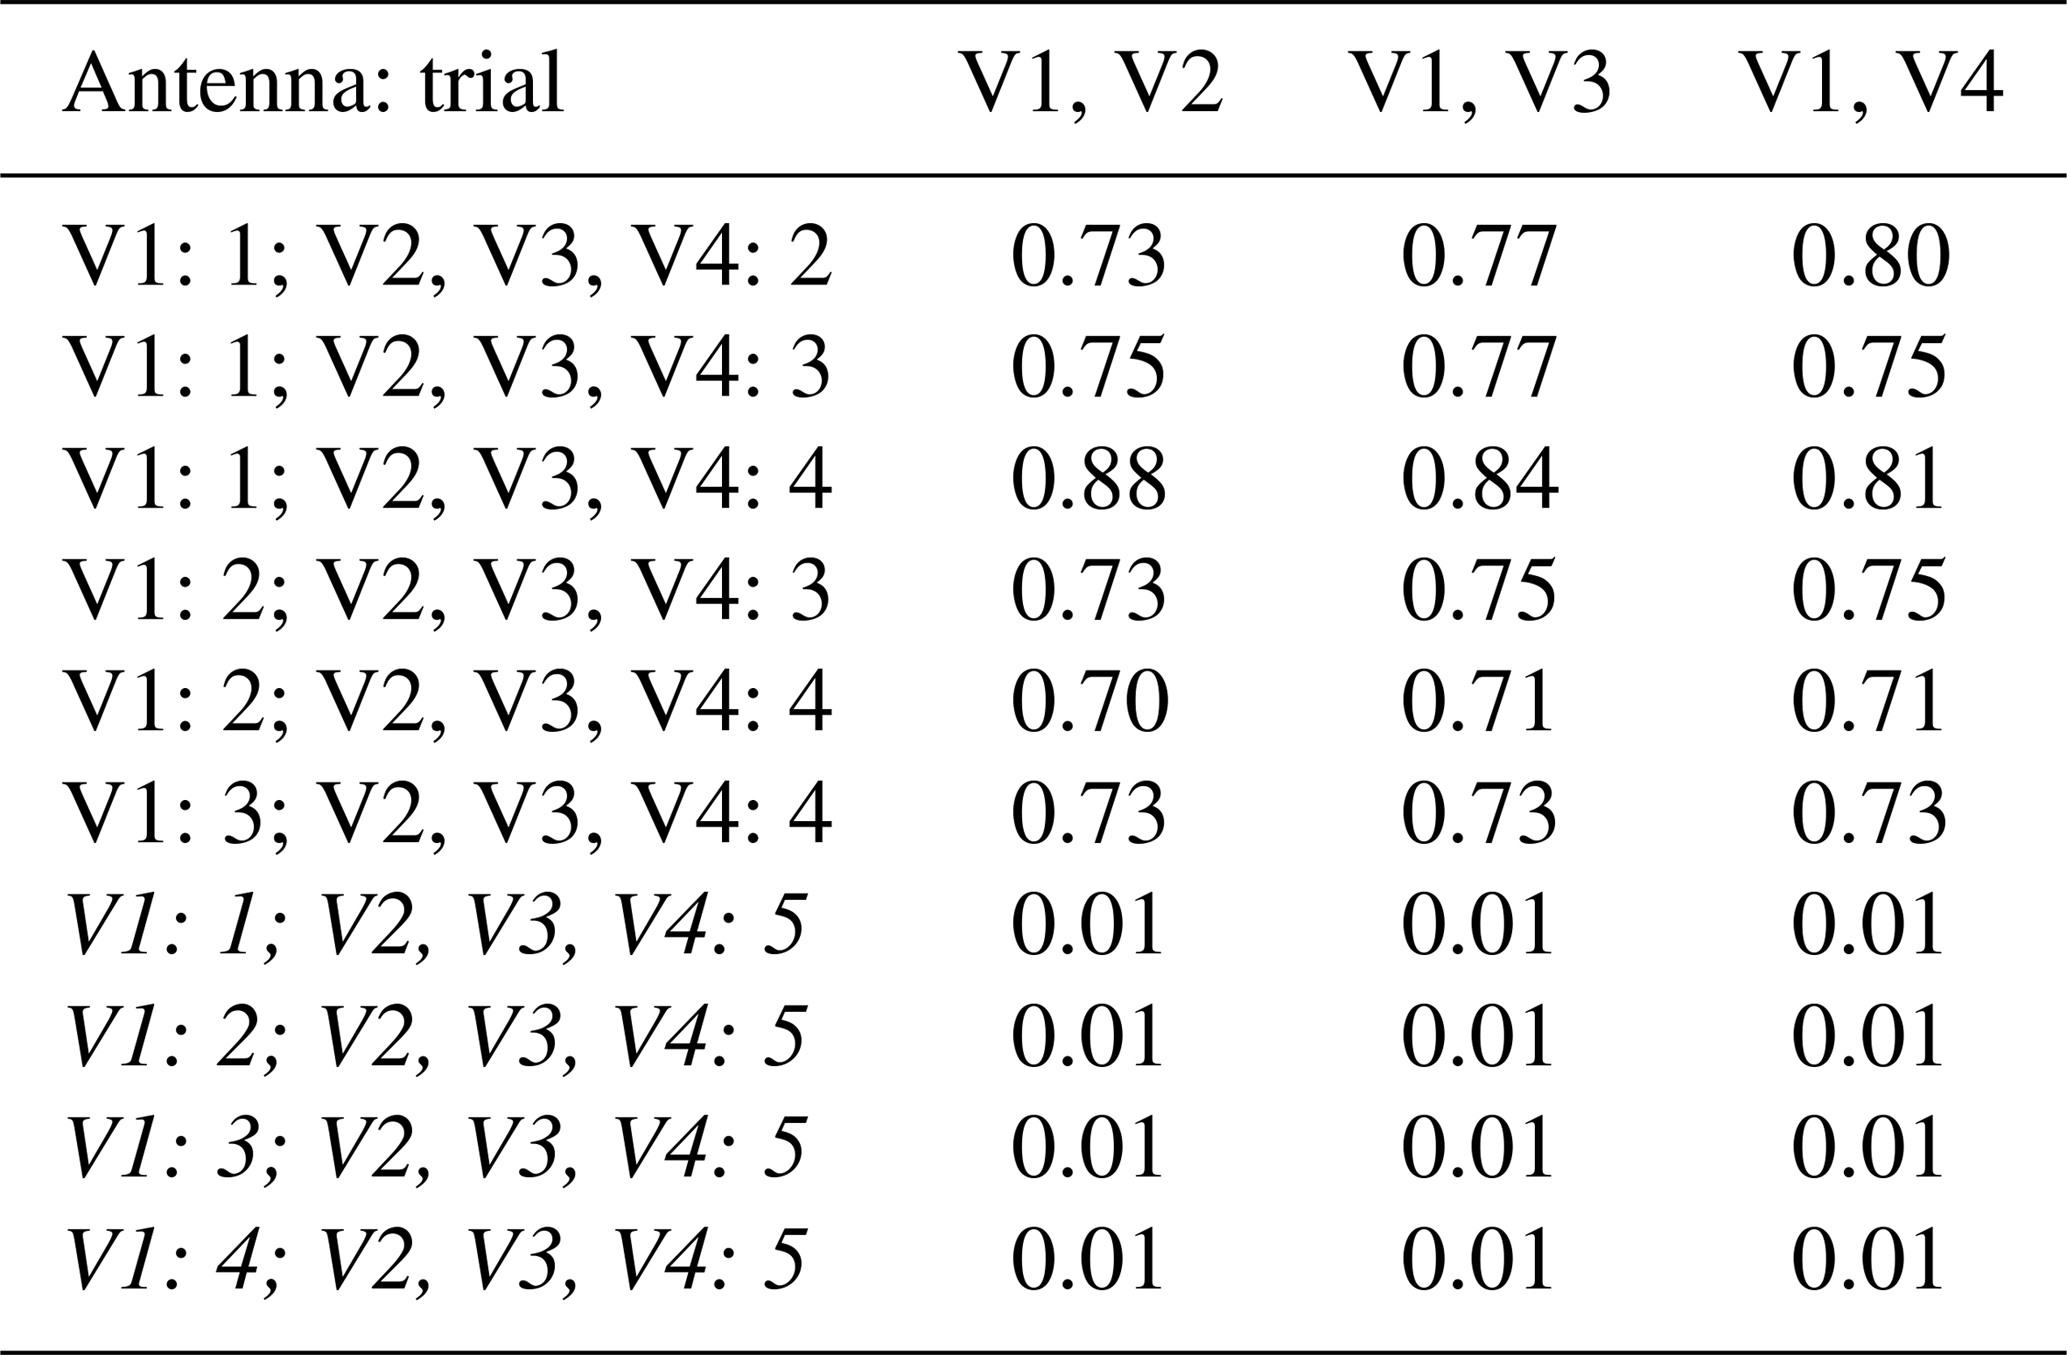
The mean values of the power correlation coefficients over frequency for different antenna pairs are listed in Table 7. As before, the lines containing sample sequences originating from measurement trial 5 and reference sample sequences from other measurement trials are shown in italics and lead to correlation values around zero as well. The overall mean of the remaining (non-zero) power correlation coefficients is about 0.76, whereby the individual mean power correlation coefficients just slightly fluctuate around that value.
Table 7Mean values of the power correlation coefficients over frequency for different antenna pairs. The first column indicates from which measurement trial the measured sample sequences of the specified antenna originate.
3.3 Different antenna types within the same measurement trial
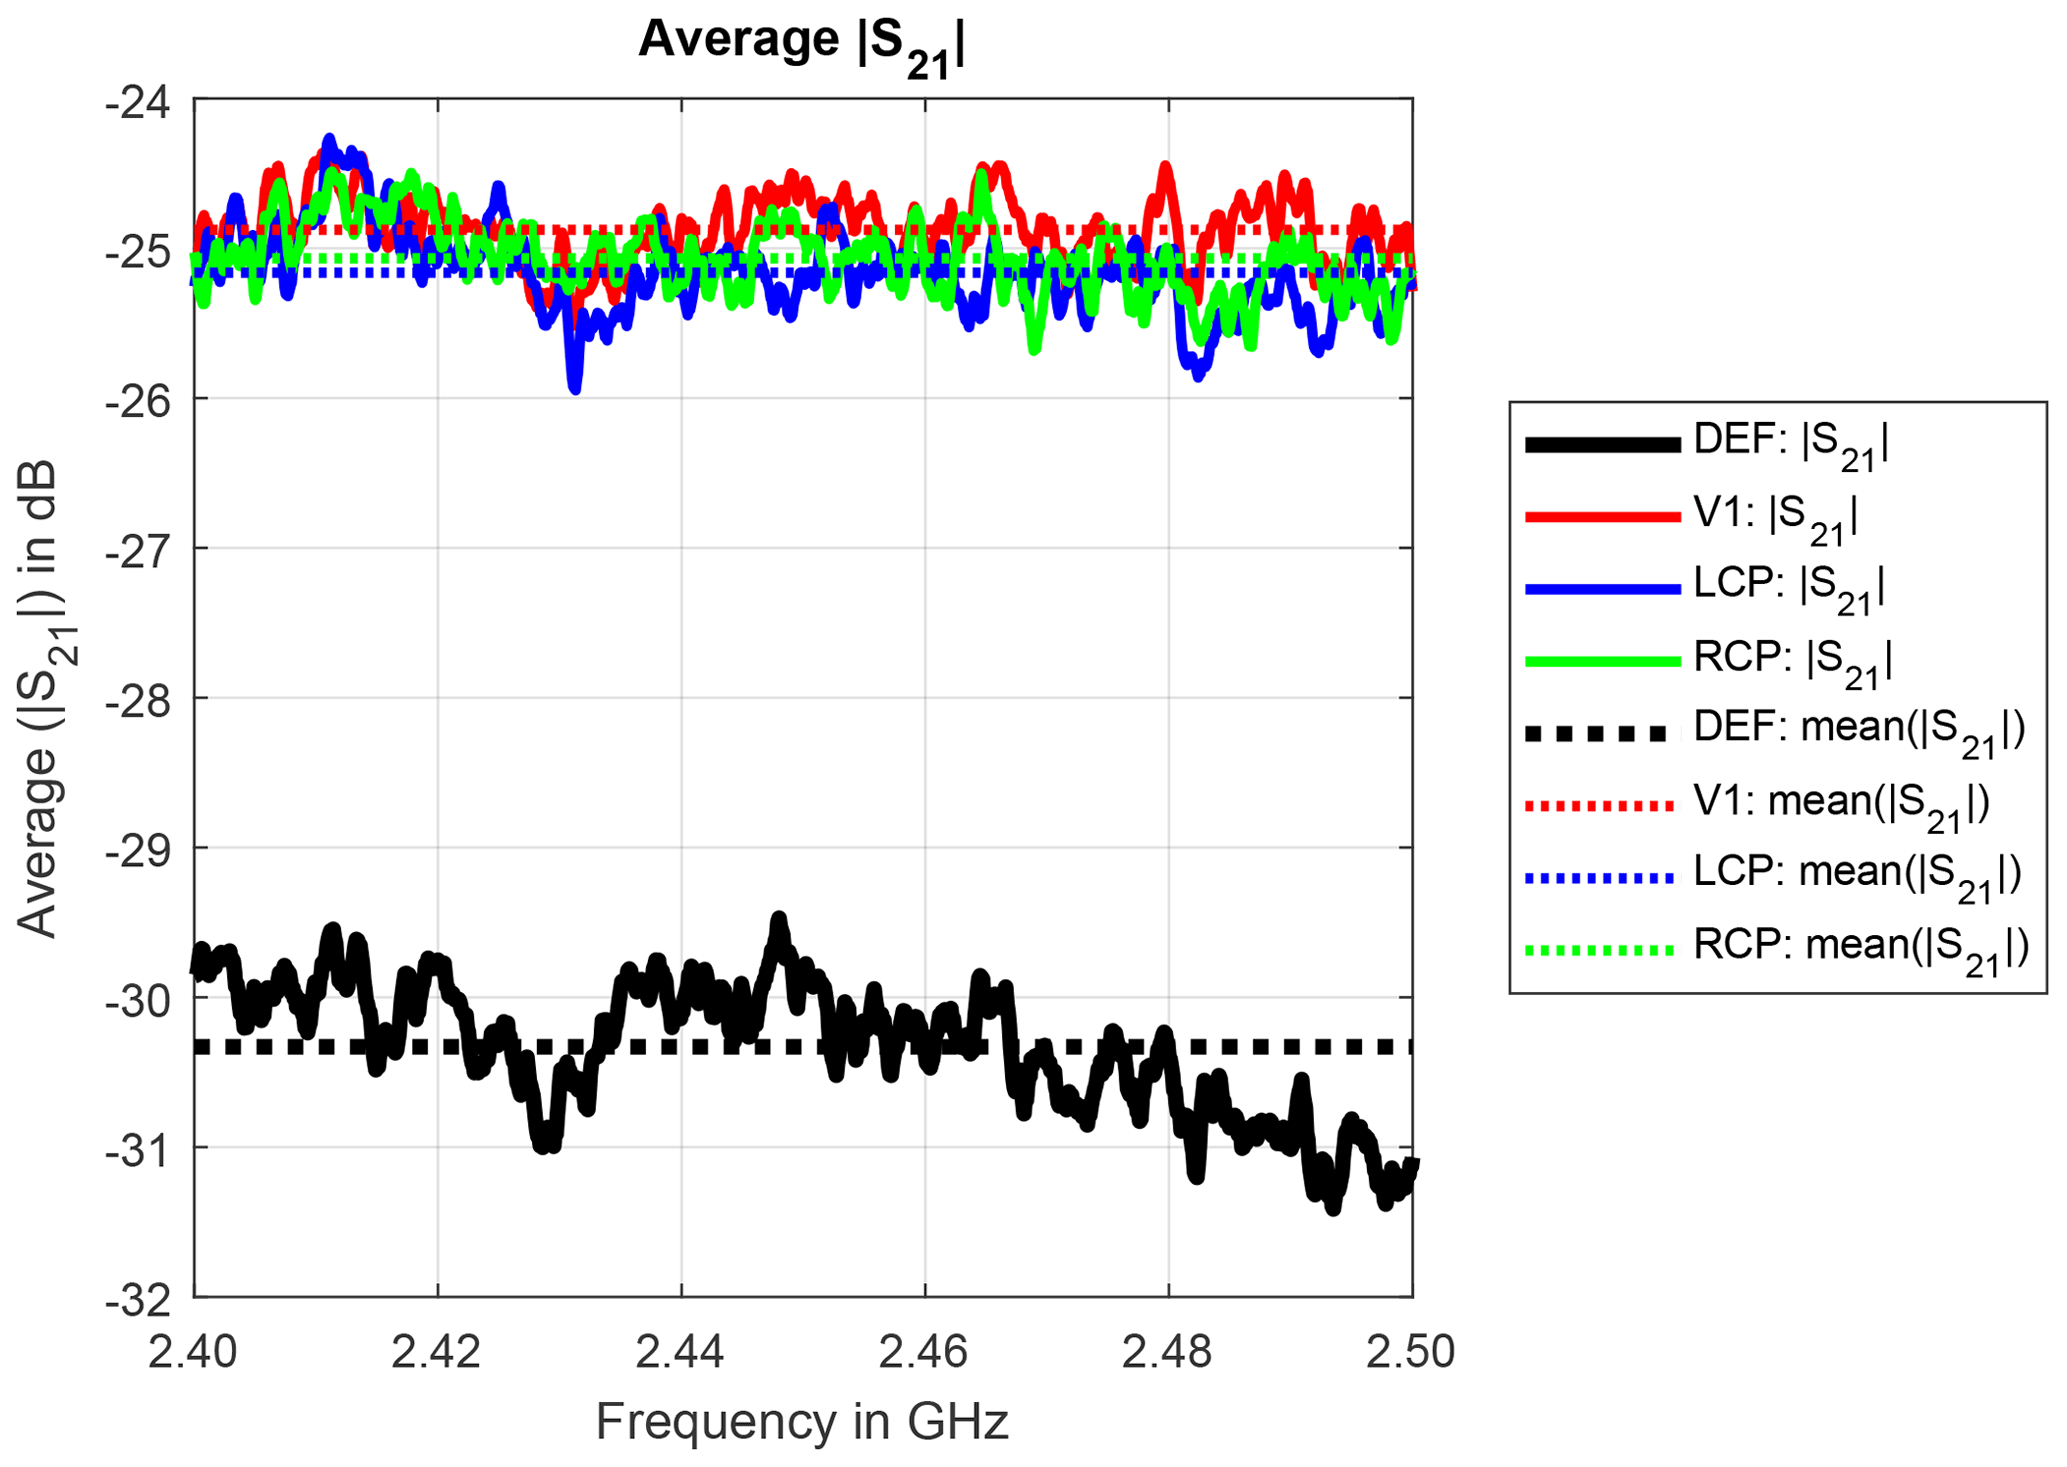
Different antenna types with the same casing but electrically different design, in particular different polarizations, were also measured. Figure 6 shows the average transmission for the antennas V1, V2, LCP and RCP exemplarily for measurement trial 4. The average transmissions of all antennas are very similar and the mean values over frequency deviate only by about 0.3 dB. Therefore, it is not possible to differentiate between these antennas from the average transmission, even though the antennas have opposite polarizations.
The real part and the imaginary part of the complex correlation coefficients (over frequency) are depicted in Figs. 7 and 8, respectively. Tables listing mean values (over frequency) of the real part and the imaginary part of the complex correlation coefficients for the different measurement trials are not explicitly shown here as the results are essentially the same as in trial 4 with minor fluctuations as in the previous sections.
The real part for the identically constructed antenna pair V1 and V2 is almost 1. For the antenna pairs consisting of one vertically polarized antenna (V1 or V2) and one circularly polarized antenna (LCP or RCP), the real parts lie approximately between 0.6 and 0.7. These values are very close to the theoretical value of the polarization loss between a linearly and a circularly polarized antenna of 3 dB, which is for amplitude quantities.
The real and imaginary parts of the complex correlation coefficients between the antennas LCP and RCP are almost zero. Therefore, different polarizations can be detected even if the average transmissions are almost identical. The power correlation coefficients between the antennas LCP and RCP are almost zero, too. As a consequence, different polarizations can also easily be detected by calculating the power correlation coefficient.
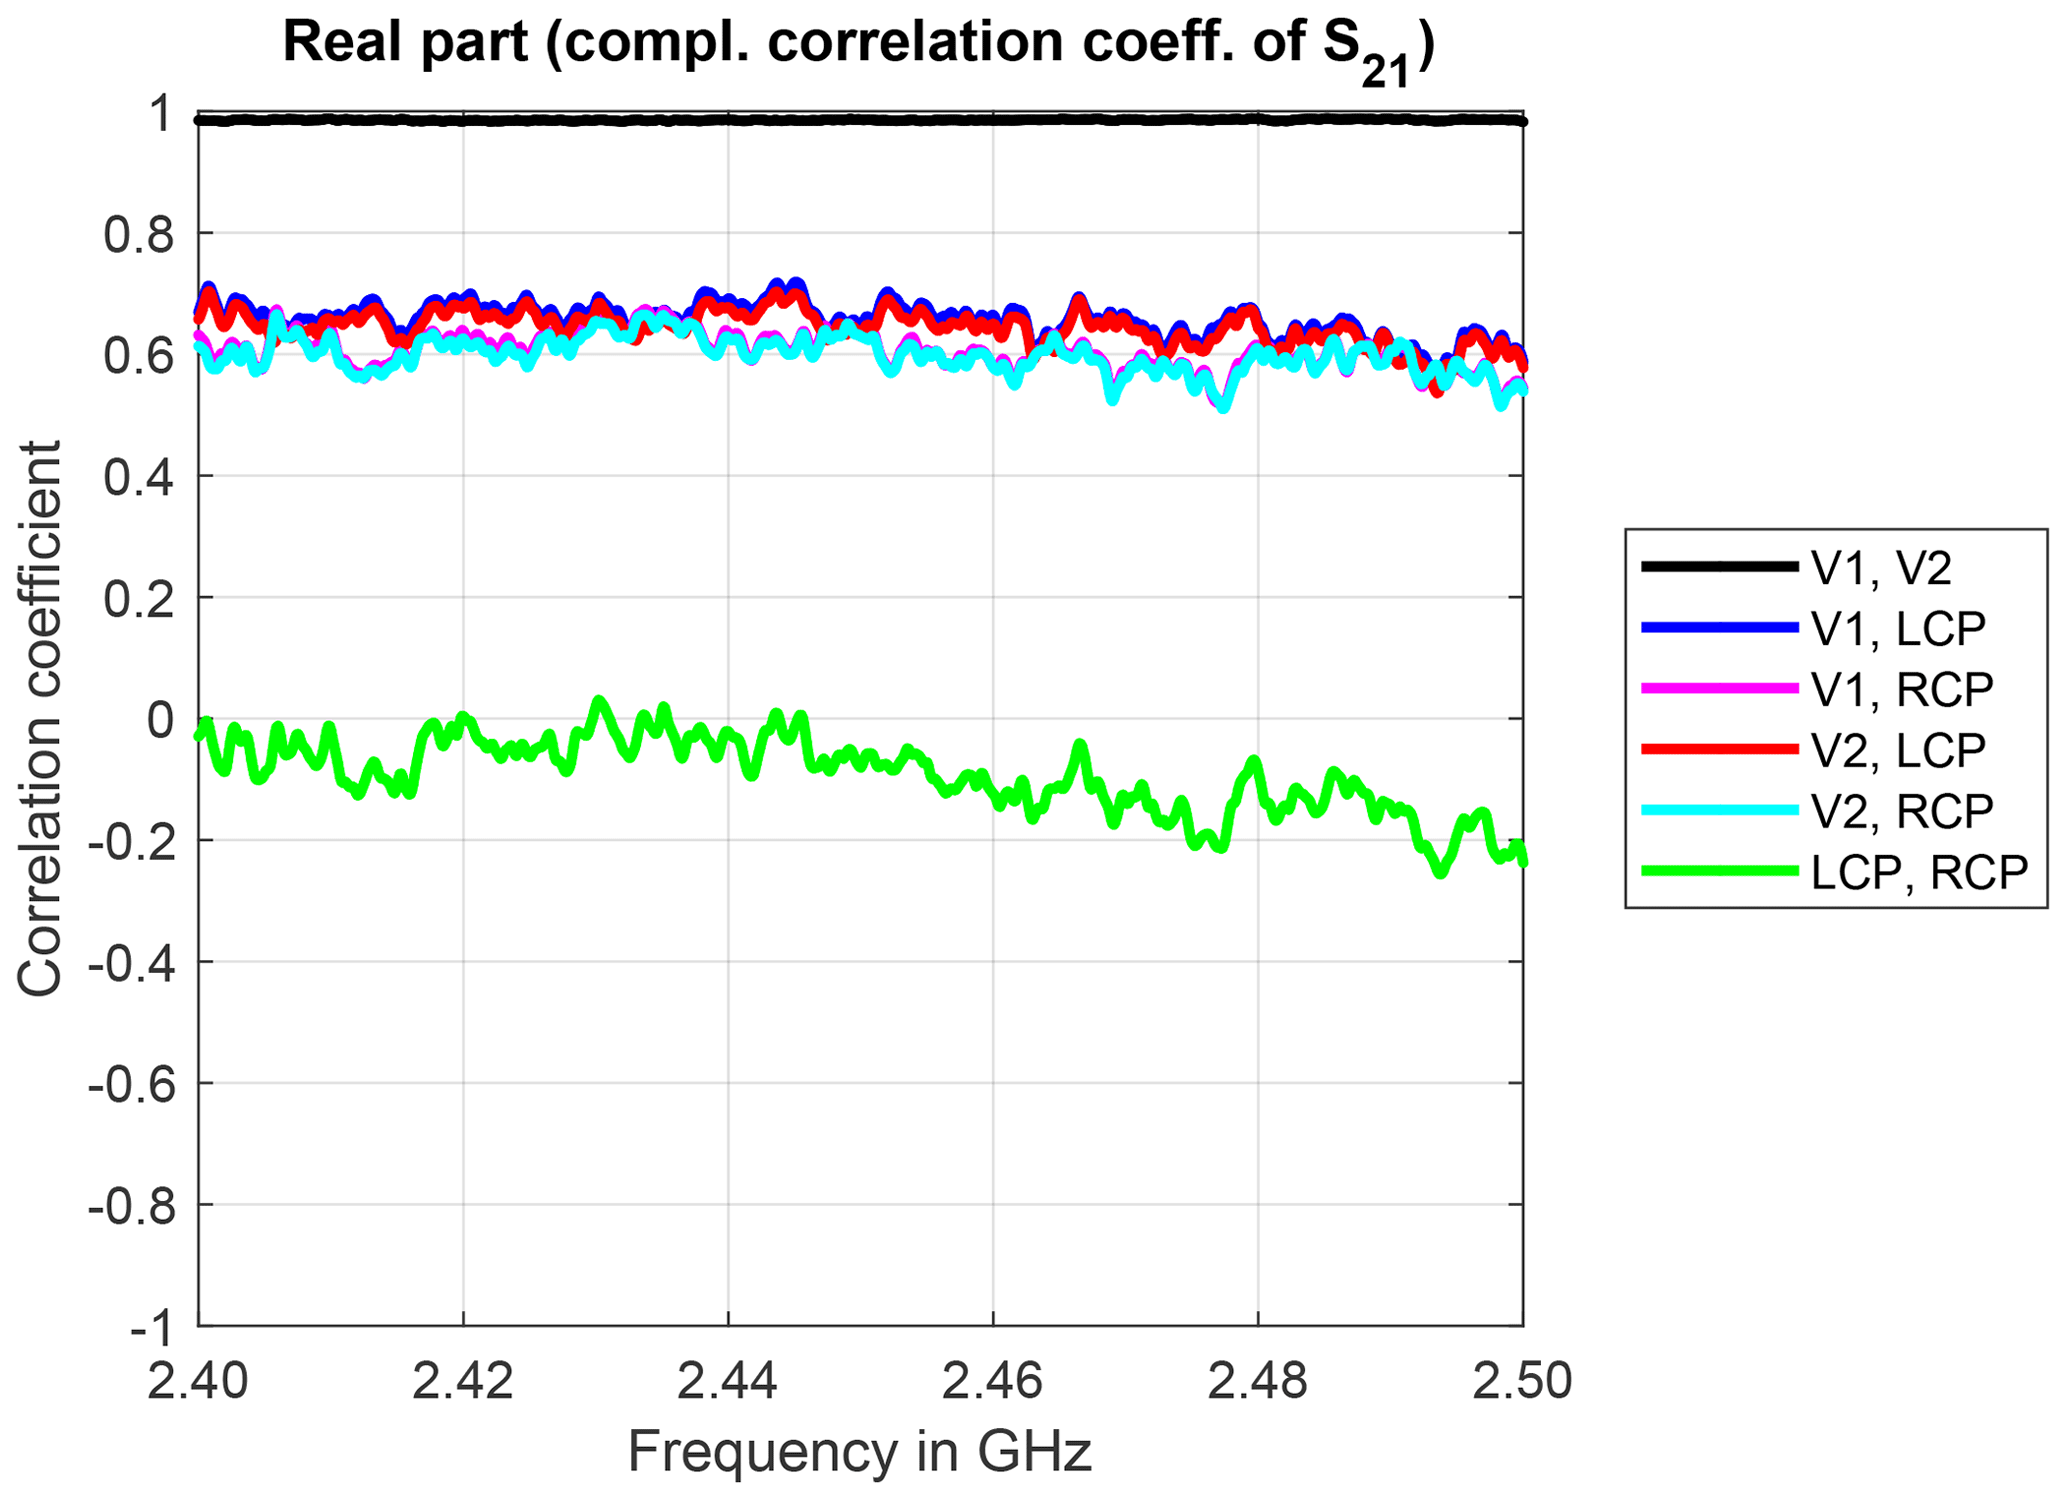
Figure 7Real part of the complex correlation coefficients for different antennas and measurement trial 4.
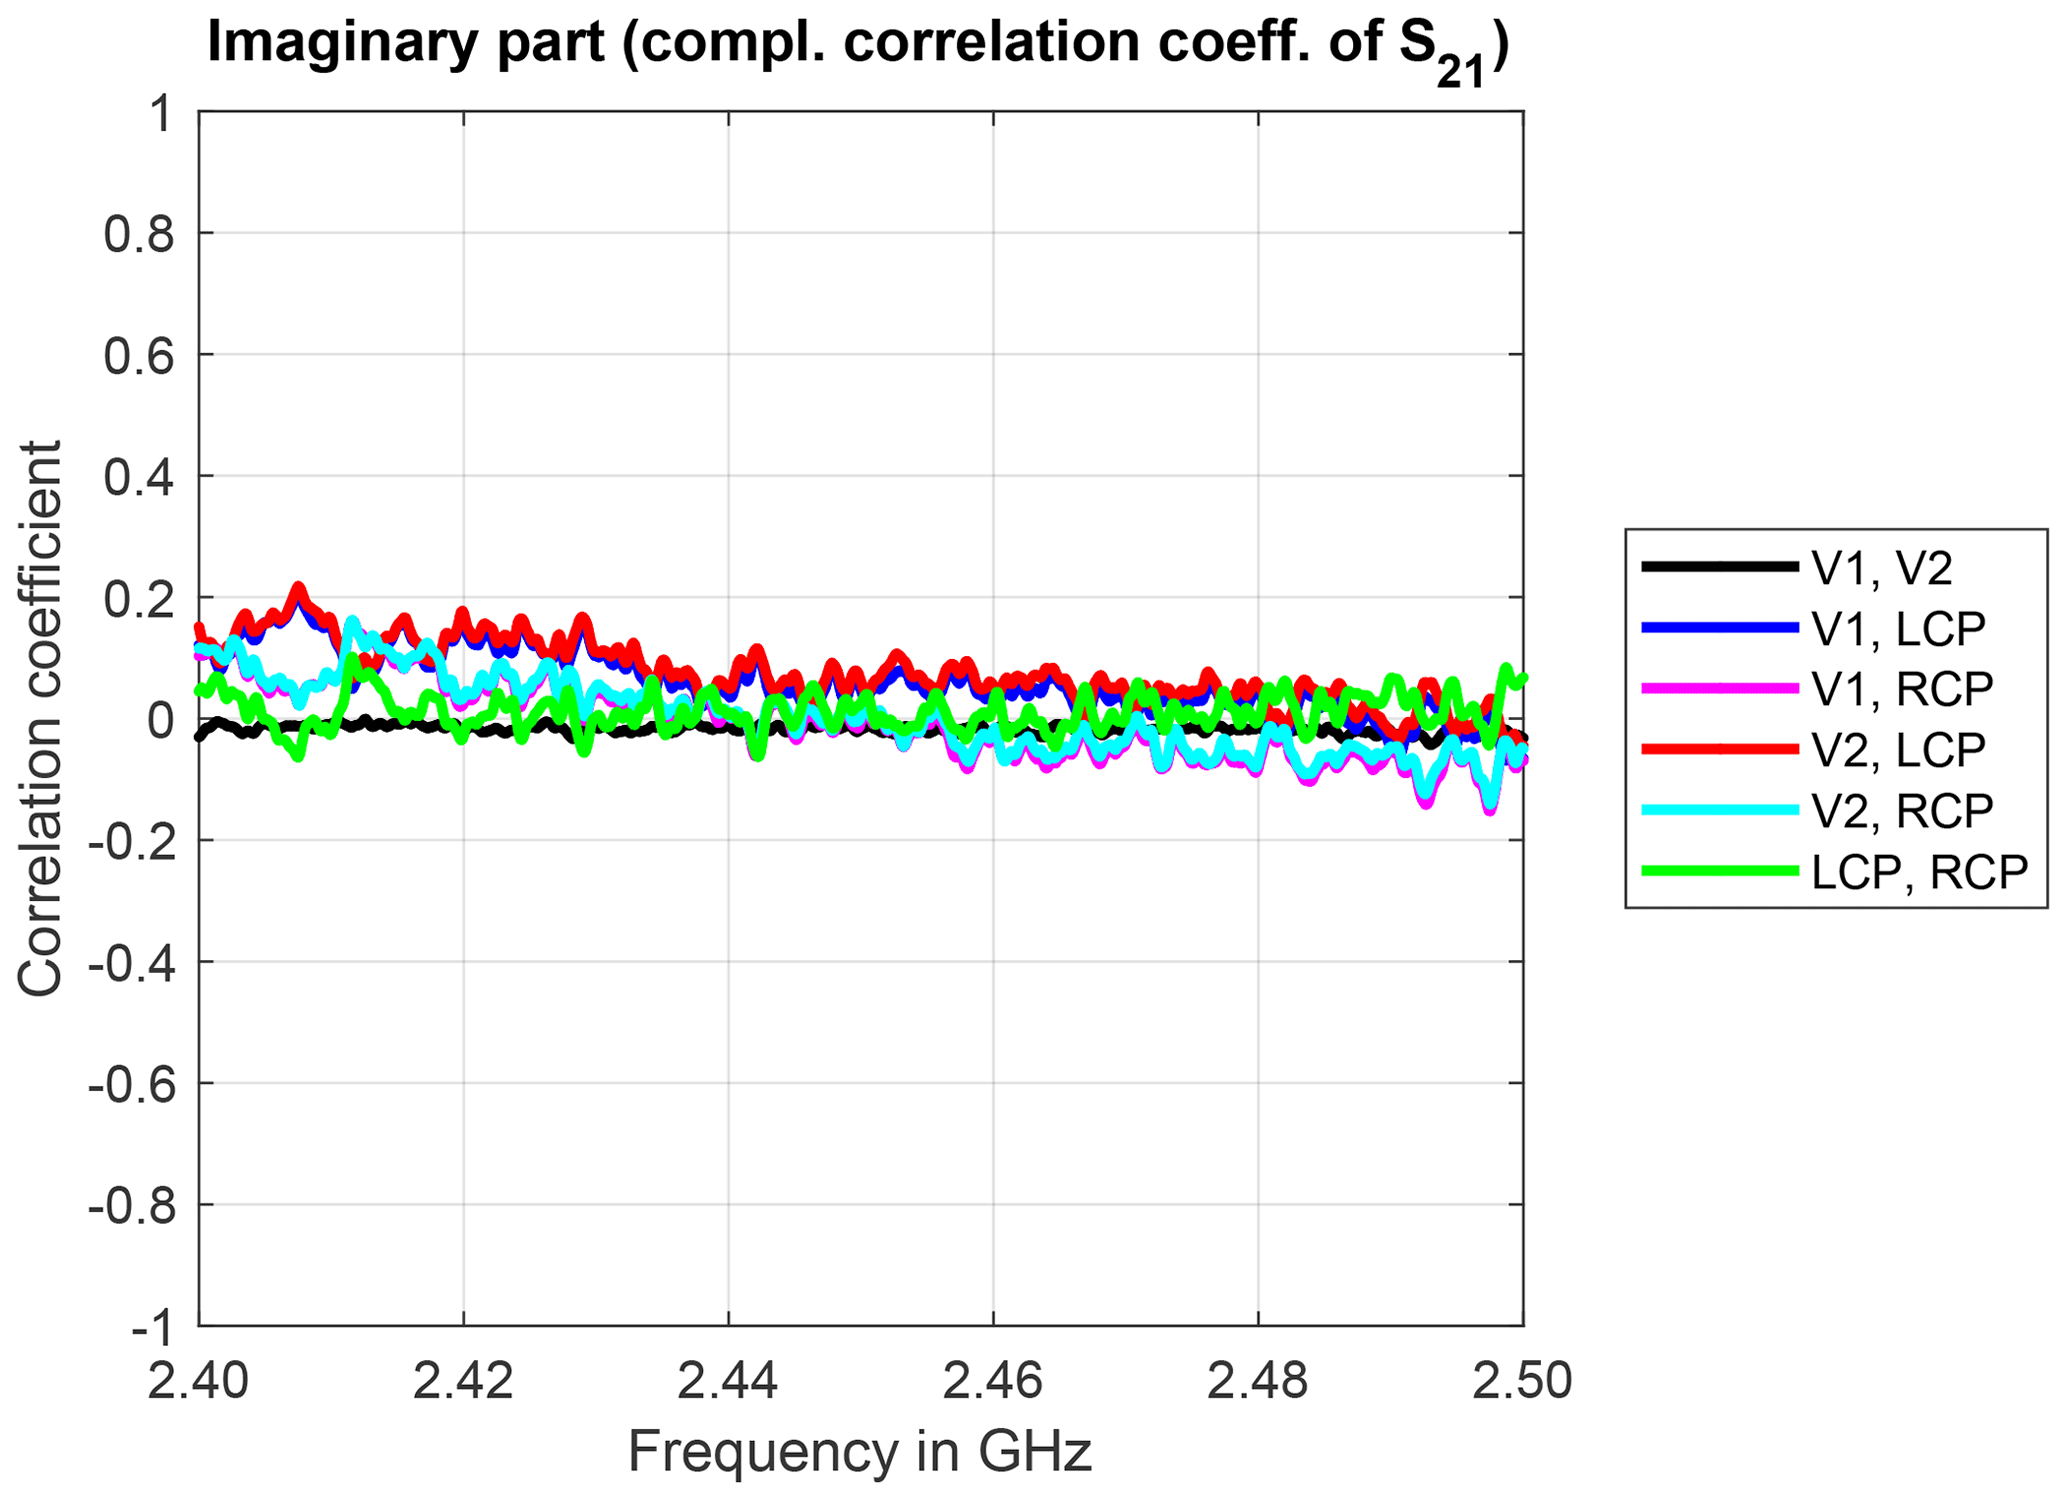
Figure 8Imaginary part of the complex correlation coefficients for different antennas and measurement trial 4.
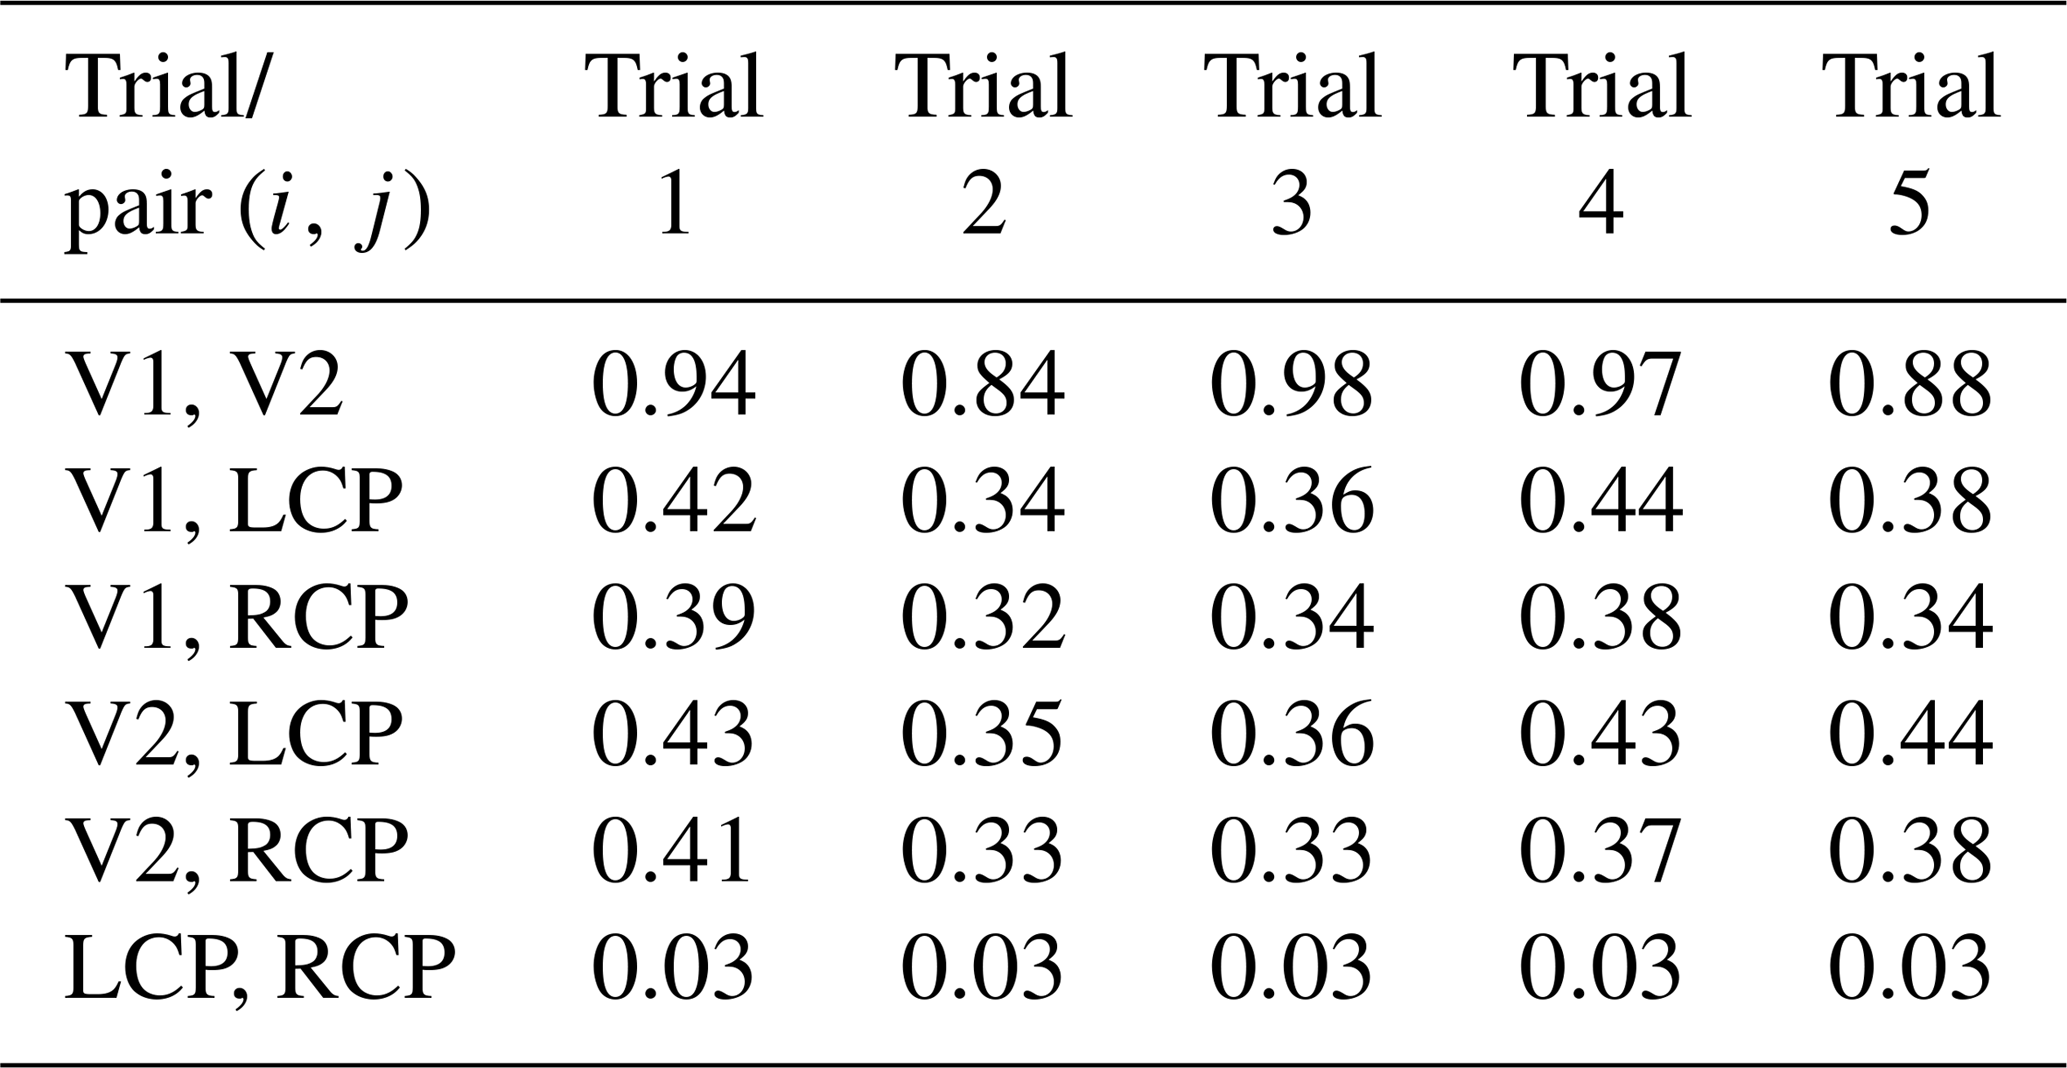
Figure 9 shows the power correlation coefficients for these antennas and for measurement trial 4. The mean values over frequency for all antennas are listed in Table 8. The power correlation coefficient between one vertically polarized antenna (V1 or V2) and one circularly polarized one (LCP or RCP) lies between 0.2 and 0.6 with mean values (over frequency) between 0.32 and 0.44.
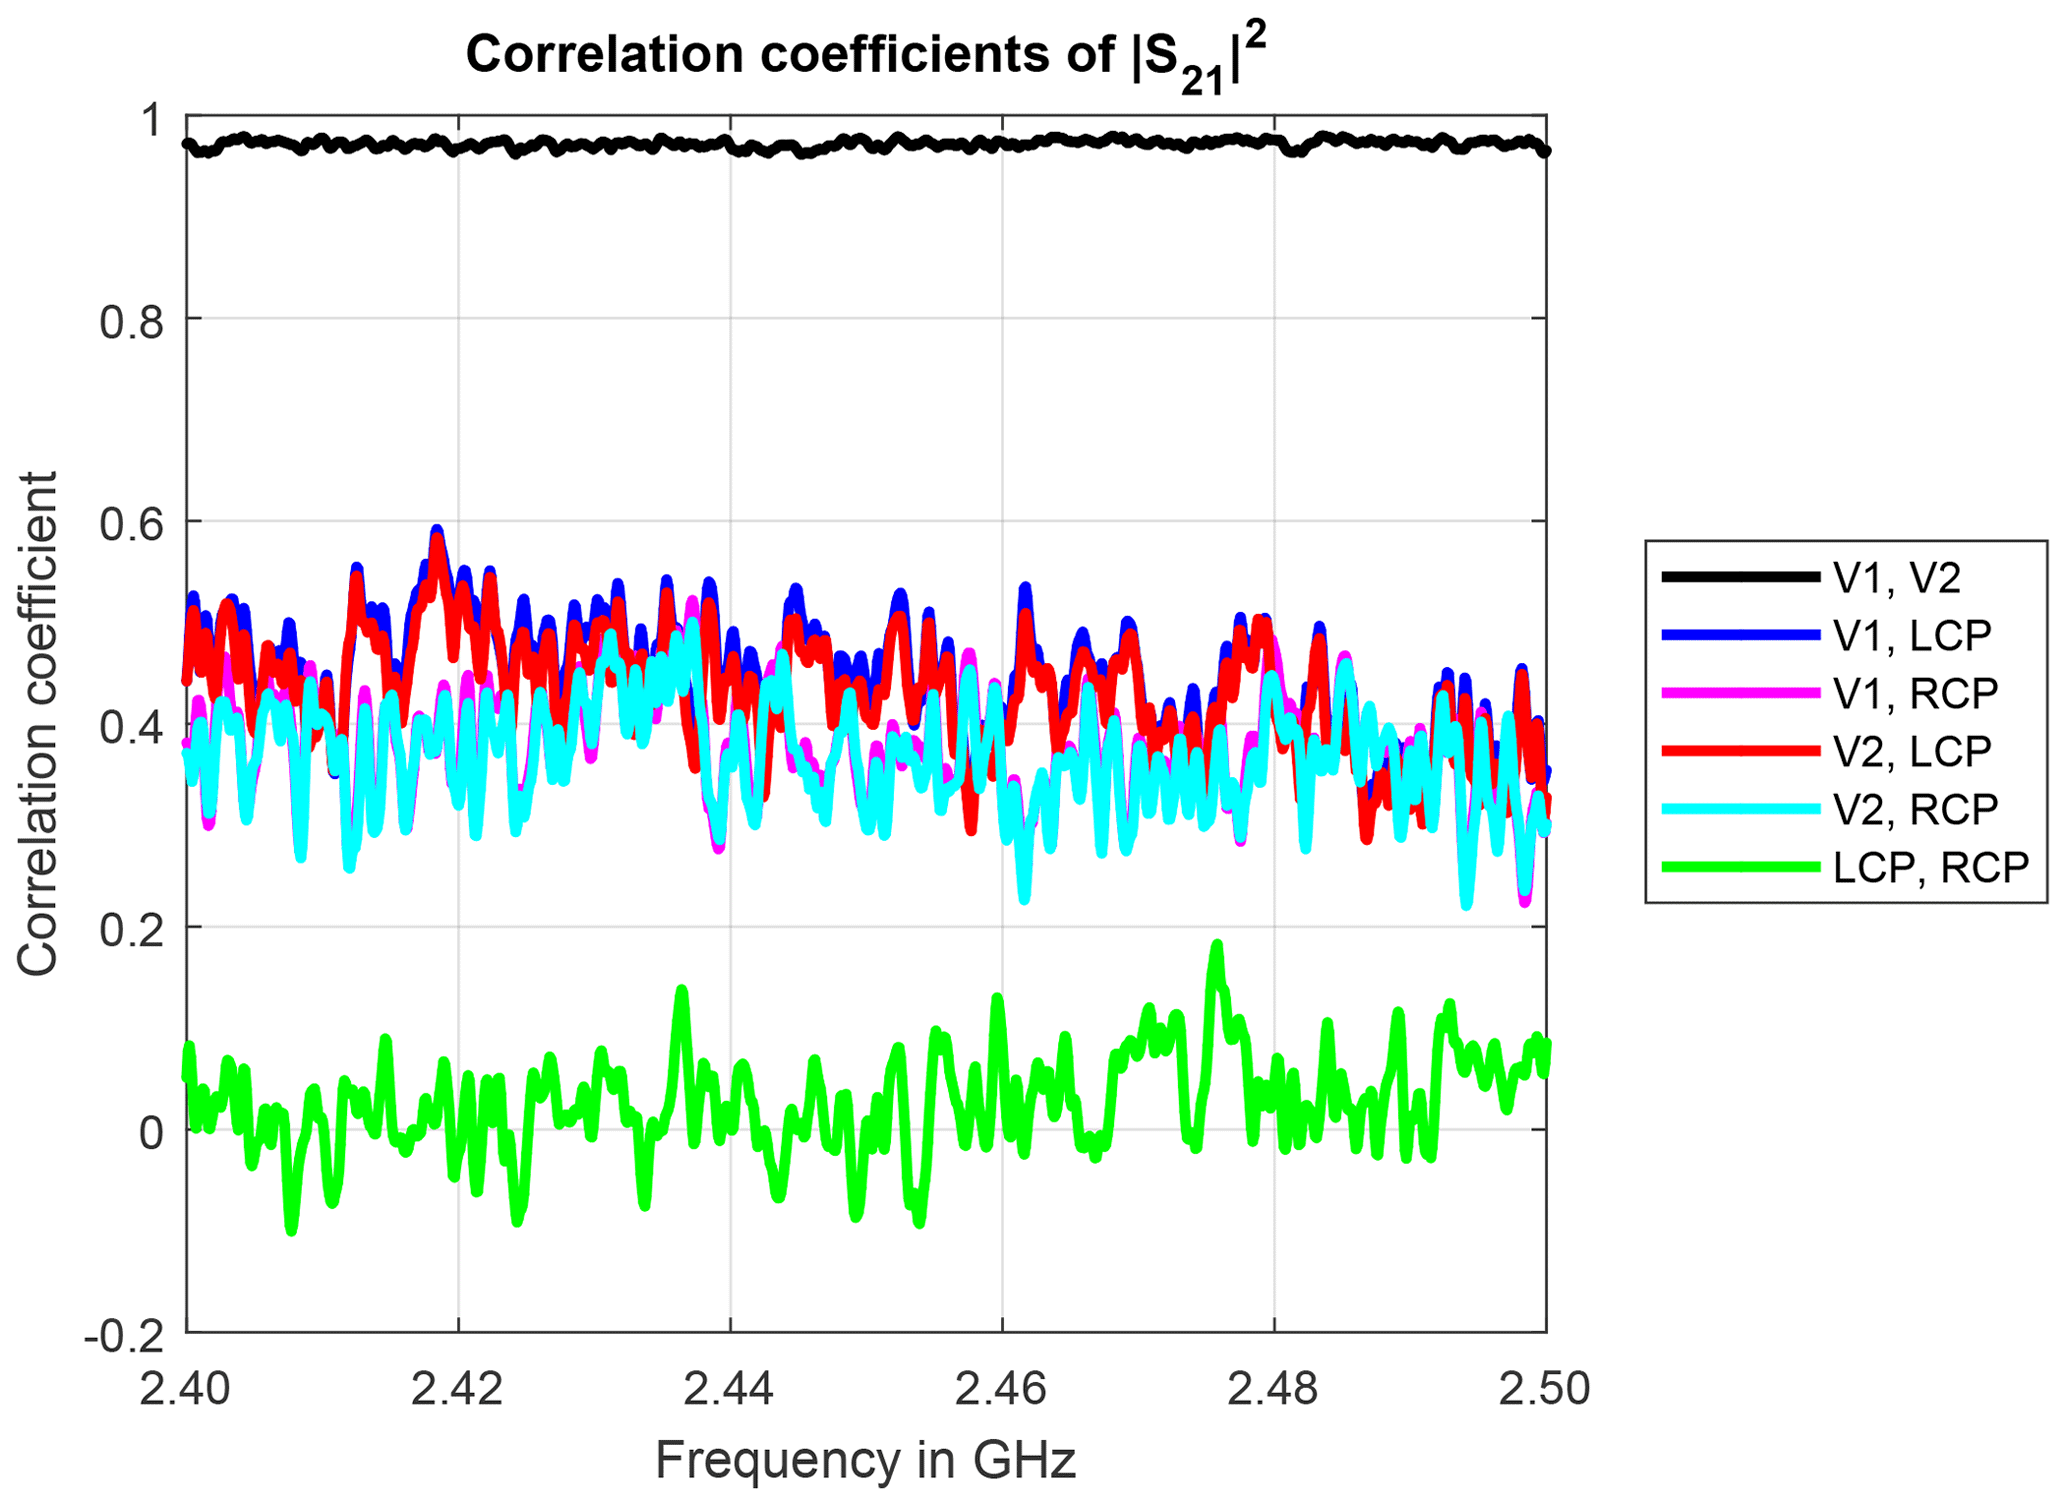
These values are lower than the expected loss due to polarization mismatch of 3 dB or 0.5 (in terms of power) between a linear polarized antenna (or electromagnetic wave) and a circularly polarized antenna (or electromagnetic wave). A slightly smaller correlation coefficient may also be caused by the minor differences in the horizontal and vertical beamwidth between the vertically polarized and circularly polarized antennas, as shown in Table 1.
Table 8Mean values of the power correlation coefficient over frequency for different antenna pairs.
3.4 Defect antenna
The average transmission of the defect antenna (DEF) without housing cover is about 5 dB lower than the average transmissions of the other ones (V1, LCP and RCP), as shown in Fig. 10.
The real and imaginary parts of the complex correlation coefficients for trial 4 are shown in Figs. 11 and 12, respectively. The real part of the complex correlation coefficients is significantly lowered for the pairs including the defect antenna. In particular, for the pair with the defect and vertical antennas (Fig. 11), it is also lower than for the intact vertically polarized antenna and a circularly polarized one (Fig. 7). The imaginary part of the complex correlation coefficients is no longer close to zero, but notably negative, indicating a negative phase offset of the underlying S21-parameter sequences.
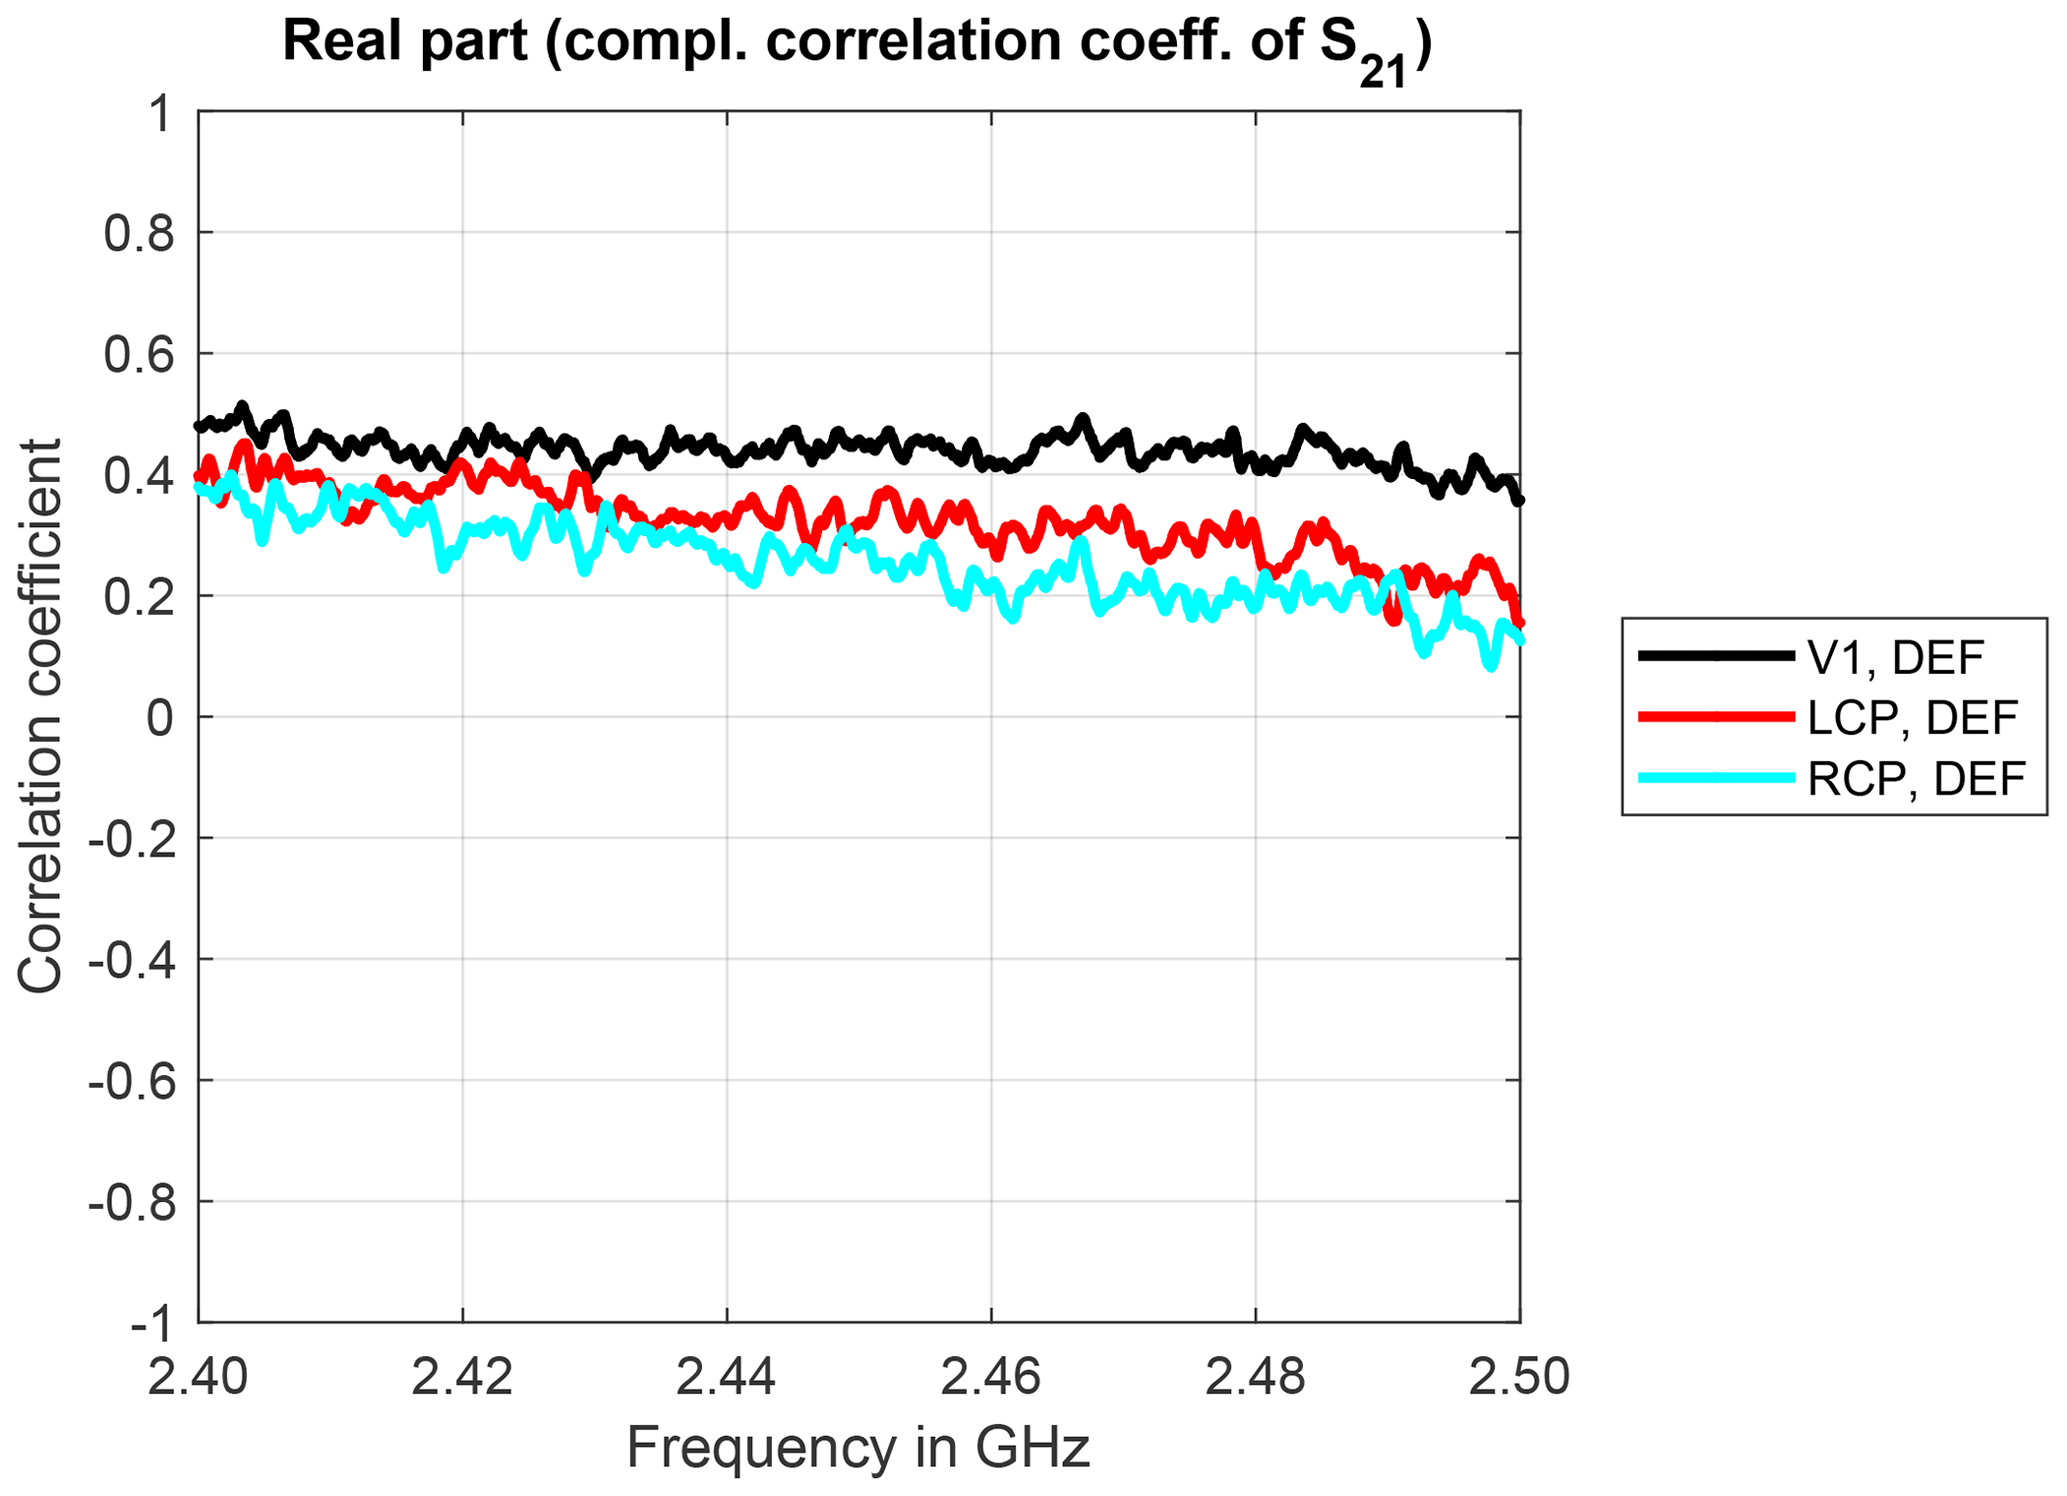
Figure 11Real part of the complex correlation coefficients for different antennas and measurement trial 4.

Figure 12Imaginary part of the complex correlation coefficients for different antennas and measurement trial 4.
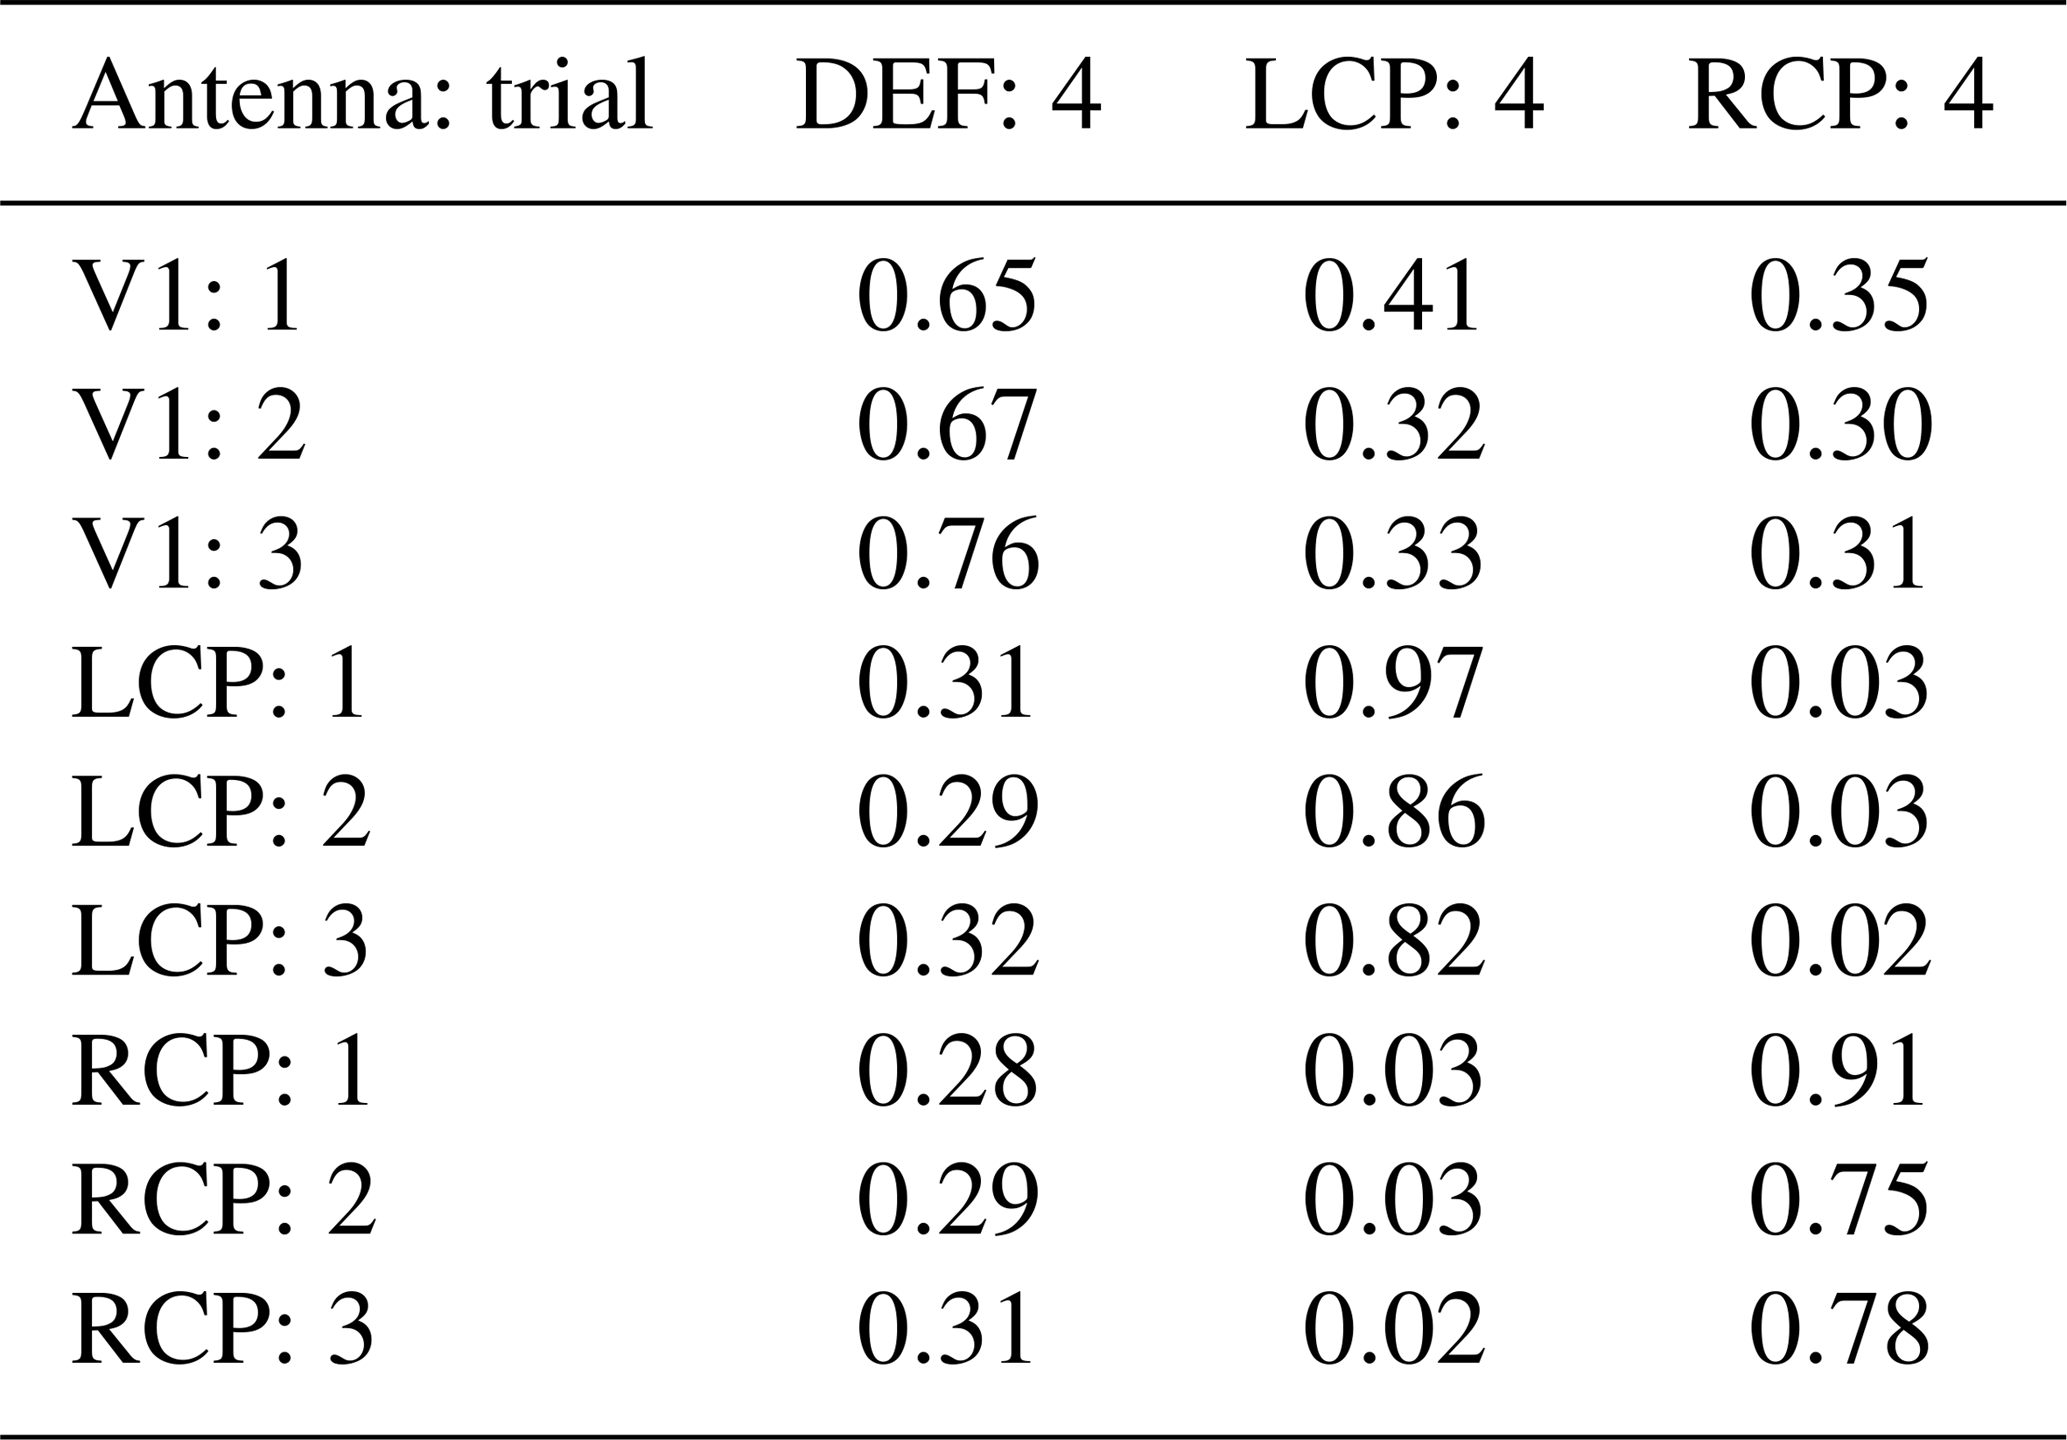
The power correlation coefficients for the antennas DEF, V1, LCP and RCP in trial 4 are shown in Fig. 13. The mean values (over frequency) for all antennas in measurement trial 4 are listed in Table 9.
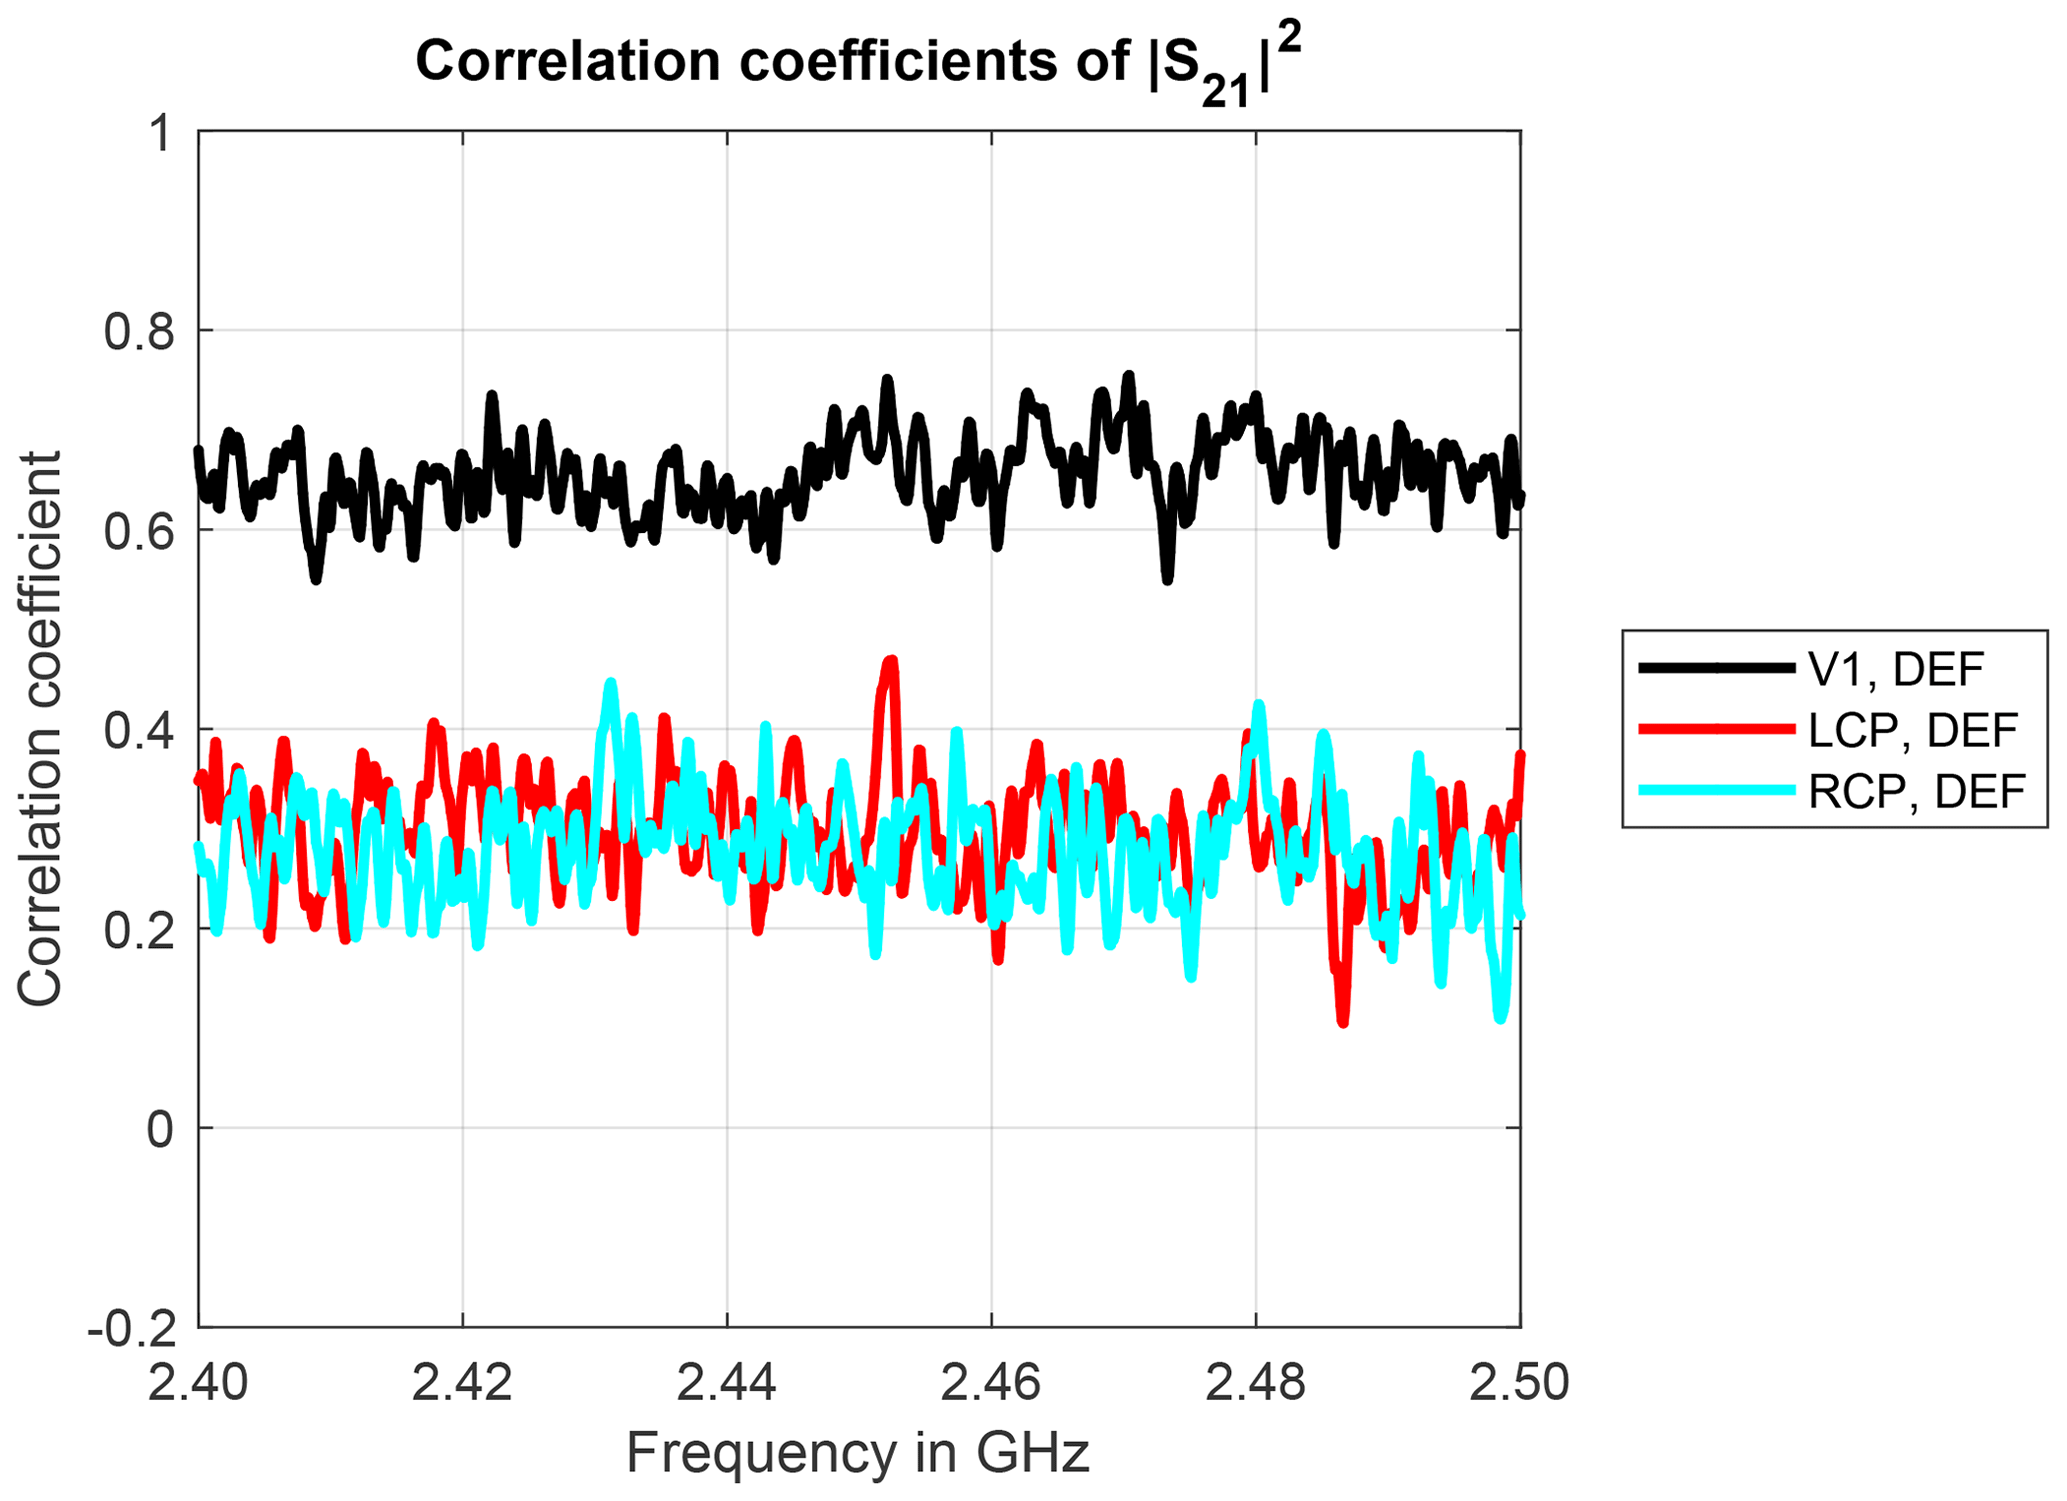
Table 9Mean values of the power correlation coefficients over frequency for different antenna pairs.
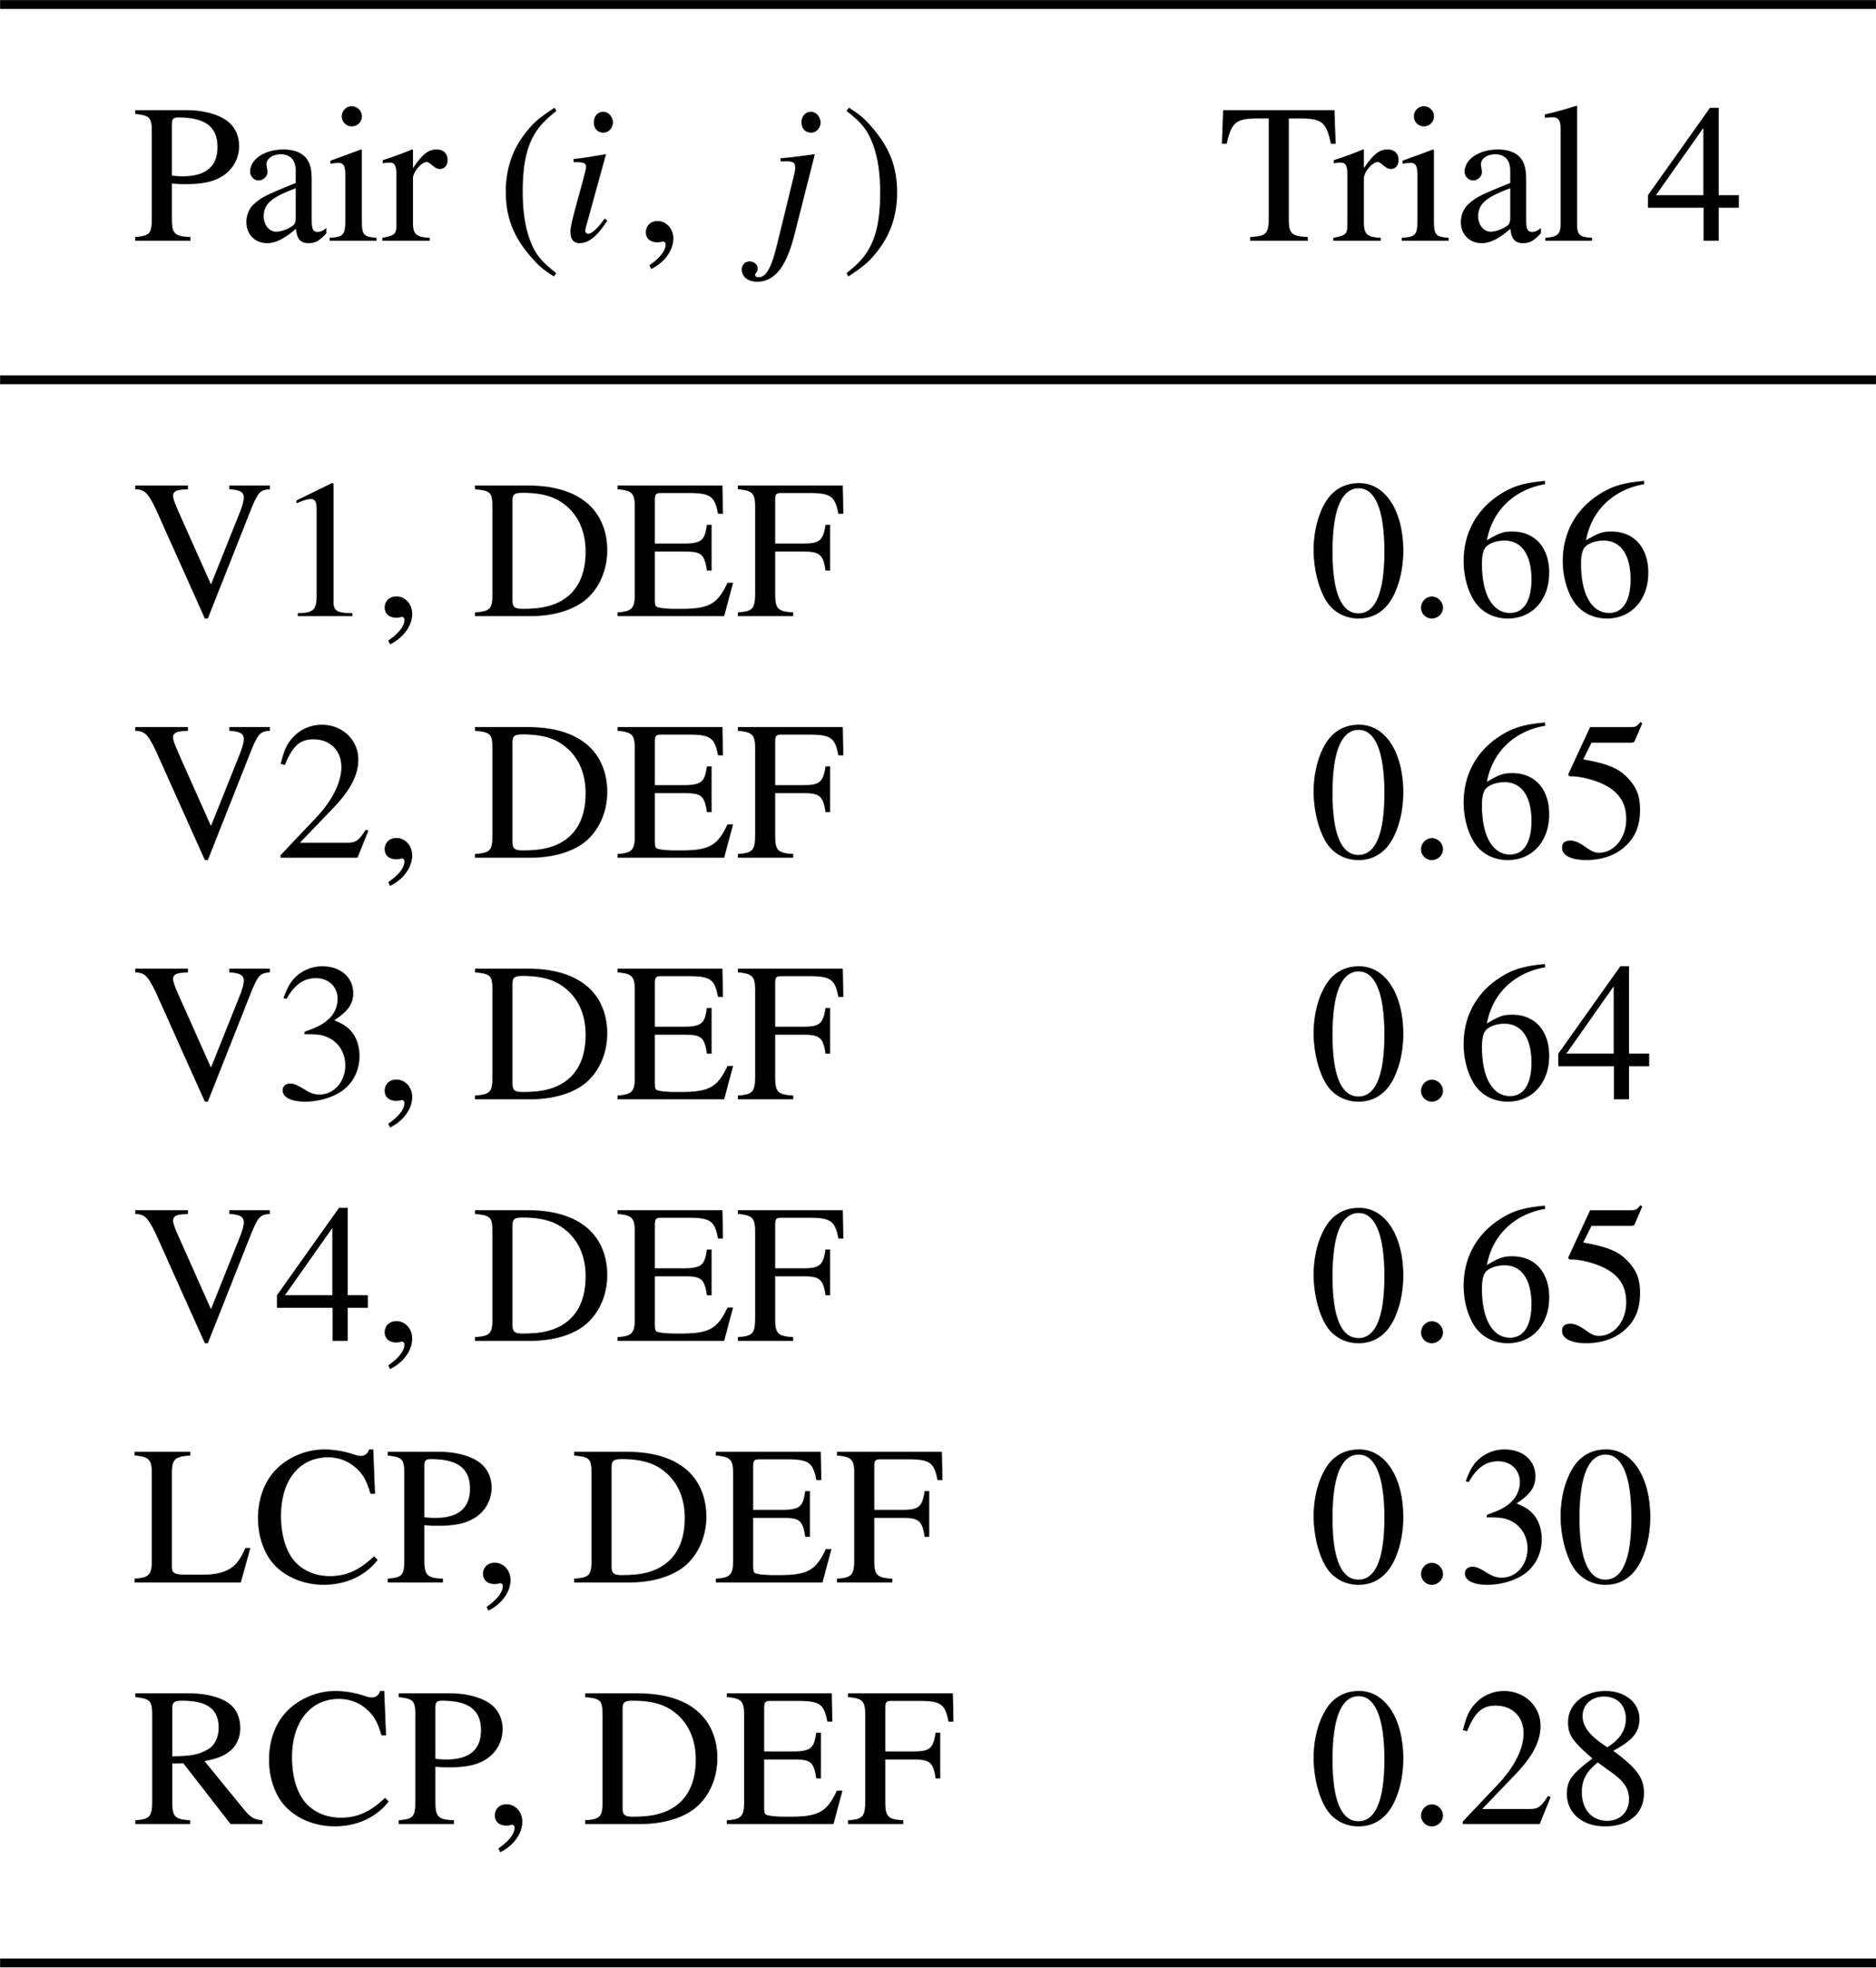
The mean power correlation coefficients between the vertically polarized antennas and the defect one are about 0.65 and are significantly lower than the pairwise power correlation coefficients between two vertically polarized antennas, which are about 0.9 (see Table 4). However, the mean power correlation coefficients between the defect antenna and a circularly polarized antenna are about 0.29 and even slightly lower than the mean correlation coefficients between a vertically and a circularly polarized antenna, as shown in Sect. 3.3. As a consequence, the defect antenna can also be detected by a low power correlation coefficient, but nevertheless the strongly reduced average transmission in this case is an indication of a deviation or defect, too.
3.5 Different antenna types across different measurement trials
Different antenna types with corresponding sample sequences originating from different measurement trials are investigated in this section. Sample sequences of antennas V1, LCP and RCP originating from measurement trials 1 to 3 are used as references and correlated with the sample sequence of antennas DEF, LCP and RCP from measurement trial 4. Hence, the feasibility of detecting a defect antenna or an antenna with another polarization across different measurement trials is investigated here. Tables 10 and 11 list the mean values (over frequency) of the real and imaginary parts of the complex correlation coefficients.
Table 10Mean values of the real part of the complex correlation coefficients over frequency for different antenna pairs. The Roman numerals indicate from which measurement trial the measured sample sequences of the specified antenna originate.

Table 11Mean values of the imaginary part of the complex correlation coefficients over frequency for different antenna pairs. The Roman numerals indicate from which measurement trial the measured sample sequences of the specified antenna originate.
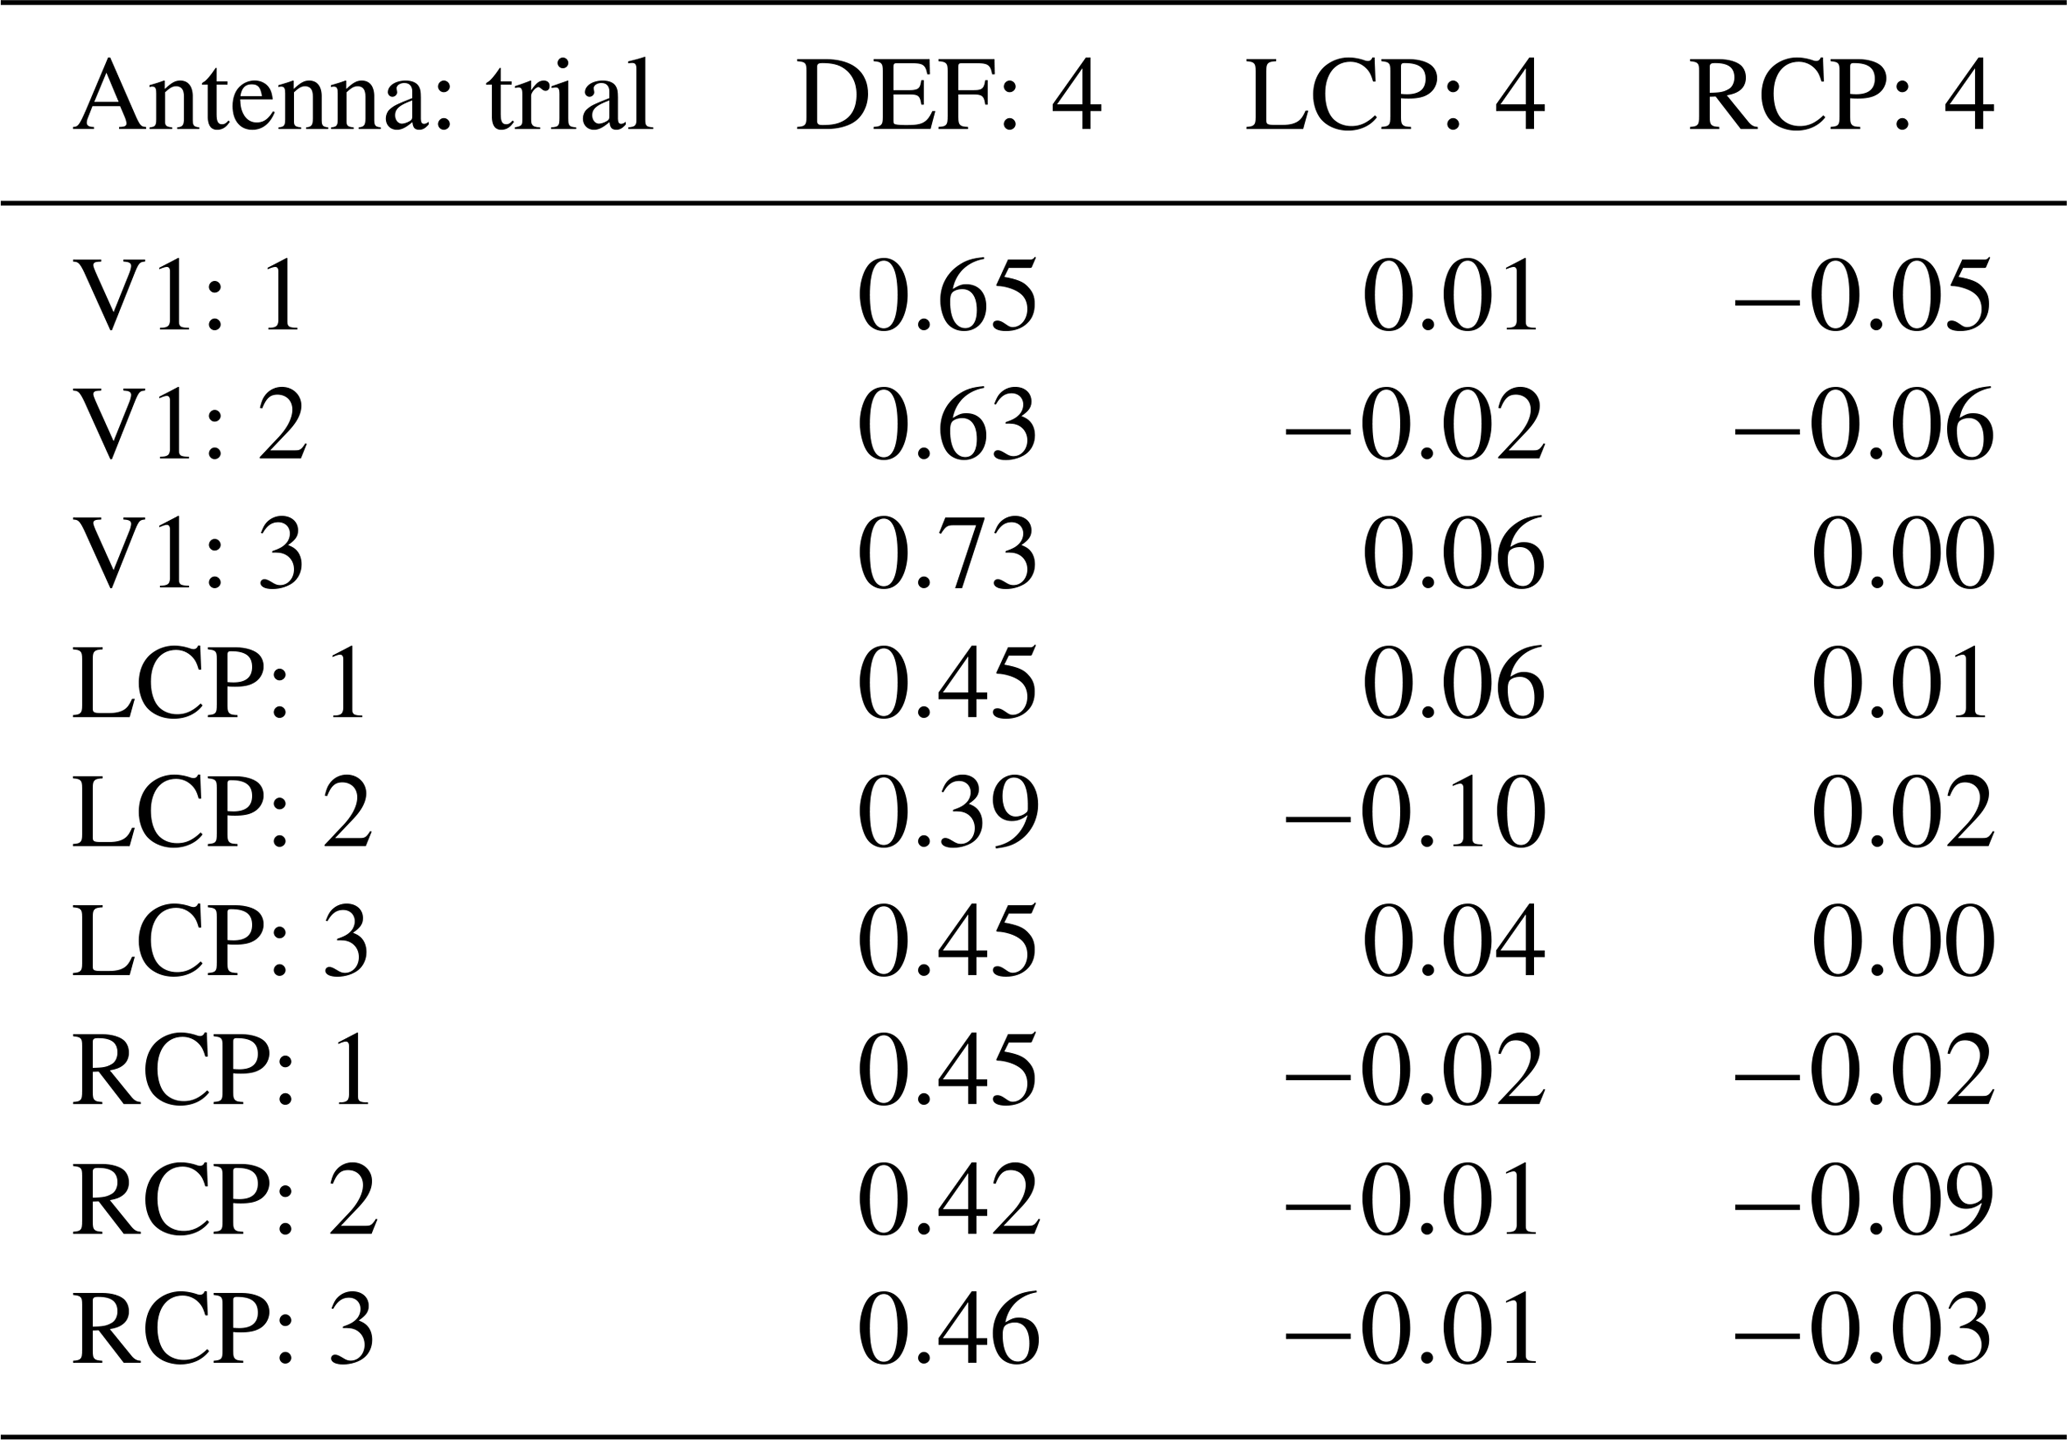
The real parts for the defect antenna DEF are close to 0.5 with antenna V1 as a reference and close to 0.3 with any circularly polarized antenna as a reference. Therefore, the defect antenna is differentiated clearly from this reference. In addition, the values are almost independent of the trial. The real parts for a circularly polarized antenna and V1 are approximately 0.55. Pairs consisting of the same antenna (either only antenna LCP or only antenna RCP) lead to highly correlated sample sequences with mean values of the real part of approximately 0.9. These results are on the same order of magnitude as in Sect. 3.2, in particular Table 5 for identically constructed antennas across different measurement trials. Instead, pairs consisting of the antennas LCP and RCP cause uncorrelated sample sequences, as already indicated in Sect. 3.3. Therefore both the mean real and imaginary correlation coefficients are close to zero in Tables 10 and 11.
The mean values of the imaginary parts for the defect antenna DEF are close to 0.67 with antenna V1 as a reference and close to 0.44 with any circularly polarized antenna as a reference. As a consequence, the differences between the antennas across different measurement trials can easily be detected from the complex correlation coefficients.
The mean values (over frequency) of the power correlation coefficients are listed in Table 12. The average values for the pair V1 and DEF are approximately 0.7. For comparison, the values for identically constructed antennas across different measurement trials are approximately 0.76 (Sect. 3.2). Hence, the power correlation coefficients are just marginally lowered on average for the defect antenna. Hence, a reliable detection of the defect antenna from the power correlation coefficients across different measurement trials is not always possible.
The power correlation coefficients for the pairs including a circularly polarized antenna (LCP or RCP) and the defect antenna are around 0.3 and therefore on the same order of magnitude as in Sect. 3.4. As a consequence, there is only a marginal deviation due to different trials, and the difference between the antennas is notable.
Table 12Mean values of the power correlation coefficients over frequency for different antenna pairs. The Roman numerals indicate from which measurement trial the measured sample sequences of the specified antenna originate.
A novel approach to utilize the correlation between measured sample sequences of EUTs in a RC in order to detect deviations from a reference has been presented in this paper. If the position of the EUT and the configuration of the RC were kept the same, identically constructed EUTs induce highly correlated sample sequences, whereas differences between the radiation characteristics, in particular different polarizations, can easily be detected. Furthermore, identically constructed EUTs measured on different days with different VNA calibrations (i.e., across different measurement trials) are highly correlated. Hence it is possible to utilize sample sequences measured as a reference for a re-calibrated setup, typically. Also, differences between the directional diagrams of two EUTs can be detected, as this also results in a different weighting of the electromagnetic field components and thus causes decorrelation.
The measurements indicate that the complex correlation coefficients are more sensitive to deviations as they allow an analysis by the corresponding real and imaginary parts. In particular, if the underlaying sample sequences originate from different measurement trials, the complex correlation coefficients are more suitable than the power correlation coefficients. Nevertheless, as many active devices provide only a magnitude (like a RSSI value without any phase information), the measurements show that deviations from a given reference can also be detected by utilizing the power correlation coefficients, generally.
This new approach can be used to extend the existing methods to measure, e.g., TRP or TIS in a RC (e.g., 3GPP, 2017a, 2016). For example, two EUTs with the same housing were measured in a RC with the classic method and showed the same TRP or TIS values. Using the approach presented above to apply correlation, the two measured sample sequences can provide a conclusion on the equality of the radiation characteristics. Therefore, no extra measurement equipment or measurement time is needed, as the measurement sample sequences are recorded anyway, typically.
The underlying measurement data are not publicly available and can be requested from the authors if required.
The authors declare that they have no conflict of interest.
This article is part of the special issue “Sensors and Measurement Systems 2018”. It is a result of the “Sensoren und Messsysteme 2018, 19. ITG-/GMA-Fachtagung”, Nürnberg, Germany, from 26 June 2018 to 27 June 2018.
This article is an extended article version of the article “Employing correlation for wireless device characterization in reverberation chambers” presented at the Conference “19. ITG/GMA-Fachtagung Sensoren und Messsysteme”, Nuremberg, Germany, 26 June–27 June 2018. It is published with the kind permission of VDE VERLAG GmbH, Berlin, Germany.
This paper was edited by Leonhard Reindl and reviewed by three anonymous referees.
Amador, E., Lemoine, C., and Besnier, P.: Numerical study of spatial correlation in reverberation chamber, Electron. Lett., 47, 1319–1320, https://doi.org/10.1049/el.2011.3180, 2011. a, b
Bluetest AB: Reverberation Test Systems RTS 60, available at: https://bluetest.se/products/chambers (last access: 26 April 2019), 2018. a
Cammin, C., Krush, D., Heynicke, R., and Scholl, G.: Messtechnische Evaluierung einer Modenverwirbelungskammer als Testumgebung für drahtlose Sensor/Aktor-Module, tm – Technisches Messen, 84, 106–115, https://doi.org/10.1515/teme-2017-0049, 2017. a
Cammin, C., Krush, D., Heynicke, R., and Scholl, G.: Test method for narrowband F/TDMA-based wireless sensor/actuator networks including radio channel emulation in severe multipath environments, J. Sens. Sens. Syst., 7, 183–192, https://doi.org/10.5194/jsss-7-183-2018, 2018. a
Chen, X.: Experimental Investigation of the Number of Independent Samples and the Measurement Uncertainty in a Reverberation Chamber, IEEE T. Electromag. Compatibil., 55, 816–824, https://doi.org/10.1109/TEMC.2013.2242473, 2013. a
Chen, X. and Kildal, P. S.: On S-parameter based complex correlation of multi-port antenna, in: The 2015 9th European Conference on Antennas and Propagation (EuCAP), 13–17 April 2015, Lisbon, Portugal, 1–4, 2015. a
Chen, X., Kildal, P. S., and Carlsson, J.: Spatial correlations of incremental sources in isotropic environment such as reverberation chamber, in: Proceedings of the 5th European Conference on Antennas and Propagation (EUCAP), 10–15 April 2011, Rome, Italy, 1753–1757, 2011. a
Delangre, O., Doncker, P. D., Lienard, M., and Degauque, P.: Analytical angular correlation function in mode-stirred reverberation chamber, Electron. Lett., 45, 90–91, https://doi.org/10.1049/el:20093099, 2009. a
Deutsches Institut für Normung e.V. (DIN): DIN EN 61000-4-21:2011-12; VDE 0847-4-21:2011-12, Elektromagnetische Verträglichkeit (EMV) – Teil 4–21: Prüf- und Messverfahren – Verfahren für die Prüfung in der Modenverwirbelungskammer (IEC 61000-4-21:2011); Deutsche Fassung EN 61000-4-21:2011, available at: http://www.beuth.de/de/norm/din-en-61000-4-21/145741951 (last access: 26 April 2019), 2011. a, b, c
Gradoni, G., Primiani, V. M., and Moglie, F.: Determination of the reverberation chamber stirrer uncorrelated positions by means of the spatial and frequency correlation matrix, in: 2013 International Symposium on Electromagnetic Compatibility, 2–6 September 2013, Brugge, Belgium, 425–430, 2013. a
Holloway, C. L., Hill, D. A., Ladbury, J. M., Wilson, P. F., Koepke, G., and Coder, J.: On the Use of Reverberation Chambers to Simulate a Rician Radio Environment for the Testing of Wireless Devices, IEEE T. Anten. Propag., 54, 3167–3177, https://doi.org/10.1109/TAP.2006.883987, 2006. a
Huber + Suhner: SENCITY Spot-S Indoor Antenna 1324.19.0007, available at: https://ecatalog.hubersuhner.com/product/E-Catalog/Radio-frequency/Antennas-accessories/Antennas/1324-19-0007 (last access: 26 April 2019), 2019a. a
Huber + Suhner: SENCITY Spot-S Indoor Antenna 1324.19.0008, available at: https://ecatalog.hubersuhner.com/product/E-Catalog/Radio-frequency/Antennas-accessories/Antennas/1324-19-0008 (last access: 26 April 2019), 2019b. a
Huber + Suhner: SENCITY Spot-S Indoor Antenna 1324.19.0002, avialable at: https://ecatalog.hubersuhner.com/product/E-Catalog/Radio-frequency/Antennas-accessories/Antennas/1324-19-0002 (last access: 26 April 2019), 2019c. a
Janssen, N., Remley, K. A., Holloway, C. L., and Young, W. F.: Correlation coefficient and loading effects for MIMO antennas in a reverberation chamber, in: 2013 International Symposium on Electromagnetic Compatibility, 2–6 September 2013, Brugge, Belgium, 2013. a
Kildal, P. S. and Rosengren, K.: Correlation and capacity of MIMO systems and mutual coupling, radiation efficiency, and diversity gain of their antennas: simulations and measurements in a reverberation chamber, IEEE Commun. Mag., 42, 104–112, https://doi.org/10.1109/MCOM.2004.1367562, 2004. a
Kildal, P. S., Chen, X., Orlenius, C., Franzen, M., and Patane, C. S. L.: Characterization of Reverberation Chambers for OTA Measurements of Wireless Devices: Physical Formulations of Channel Matrix and New Uncertainty Formula, IEEE T. Anten. Propag., 60, 3875–3891, https://doi.org/10.1109/TAP.2012.2201125, 2012. a, b
Kostas, J. G. and Boverie, B.: Statistical Model for a Mode-Stirred Chamber, IEEE T. Electromag. Compatibil., 33, 366–370, https://doi.org/10.1109/15.99120, 1991. a
Pfennig, S.: A General Method for Determining the Independent Stirrer Positions in Reverberation Chambers: Adjusting the Correlation Threshold, IEEE T. Electromag. Compatibil., 58, 1252–1258, https://doi.org/10.1109/TEMC.2016.2567541, 2016. a
Pirkl, R. J., Remley, K. A., and Patane, C. S. L.: Reverberation Chamber Measurement Correlation, IEEE T. Electromag. Compatibil., 54, 533–545, https://doi.org/10.1109/TEMC.2011.2166964, 2012. a
Rohde & Schwarz: R & S ZNB Vector Network Analyzer – Brochures and Data Sheets, available at: https://www.rohde-schwarz.com/us/brochure-datasheet/znb/, last access: 26 April 2019. a
Schwab, A. J. and Kürner, W.: Elektromagnetische Vertäglichkeit, in: VDI-Buch, 6. bearb. und aktualisierte Aufl. edn., Springer, Berlin, 2011. a
3GPP: 3GPP TS 34.114 V12.2.0 (2016-09): User Equipment (UE)/Mobile Station (MS) Over The Air (OTA) antenna performance; Conformance testing, available at: https://portal.3gpp.org/desktopmodules/Specifications/SpecificationDetails.aspx?specificationId=2361 (last access: 26 April 2019), 2016. a, b
3GPP: 3GPP TR 25.914 V14.0.0 (2017-03): Measurements of radio performances for UMTS terminals in speech mode, available at: https://portal.3gpp.org/desktopmodules/Specifications/SpecificationDetails.aspx?specificationId=1343 (last access: 26 April 2019), 2017a. a, b
3GPP: 3GPP TR 37.977 V14.3.0 (2017-03): Universal Terrestrial Radio Access (UTRA) and Evolved Universal Terrestrial Radio Access (E-UTRA); Verification of radiated multi-antenna reception performance of User Equipment (UE), available at: https://portal.3gpp.org/desktopmodules/Specifications/SpecificationDetails.aspx?specificationId=2637 (last access: 26 April 2019), 2017b. a