the Creative Commons Attribution 4.0 License.
the Creative Commons Attribution 4.0 License.
 | 08 Jan 2019
Flexible piezoresistive sensor matrix based on a carbon nanotube PDMS composite for dynamic pressure distribution measurement
Rajarajan Ramalingame
Zheng Hu
Carina Gerlach
Dhivakar Rajendran
Tatiana Zubkova
Reinhard Baumann
Olfa Kanoun
A highly flexible, piezoresistive sensor matrix based on a carbon nanotube (CNT) polymer composite is developed for pressure distribution measurement applications. With an overall height of about 400 µm, the sensors can measure pressure directly, without any deformation elements, such as a cantilever or a deformation membrane. The measurement range is from 2.5 to 640 kPa. Both the position and the pressure of the applied load can be measured and visualized as a resistance change. The relative resistance measurement deviation of the data acquisition system is lower than 3 % for the resistance range of 610Ω to 380 kΩ. This corresponds to a systematic deviation of pressure measurement of less than 3 % in the measurement range. Besides the measurement of pressure, different sizes of loads can be detected as well. The developed fast and compact measurement system allows dynamic pressure measurement, such as gait analysis when used in an insole application.
- Article
(3497 KB) - Full-text XML
- BibTeX
- EndNote


The need for thin and flexible sensor matrices for the measurement of pressure distribution is increasing, e.g. in plantar pressure distribution measurement to monitor critical pressure values as an insole in everyday use (Gurney et al., 2008) or as tactile sensitive skin in robotics (Someya et al., 2005). The measurement of pressure distribution is also important for the recognition of shapes in different fields of applications, e.g. the detection of a fallen and procumbent person (Lauterbach et al., 2012) with a sensor matrix on the floor with differentiation of other objects at the same time (Mihai et al., 2016) for ambient assisted living systems. In these applications, conventional silicon-based pressure sensors get to their limits because they allow only a punctual measurement and because of lack of flexibility and sensor dimension in direction of the applied pressure force. To overcome these issues polymer-based films containing conducting filler particles are promising materials, able to realize piezoresistive sensors with less thickness, which are printable and therewith low-cost in fabrication as well as scalable in different dimensions ranging from a single sensor to large-area sensor matrix. Such polymer-based sensors are being commercially implemented for health monitoring applications like insoles by Novel, Tekscan, Parotec, etc. The pressure range of these sensors varies from 260 to 1200 kPa with the number of sensor elements from 6 to 960 and a thickness of around 2 mm (Abdul Razak et al., 2012). In comparison to capacitive sensors, piezoresistive sensors require a less complex data acquisition system and are less sensitive to electromagnetic noise (Amjadi et al., 2016; Kappassov et al., 2015). The choice of nanofiller in the polymer matrix determines the piezoresistive property of the composite. Carbon nanotubes (CNTs) have been used as nanofillers in several works, with a concentration in the range of 1 wt % (Costa and Choi, 2017) to 8 wt % (Yogeswaran et al., 2015) and a maximum pressure ranging from 5 kPa (Costa and Choi, 2017) to 200 kPa (So et al., 2013). A CNT polymer-based piezoresistive sensor matrix (Gerlach et al., 2015), with 64 sensor elements, pressure sensitivity in the range of 4.7 to 17.4 kPa, insoles (Ramalingame et al., 2017a) with 6 sensor elements and a pressure range of 45 to 200 kPa, were implemented for foot ulceration, posture and gait-monitoring applications.
In this paper, the aim is to improve the sensor quality with better sensing properties including higher sensitivity and improved homogeneity. We propose a multiwalled carbon nanotube (MWCNT) polymer-based piezoresistive sensor matrix with 0.7 wt % MWCNTs, which will be placed on a 16-electrode sensor matrix, printed on a flexible and temperature stable polyimide foil. For measurement, an automatic addressing and readout data acquisition system with colour-coded visualization that utilizes fast signal processing and dynamic measurements is realized.
A flexible temperature- and humidity-stable Kapton thin film (Dupont) with a thickness of 125 µm was pre-cleaned with isopropanol and then the electrode structure was screen printed with silver nano-ink and cured at 150 ∘C for 2 h in an oven (see Fig. 1), following the procedure described in Ramalingame et al. (2017a). On the top side, rows of connected circular interdigital electrodes with a line thickness of 100 µm were printed. Then a through hole was inserted in the innermost segment of each electrode. On the reverse side, 1 mm wide silver conductor tracks were printed perpendicular to the electrode lines, intersecting the through holes of the upper side and establishing contact. The measured resistance across each electrode structure was in the range of 0.8Ω±0.2Ω.
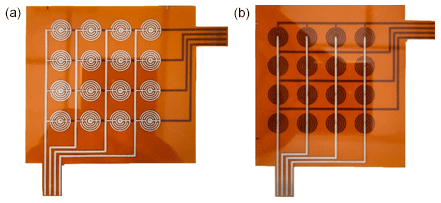
Figure 1Electrode matrix design: silver electrodes on polyimide foil – upper side (a) and reverse side (b).
The functional sensor layer was synthesized by means of a polymer nanocomposite. Polydimethylsiloxane (PDMS, Sylgard 184, Dow Corning) was a desirable choice of polymer because of its biocompatibility, flexibility and temperature stability up to 300 ∘C. MWCNTs (Sigma Aldrich) were dispersed into a PDMS matrix using organic solvents. Since the homogeneity of the composite, including an adequate unbundling of the MWCNTs, is particularly important for large-surface sensors, dispersion and composite production were optimized (Ramalingame et al., 2017b). The nanocomposite was produced by initially pre-dispersing 0.7 wt % MWCNTs into 5 g tetrahydrofuran (THF) using ultrasonication with sonotrode (Bandelin, tip diameter: 3 mm) and magnetic stirring with CAT-M32. Subsequently, 5 g of PDMS was added to the dispersion and dispersed again by ultrasonication and magnetic stirring. Later, the crosslinker was added to the dispersion at a ratio of 10:1 (dispersion : crosslinker) and mixed thoroughly for 15 min. The MWCNT-PDMS dispersion was poured into a 10 cm×10 cm casting mould and cured at 120 ∘C for 4 h in an oven. The composite produced in this way is self-adhesive and was placed on top of the printed electrode structure. The total thickness of the synthesized sensor layer is ∼400 µm. The self-adhesive MWCNT-PDMS composite on the Kapton substrate with electrodes is shown in Fig. 2.
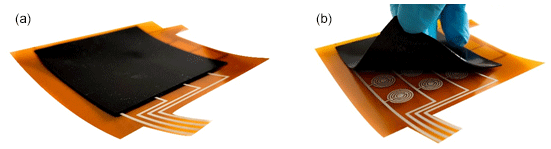
Figure 2(a) Sensor matrix based on a CNT polymer composite on Kapton substrate. (b) Self-adhesive property of the polymer composite on the electrode structure.
For the sensor matrix, a data acquisition and visualization system were developed that includes an Arduino microcontroller together with a Python-based graphic user interface (GUI). Figure 3 shows the schematic representation of the system on the left and the actual sensor matrix with the hardware circuit on the right. The hardware circuit needs 270 ms for addressing and data acquisition. It takes 440 ms for the GUI software for resistance calculation and graphical representation. The data transmission time between the software and hardware is 210 ms (USB or Bluetooth serial). The complete measurement cycle for all the 16 sensor points in the matrix requires a measurement time of less than 1 s, at 920 ms.
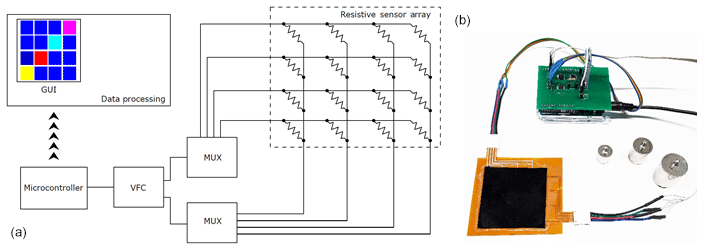
Figure 3Schematic representation (a) and the sensor matrix with the hardware set-up (b) of the data acquisition system.
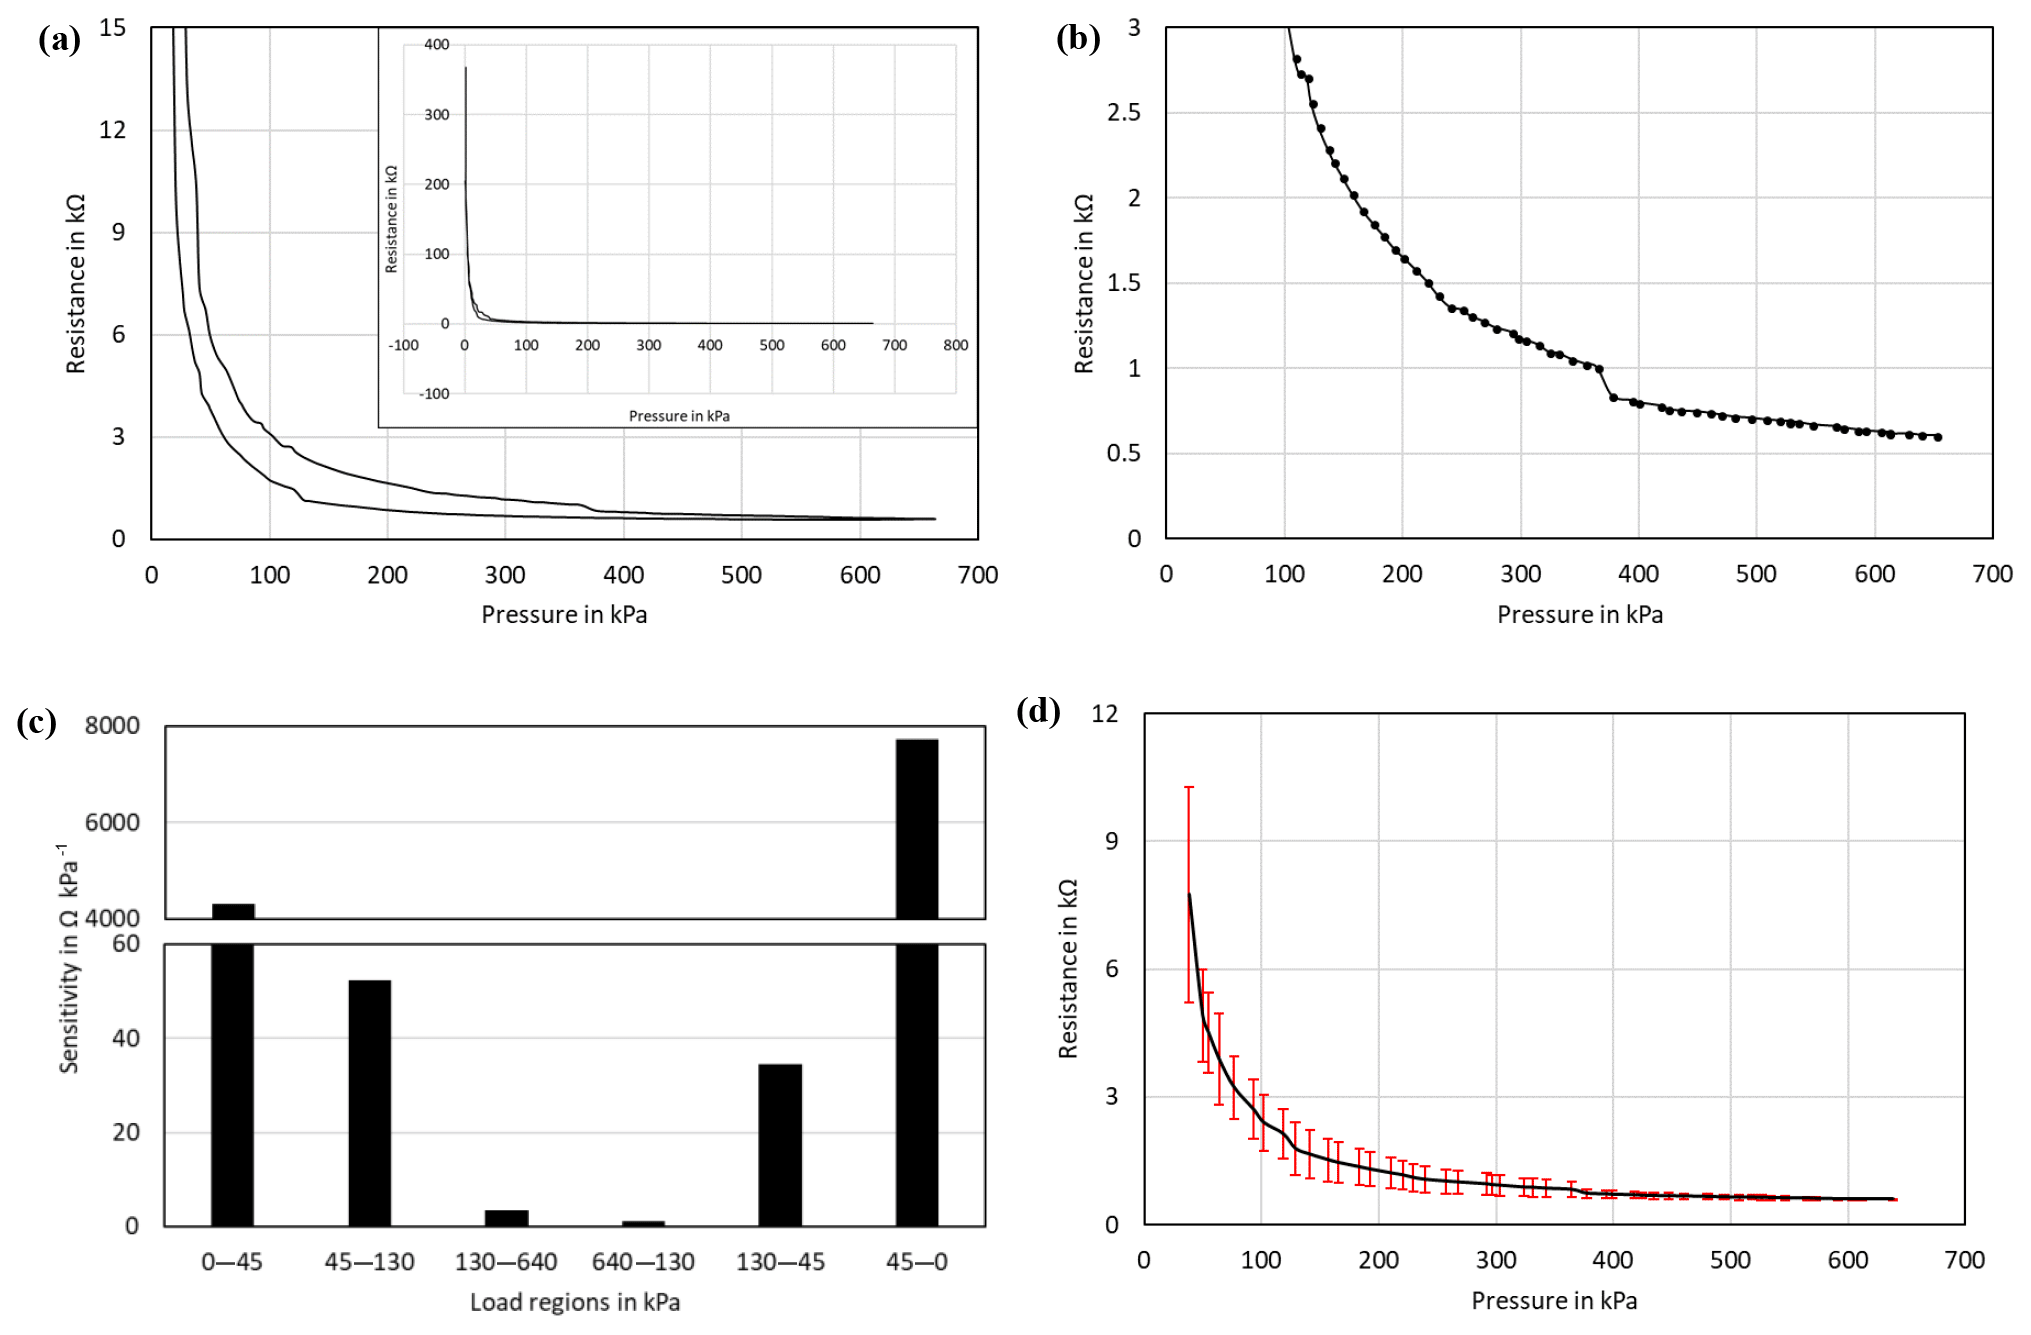
Figure 4(a) Piezoresistive response of the sensor under applied load in nominal operation range and complete operation range (inner figure). (b) Response with reduced sensitivity at higher loading conditions. (c) Sensitivity scale in different loading regions of the sensor. (d) Hysteresis of the sensor during the loading–unloading cycle.
As the sensor matrix is two-dimensional, the data acquisition system is equipped with a voltage feedback circuit (VFC) (Wu et al., 2014), to eliminate the cross-talking effect within the individual elements of the matrix and thereby reducing the measurement deviation (Hu et al., 2018) caused by extra current paths through other un-targeted sensor elements (D'Alessio, 1999). A prior experiment on the data acquisition system consisted of a 4×4 matrix with standard variable resistors, in which the change in the value of any desired resistor element pressure sensing behaviour of the matrix was simulated (Hu et al., 2018). Based on the experimental results in Hu et al. (2018), the relative resistance measurement deviation between the actual resistance value and the measured resistance value of this system is lower than 3 % within the resistance range of 2 kΩ to 1 MΩ and 10 % within the range of 1 to 5 MΩ. The VFC module in this work has been improved with better amplifiers and suitable reference resistors so that the maximum relative measurement deviation is ensured to be less than 3 % within the working resistance range of the sensor material, which is around 610Ω to 380 kΩ. Meanwhile, the GUI is designed and developed in Python and can display the measured resistance value of each sensor unit in addition to the colour-coded bar function to visualize the different measured resistance values. The GUI is also capable of presenting relative resistance value change of each sensor unit and comparing to its initial resistance value, which is recorded during the calibration stage when the sensor matrix is not under pressure.
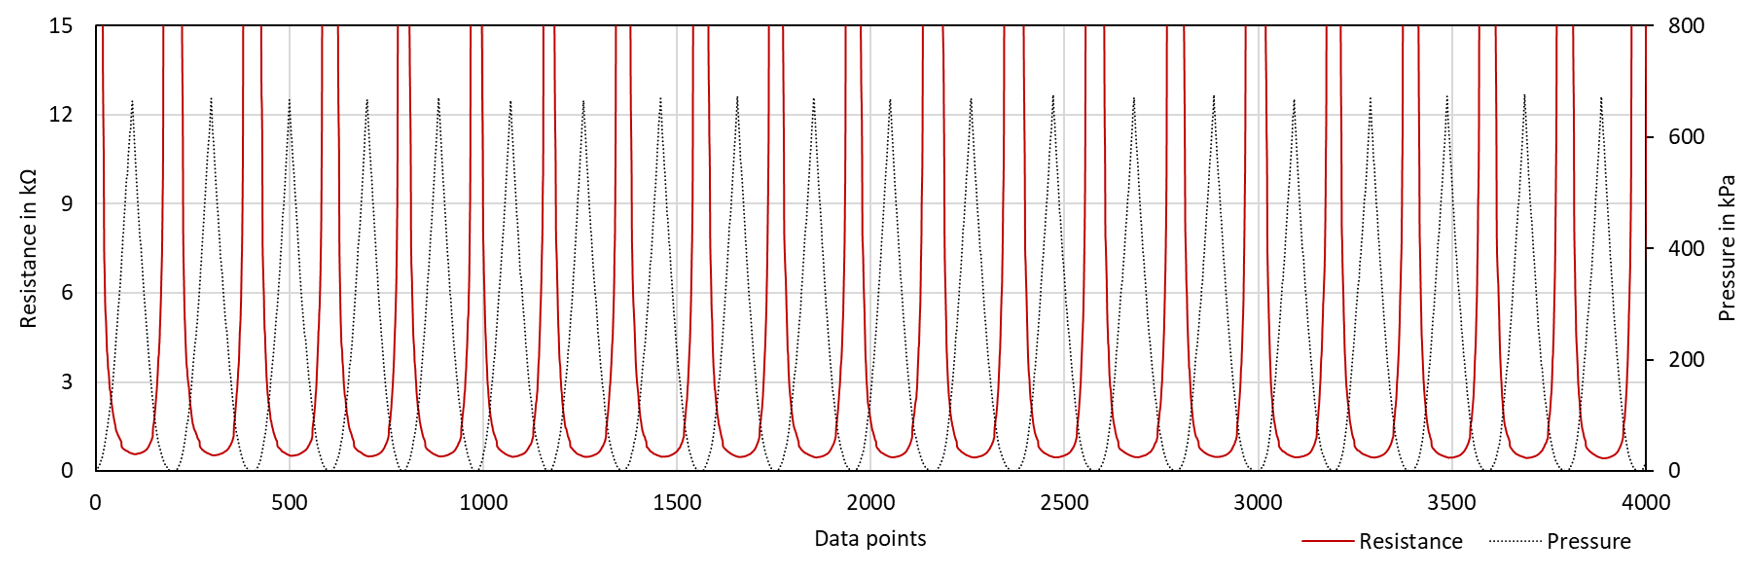
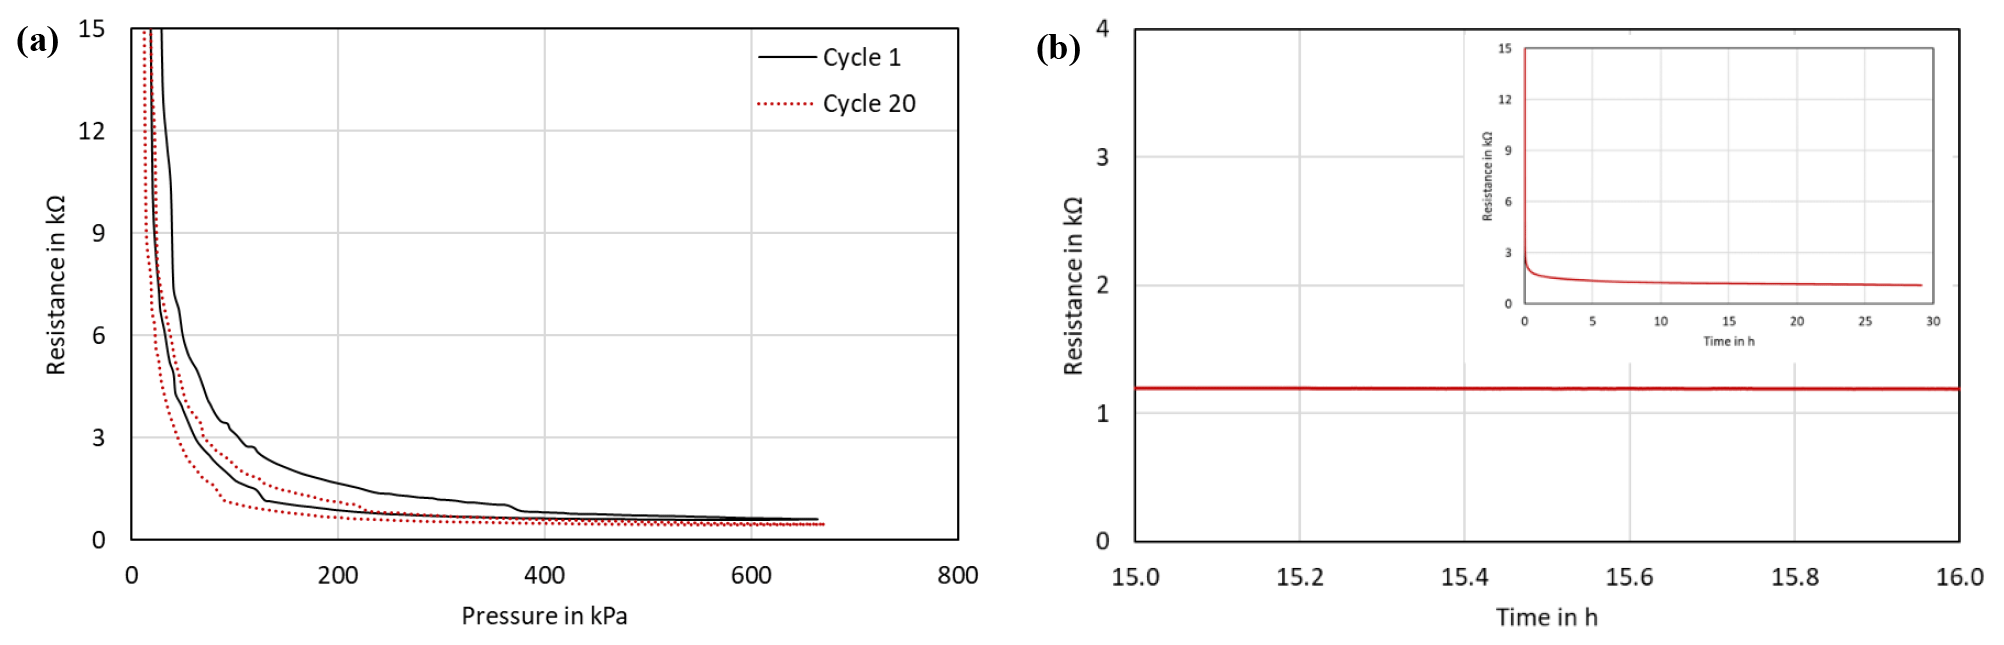
Figure 6(a) Repeatability of the sensor after 20 continuous pressure cycles. (b) Stability of the sensor at a constant load of 25 N over 28 h.
To investigate the piezoresistive behaviour of the nanocomposite pressure sensor matrix a measurement set-up is used that comprises of a digital multimeter (Agilent 34401A) interfaced to a custom-built pressure measurement test bench equipped with a high-resolution load cell (K307M.200) allowing a maximum load of 200 N. The pressure sensing principle of the nanocomposite is an effect of compression and relaxation behaviour of the polymer under pressure, which results in a change of the distance between individual MWCNTs within the polymer matrix. As the MWCNTs are concealed in the polymer, there exists always a minimum distance between the dispersed individual CNTs. Hence, a predominantly tunnelling effect takes place between the dispersed CNTs. Under pressure, the distance between the CNTs is reduced, hence promoting more tunnelling with one or more adjacent CNTs. The overall resistance of the sensor decreases with increasing pressure following the piezoresistive property of the fabricated material. At no load condition, the sensor placed on top of the electrode structure exhibits a base resistance of ∼380 kΩ. By the application of pressure, the resistance gradually decreases to a point of a sudden drop, at which the sensor is completely in contact with the underlying electrode. This is the nominal pressure (∼45 kPa), at which a stable measurement of the sensor is possible, and the corresponding resistance is ∼15 kΩ. Further increases in load lead to the formation of more conductive paths as the tunnelling gaps between MWCNTs are greatly reduced, resulting in a further decrease in resistance.
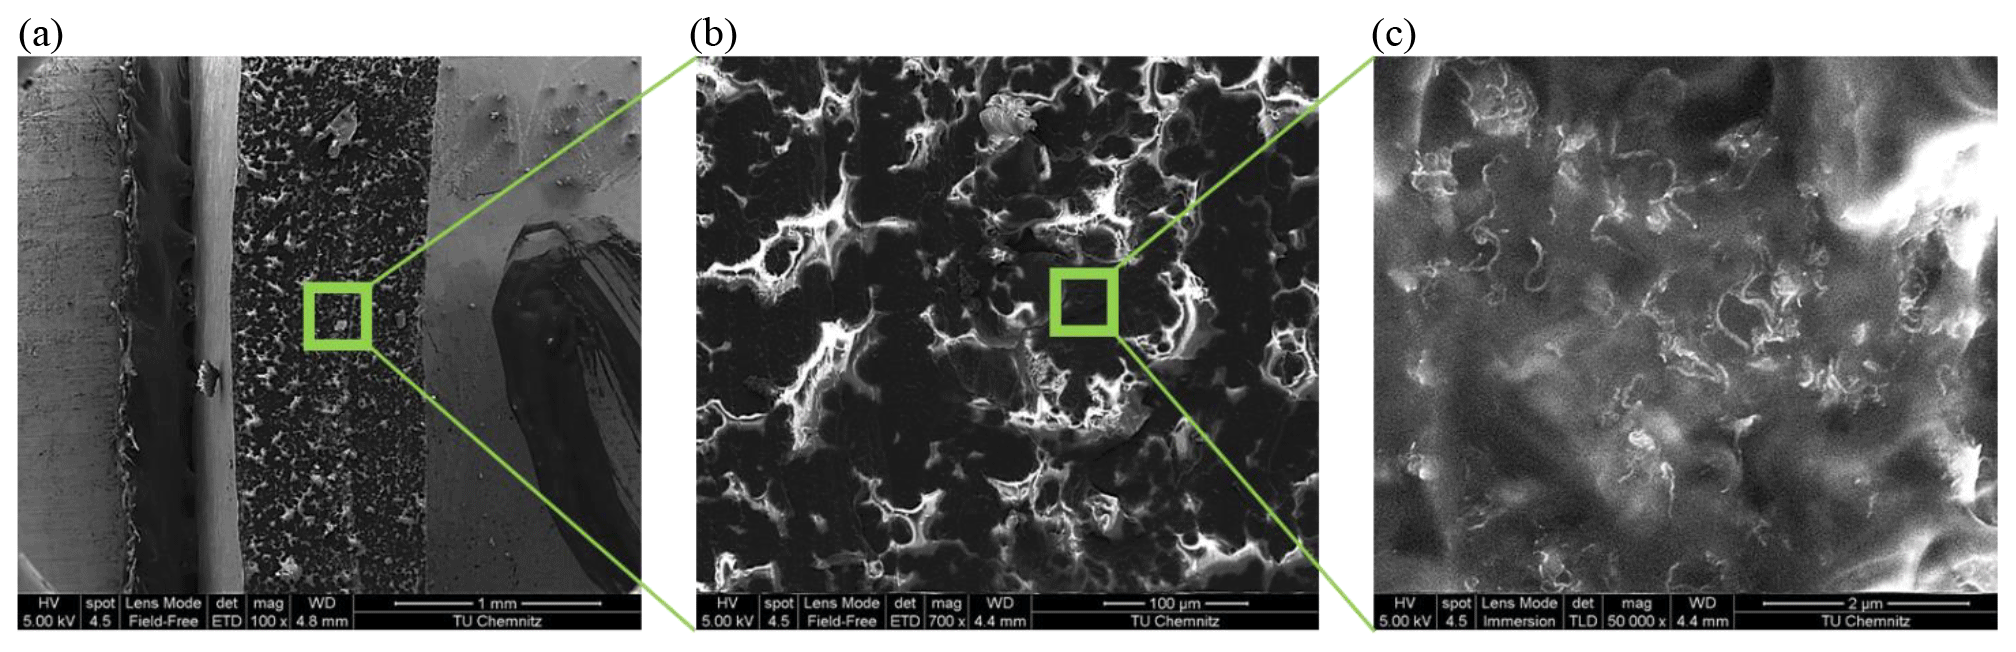
Figure 7SEM images at different magnification: (a) the cross-sectional view of the sample; (b) macroscopic view showing the region of polymer and CNTs; (c) immersion view showing the homogeneity of CNT distribution in the polymer.
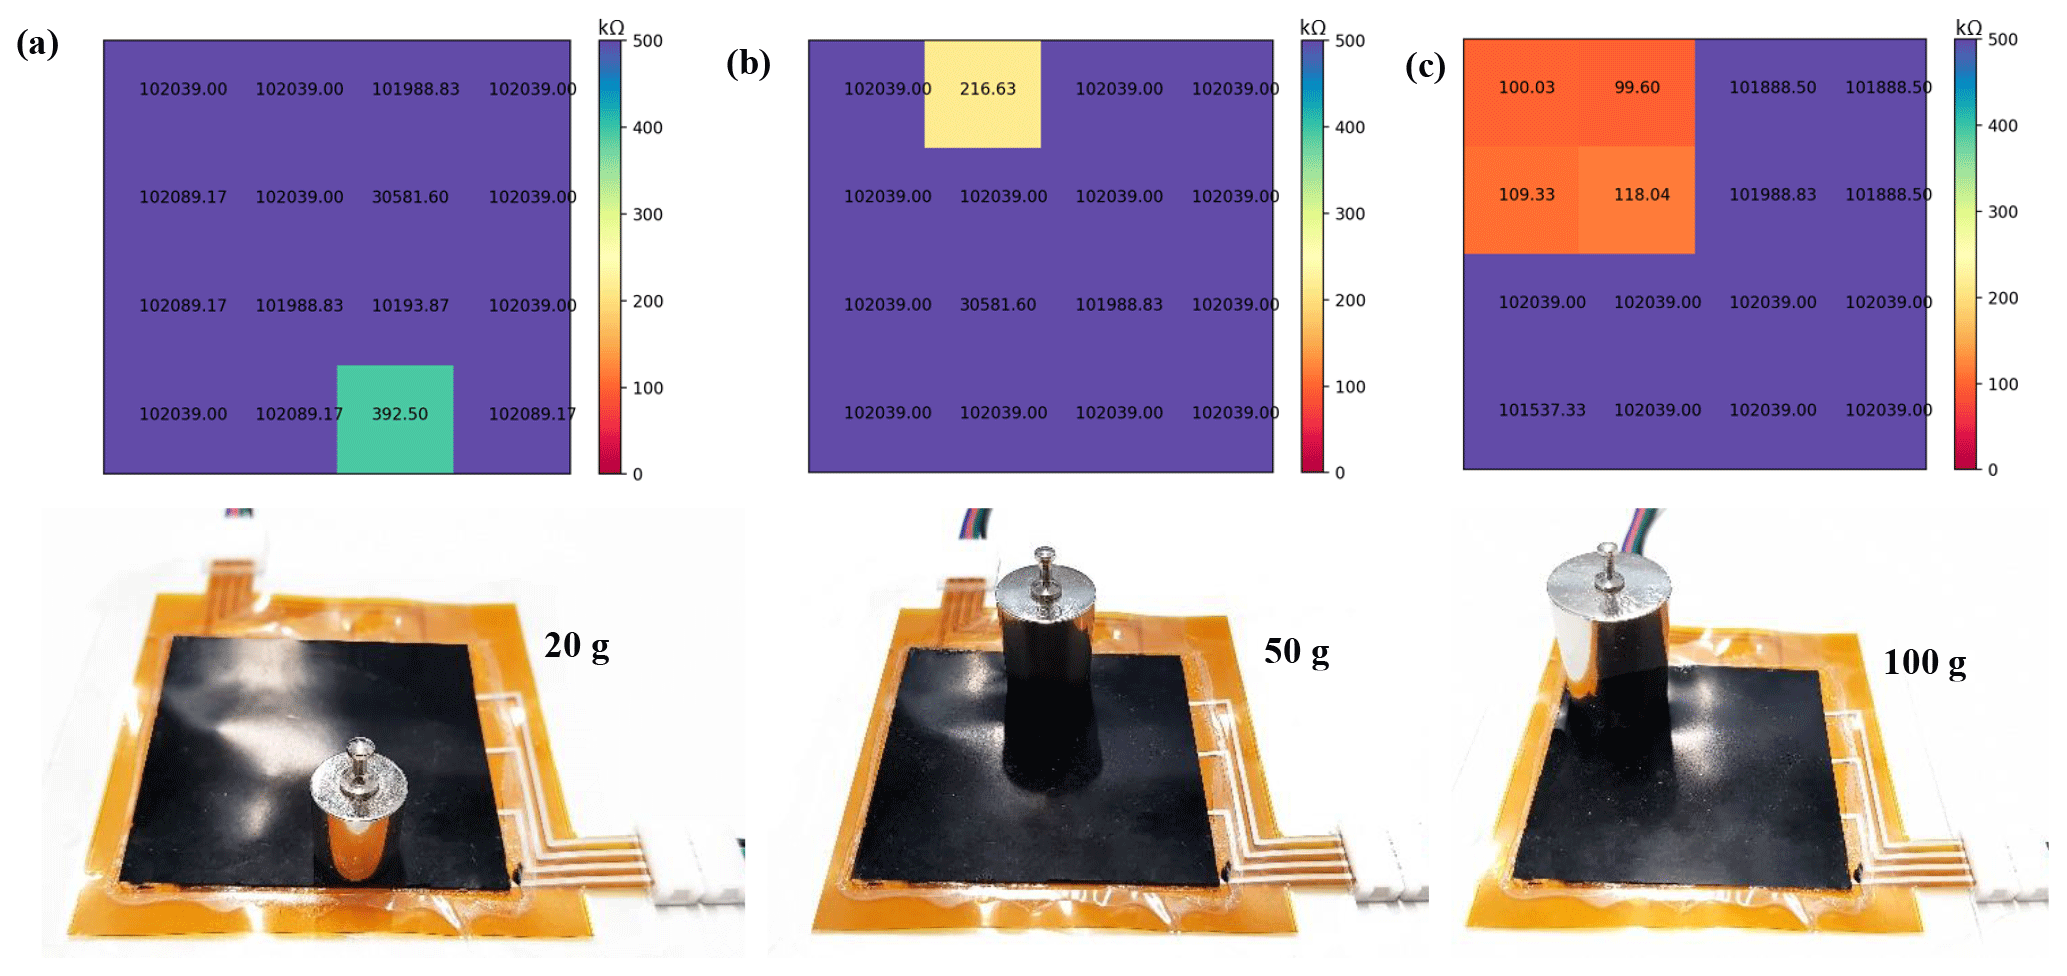
Figure 8Pressure distribution measurement of different slotted weight measured with a 4×4 sensor matrix: (a) 20 g, (b) 50 g, (c) 100 g.
Each sensor in the matrix is subjected to a loading–unloading test with a maximum load of 50 N (640 kPa) at a rate of 0.1 N s−1. Figure 4a shows the piezoresistive response of a single sensor within the matrix in the applied load range of 45 to 640 kPa and corresponding resistance range of 15 kΩ to 610Ω. This range is considered the nominal operating range of the sensor. The inner graph in Fig. 4a represents the complete range of resistance change from ∼400 kΩ to 610Ω between 0 and 640 kPa. Even though the sensor response appears to be saturating after 10 N it is evident from Fig. 4b that the response still decreases with increased load but with a reduced sensitivity.
The sensitivity of the sensor can be divided into segments depending on the different load regions of the sensor, as shown in Fig. 4c. In the loading cycle, the sensitivity varies from 4.3 kΩ kPa−1 to 3.5Ω kPa−1 and in the unloading cycle, it varies from 1.2Ω kPa−1 to 7.8 kΩ kPa−1. The different region of sensitivities is a factor of material compressibility and concentration of nanofillers in the polymer matrix. PDMS is a viscoelastic polymer as its glass transition temperature is less than the room temperature and hence the compressibility of the polymer composite material gradually decreases under applied pressure. With any applied pressure, the polymer composite material gets compressed faster, exhibiting higher sensitivity until it reaches a threshold, beyond which the compressive force increases, leading to a decreased sensitivity.
The viscoelasticity of PDMS causes instability in the compression state of the polymer composite material under applied pressure. This effect is also referred to as the relaxation behaviour of the polymer. Hence the sensor exhibits different loading and unloading response curves and there exists a hysteresis, as shown in Fig. 4d. Hysteresis reduces with increasing applied pressure, from over 60 % at 100 kPa to 0.8 % at 640 kPa, and at 50 % of the maximum applied pressure the hysteresis is 21.4 %.
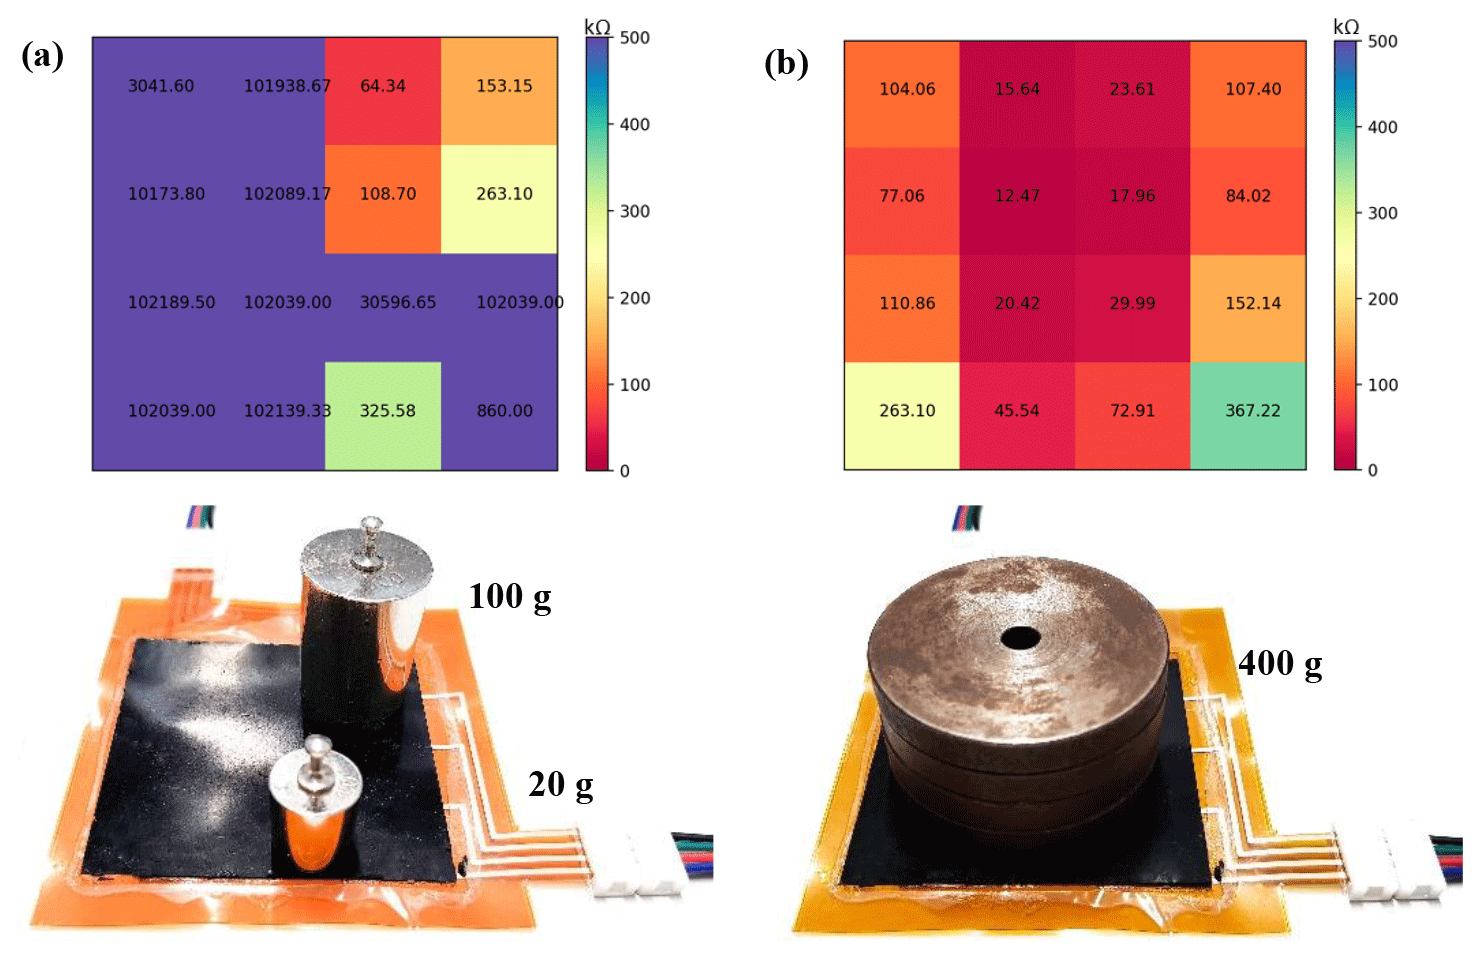
Figure 9Pressure distribution measurements of different weights and positions of test loads measured with a 4×4 sensor matrix.
Cyclic loading–unloading test was performed to test for the repeatability of the sensor response over continuous pressure cycles. The sensor was subjected to 20 continuous pressure cycles at a rate of 2 N s−1 to a maximum load of 50 N (640 kPa). The complete cyclic test response is shown in Fig. 5. Within the polymer composite dispersion, the nanofillers are randomly distributed in the polymer matrix and exhibit a higher tendency to re-agglomerate. Upon curing, the polymer conceals the nanofillers, preventing further re-agglomeration, and when this composite is subjected to repeated pressure cycles there exists a stress relaxation behaviour providing better stability in the polymer matrix. Such a mechanical training of the composite enables the sensor to exhibit better stability, improved repeatability and reduced hysteresis. After 20 cycles the overall response of the sensor has shifted down, which indicates a decrease in the hysteresis (see Fig. 6a). For better evaluation of this phenomenon, the sensor must be subjected to more cycles, for example several thousand cycles, to get a better understanding of the repeatability, hysteresis and long-term durability of the sensor.
The stability of the sensor can be determined both under cyclic pressure conditions and under static pressure conditions. The inner graph in Fig. 6b shows the stability of the sensor at a constant applied load of 25 N (320 kPa) over a duration of 28 h. The sensor response gradually decreases at a rate of 122Ω h−1 from 1.95 to 1.34 kΩ in 5 h, and the decrease in resistance continues at a rate of 15.6Ω h−1 from 1.35 to 1.194 kΩ in 15 h; later the change is negligible, which is also shown in Fig. 6b.
In polymer-composite-based sensors, reproducibility is challenging as it is governed by the distribution of nanofillers in the polymer matrix. Homogeneous distribution of nanofillers can ensure similar responses across multiple samples of the fabricated sensor. Homogeneous distribution can be achieved by completely de-bundling the MWCNTs and preventing further re-agglomeration. By our optimized material synthesis process the MWCNTs are effectively de-bundled followed by a fast curing process resulting in significantly fewer agglomerates and better homogeneous distribution. Scanning electrode microscope (SEM) images on the cross section of the sample can be used to determine the homogeneous distribution of MWCNTs in the polymer matrix at different levels of magnification.
Figure 7a and b show the cross-sectional view of the sample and a magnified image at the centre of the cross section using the field-emission mode of the microscope. The dark regions correspond to the conductive part of the material, comprising dominantly MWCNT-MWCNT networks and MWCNT-PDMS networks, and the bright regions correspond to the insulating part comprising mainly the polymer, hence leading to a charging effect while imaging. Figure 7c shows an SEM image scanned using immersion mode in the dark region of the sample, where the randomly well-distributed MWCNTs in the polymer matrix are clearly visible. The images clearly show the homogenous distribution of MWCNTs in the polymer matrix.
The measured pressure data have been used to design and fine-tune the circuit parameters of the data acquisition system. The interface was designed to visualize the complete range of the sensor response from 500 kΩ and displays the actual resistance values of the sensor under a load both numerically and as colour codes for better visualization. The pressure distribution on the sensor matrix was tested with slotted weights of 20, 50 and 100 g as shown in Fig. 8, with 20 g begin the minimum weight the system can detect. The calculated resistances are in the range of 390 kΩ for 20 g (∼2.5 kPa) to 108 kΩ for 100 g (∼12.7 kPa).
To evaluate the pressure distribution of the matrix, different slotted weights were placed in different positions, as shown in Fig. 9a. It can be observed that the system can detect different loads within the matrix without any cross-talking effect. Four disc weights of 100 g each were positioned at the centre and close to the top of the sensor matrix and the corresponding pressure distribution can be seen in Fig. 9b. This pressure corresponds to ∼45 kPa and the measured resistance is roughly around 20 kΩ, which is observed at the centre where the weight concentration is higher. As the weights were positioned more to the top, the bottom row has significantly higher resistance compared to other segments.
A thin, flexible, piezoresistive sensor matrix based on a MWCNT-PDMS composite was synthesized by an optimized fabrication process and simple mold casting technique. The electrode layout has been screen printed with silver ink on temperature-stable and mechanically stable polyimide thin film to enable a thin and homogenous layer. The composite is self-adhering to the electrode substrate, providing effortless sensor matrix production. The pressure measuring system can detect loads from 2.5 to 640 kPa with a maximum sensitivity of 4.3 kΩ kPa−1 under 45 kPa of applied pressure. With higher pressure like 640 kPa, the sensor exhibits a much lower hysteresis value of 0.8 %. At a constant pressure, the sensor drifts at a rate of 122Ω h−1 before it stabilizes at 15.6Ω h−1. With a data acquisition system based on Python and Arduino, a dynamic pressure measurement and visualization is possible. Both the position and the pressure of the applied load can be recorded and visualized as a resistance change, numerically and graphically. The pressure measurement system bears great potential in human health monitoring applications like long-term patient monitoring mattresses or insoles for gait monitoring.
The underlying measurement data are not publicly available and can be requested from the authors if required.
RR, as the main author, synthesized the nanocomposite, developed the pressure sensitive mat, designed the electrode matrix layout, performed the necessary experiments on the pressure sensors and drafted the paper. ZH participated in building the data acquisition system, GUI and in performing experiments. CG provided the fundamental concept of pressure sensor matrix. DR participated in performing experiments on the pressure sensor mat. TZ participated in printing the electrode matrix layout. RB and OK discussed the experimental results and contributed to the paper.
The authors declare that they have no conflict of interest.
This article is part of the special issue “Sensor/IRS2 2017”. It is a result of the AMA Conferences, Nuremberg, Germany, 30 May–1 June 2017.
The research work is carried out under “Landesinnovationsstipendium
(100284169)” and “project SenseCare (100270070)”, funded by the
Sächsische Aufbaubank (SAB) and the European Social Fund
(ESF).
Edited by: Andreas Nocke
Reviewed by: three anonymous referees
Abdul Razak, A., Zayegh, A., Begg, R., and Wahab, Y.: Foot Plantar Pressure Measurement System: A Review, Sensors, 12, 9884–9912, https://doi.org/10.3390/s120709884, 2012.
Amjadi, M., Kyung, K., Park, I., and Sitti, M.: Stretchable, Skin-Mountable, and Wearable Strain Sensors and Their Potential Applications: A Review, Adv. Funct. Mater., 26, 1678–1698, https://doi.org/10.1002/adfm.201504755, 2016.
Costa, T. and Choi, J.: A flexible two-dimensional force sensor using PDMS nanocomposite, Micro. Eng., 174, 64–69, https://doi.org/10.1016/j.mee.2017.02.001, 2017.
D'Alessio T.: Measurement errors in the scanning of piezoresistive sensors arrays, Sensor. Actuat. A-Phys., 72, 71–76, https://doi.org/10.1016/S0924-4247(98)00204-0, 1999.
Gerlach, C., Krumm, D., Illing, M., Lange, J., Kanoun, O., Odenwald, S., and Hübler, A.: Printed MWCNT-PDMS-Composite Pressure Sensor System for Plantar Pressure Monitoring in Ulcer Prevention, IEEE Sens. J., 15.7, 3647–3656, https://doi.org/10.1109/JSEN.2015.2392084, 2015.
Gurney, J., Kersting, U. G., and Rosenbaum, D.: Between-day reliability of repeated plantar pressure distribution measurements in a normal population, Gait Posture, 27.4, 706–709, https://doi.org/10.1016/j.gaitpost.2007.07.002, 2008.
Hu, Z., Rajendran, D., Wendler, F., Ramalingame, R., and Kanoun, O.: Evaluation of the Cross Talking Effect in Piezoresistive Tactile Sensor Matrices, 1 5th International Multi-Conference on Systems, Signals & Devices (SSD), Yassmine Hammamet, Tunisia, 632–635, https://doi.org/10.1109/SSD.2018.8570666, 2018.
Kappassov, Z., Corrales, J.-A., and Perdereau, V.: Tactile sensing in dexterous robot hands – Review, Robot. Auton. Syst., 74, 195–220, https://doi.org/10.1016/j.robot.2015.07.015, 2015.
Lauterbach, C., Steinhage, A., and Techmer, A.: Large-area wireless sensor system based on smart textiles, 9th International Multi-Conference on Systems, Signals and Devices, Chemnitz, https://doi.org/10.1109/SSD.2012.6198101, 2012.
Mihai, A., Simonin, O., and Charpillet, F.: Localization of Humans, Objects, and Robots Interacting on Load-Sensing Floors, IEEE Sens. J., 16.4, 1026–1037, https://doi.org/10.1109/JSEN.2015.2493122, 2016.
Ramalingame, R., Hu, Z., Gerlach, C., and Kanoun, O.: Shoe insole with MWCNT-PDMS-composite sensors for pressure monitoring, 2017 IEEE SENSORS, Glasgow, 1–3, https://doi.org/10.1109/ICSENS.2017.8233874, 2017a.
Ramalingame, R., Chandraker, P., and Kanoun, O.: Investigation of the influence of solvents in MWCNT-PDMS nanocomposite pressure sensitive films, Eurosensors 2017 Conference, Paris, France, 3–6 September, Proceedings, MDPI AG., 384, https://doi.org/10.3390/proceedings1040384, 2017b.
So, H.-M., Sim, J. W., Kwon, J., Yun, J., Baik, S., and Chang, W. S.: Carbon nanotube-based pressure sensor for flexible electronics, Mater. Res. Bull., 48, 5036–5039, https://doi.org/10.1016/j.materresbull.2013.07.022, 2013.
Someya, T., Kato, Y., Sekitani, T., Iba, D., Noguchi, Y., Murase, Y., Kawaguchi, H., and Sakurai, T.: Conformable, flexible, large-area networks of pressure and thermal sensors with organic transistor active matrixes, P. Natl. Acad. Sci. USA, 102.35, 12321–12325, https://doi.org/10.1073/pnas.0502392102, 2005.
Wu, J., Wang, L., Li, J., and Song, A.: A novel crosstalk suppression method of the 2-D networked resistive sensor array, Sensors, 14, 12816–12827, https://doi.org/10.3390/s140712816, 2014.
Yogeswaran, N., Tinku, S., Khan, S., Lorenzelli, L., Vinciguerra, V., and Dahiya, R.: Stretchable resistive pressure sensor based on CNT-PDMS nanocomposites, in 2015 11th Conference on PhD Research in Microelectronics and Electronics (PRIME), 326–329, https://doi.org/10.1109/PRIME.2015.7251401, 2015.