the Creative Commons Attribution 4.0 License.
the Creative Commons Attribution 4.0 License.
 | 06 Dec 2018
Highly sensitive coulometric titration of oxygen for the characterization of solid materials at elevated temperatures
Alexander Herms
Jingying Yao
Jens Zosel
Vladimir Vashook
Wolfram Oelßner
Michael Mertig
A new setup for characterization of solid material oxygen exchange and conductivity in a broad oxygen partial pressure range and at elevated temperatures is presented. The development target of this setup is directed towards the detection of ultra-low amounts of exchanged oxygen. For this, electrochemical cells made of yttria-stabilized zirconia (YSZ) were optimized and applied in a flow-through arrangement. The design and process measures enable a lower limit of detection below 100 pmol of exchanged oxygen. Furthermore, the system characteristics concerning oxygen dispersion, titration efficiency and electrode kinetics are described.


Oxygen solid electrolyte coulometry (OSEC) performed with electrochemical cells made of yttria-stabilized zirconia is a long-standing method used for gas sensing, material characterization as well as biological or medical measurements of oxygen exchange (Fouletier et al., 1975; Teske et al., 1986; Uhlmann et al., 1999; Sahibzada et al., 2000; Vashook et al., 2012; Stöber et al., 2018). The method is based on the measurement of charges or currents for batch-like or flow-through titration of oxygen by solid electrolyte cells based on Faraday's law. A typical operation temperature of such cells is 750 ∘C. If the coulometric devices are equipped with measuring electrodes which support oxidation reactions in the gas phase by their high catalytic activity, the method can also be applied for Faradaic titration of oxidizable gases like hydrogen, carbon monoxide or hydrocarbons (Schelter et al., 2014). In this case, the oxygen gas concentration has to be constant at a much lower value than the combustible concentration to be measured. Up to now, most OSEC applications have been directed towards the measurement of gaseous quantities >100 nmol (batch coulometry) or concentrations >100 vol. ppm (flow-through coulometry). Applications in liquid coulometry show that this method can provide significantly lower limits of detection (LOD) down to the pmol range or ppb concentrations, respectively. Recent developments show that in the case of coulometric solid electrolyte sensors a significant decrease in LOD is possible if the titration-disturbing processes are known and compensable (Schelter et al., 2016). This paper is directed towards the question as to which extent the LOD of devices for oxygen exchange measurements could be diminished. For that, measures described by Schelter et al. (2013), such as compensation of electronic current, noise reduction and high-precision temperature control, were consequently applied. Moreover, new design and process optimizations were taken into account.
2.1 Setup for sensitive oxygen titration
The experimental setup used in this work consists of the parts illustrated in Fig. 1.
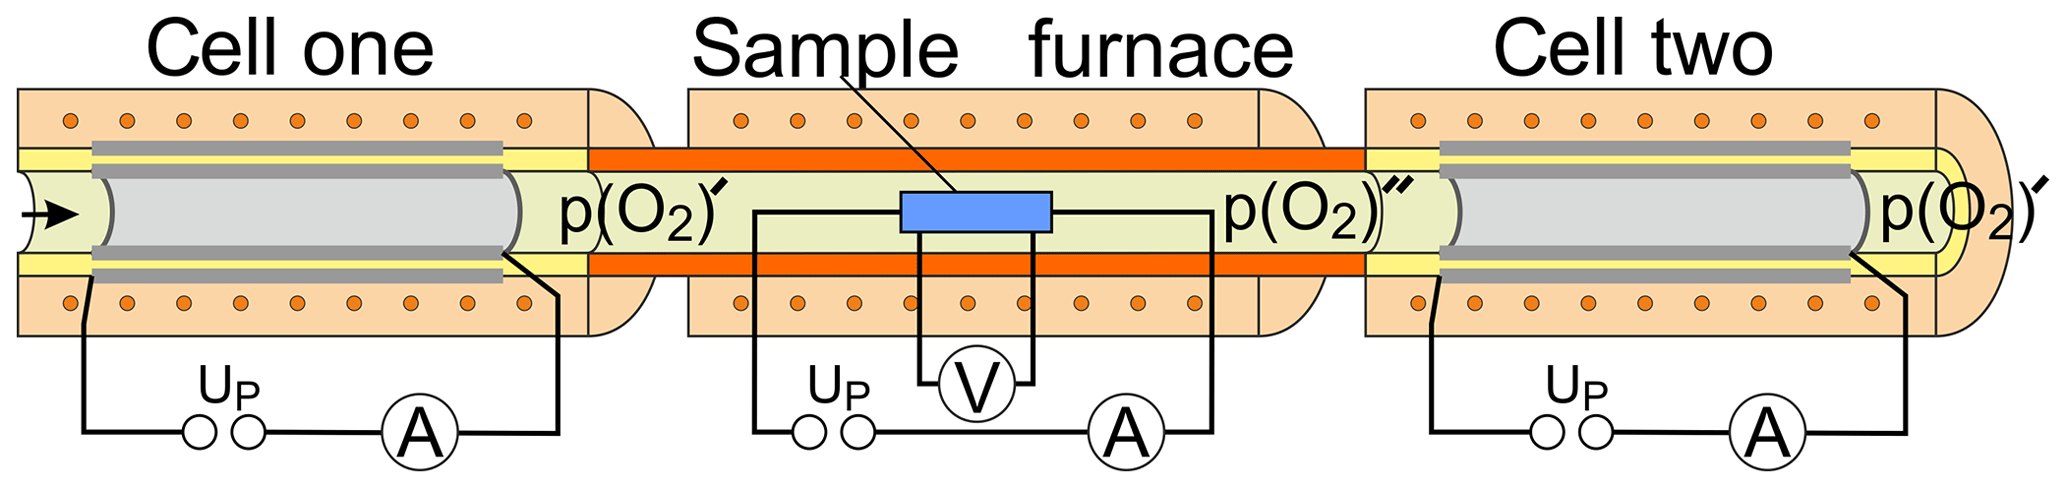
Figure 1Schematic representation of the titration setup consisting of an oxygen titration cell (cell one), a sample furnace with a holder for four-point measurements, followed by a second oxygen titration cell (cell two).
A gas mixing station (not shown) for adjusting the measuring gas flow and the incoming oxygen partial pressure p(O2) during the experiment is followed by a first oxygen titration cell (cell one) for the precise adjustment of the p(O2)′ in the gas atmosphere around the sample. The cell is connected to a tube furnace with a sample holder for four-point AC and DC conductivity measurements at elevated temperatures (300–800 ∘C). From the gas outlet of the furnace itself, the gas is guided to the inlet of the second titration cell (cell two) for measuring the oxygen or other gases exchanged with the sample. Both titration cells were purchased from Zirox Sensoren und Elektronik GmbH, Greifswald, Germany (O2-DF28.0). They are controlled by a homemade measuring circuit based on a commercial USB controller (KUSB-3108, Keithley Instruments, USA). To increase the tightness of the cell connections, the material of the connecting aluminum head was replaced by stainless steel. Two O-rings made of FPM 75 (Viton®) were used within a statically pressed O-ring seal for connecting the YSZ tube with the connecting head. All connections were made of stainless steel tubing, and the reaction chamber in the furnace consists of Al2O3. The tightening of the sample furnace, which is required to be established reproducibly after sample change, was made of vacuum connections. For oxygen exchange measurements on samples of interest both titration cells are operated by applying a fixed polarization potential versus the outer air reference electrodes of the cells.
This constant polarization is accompanied by high-resolution measurement of the electrolysis current. The used titration cells contain additional downstream Nernst cells (NC1 and NC2, not shown in Fig. 1) for the potentiometric monitoring of p(O2)′ after electrolysis. The Nernst cells were used to characterize the titration kinetics at the pumping electrodes. All measurements were carried out at a cell temperature of 750 ∘C. To avoid elevated oxygen exchange with the containing tube and the sample holder during the experiment, all these elements were made of Al2O3.
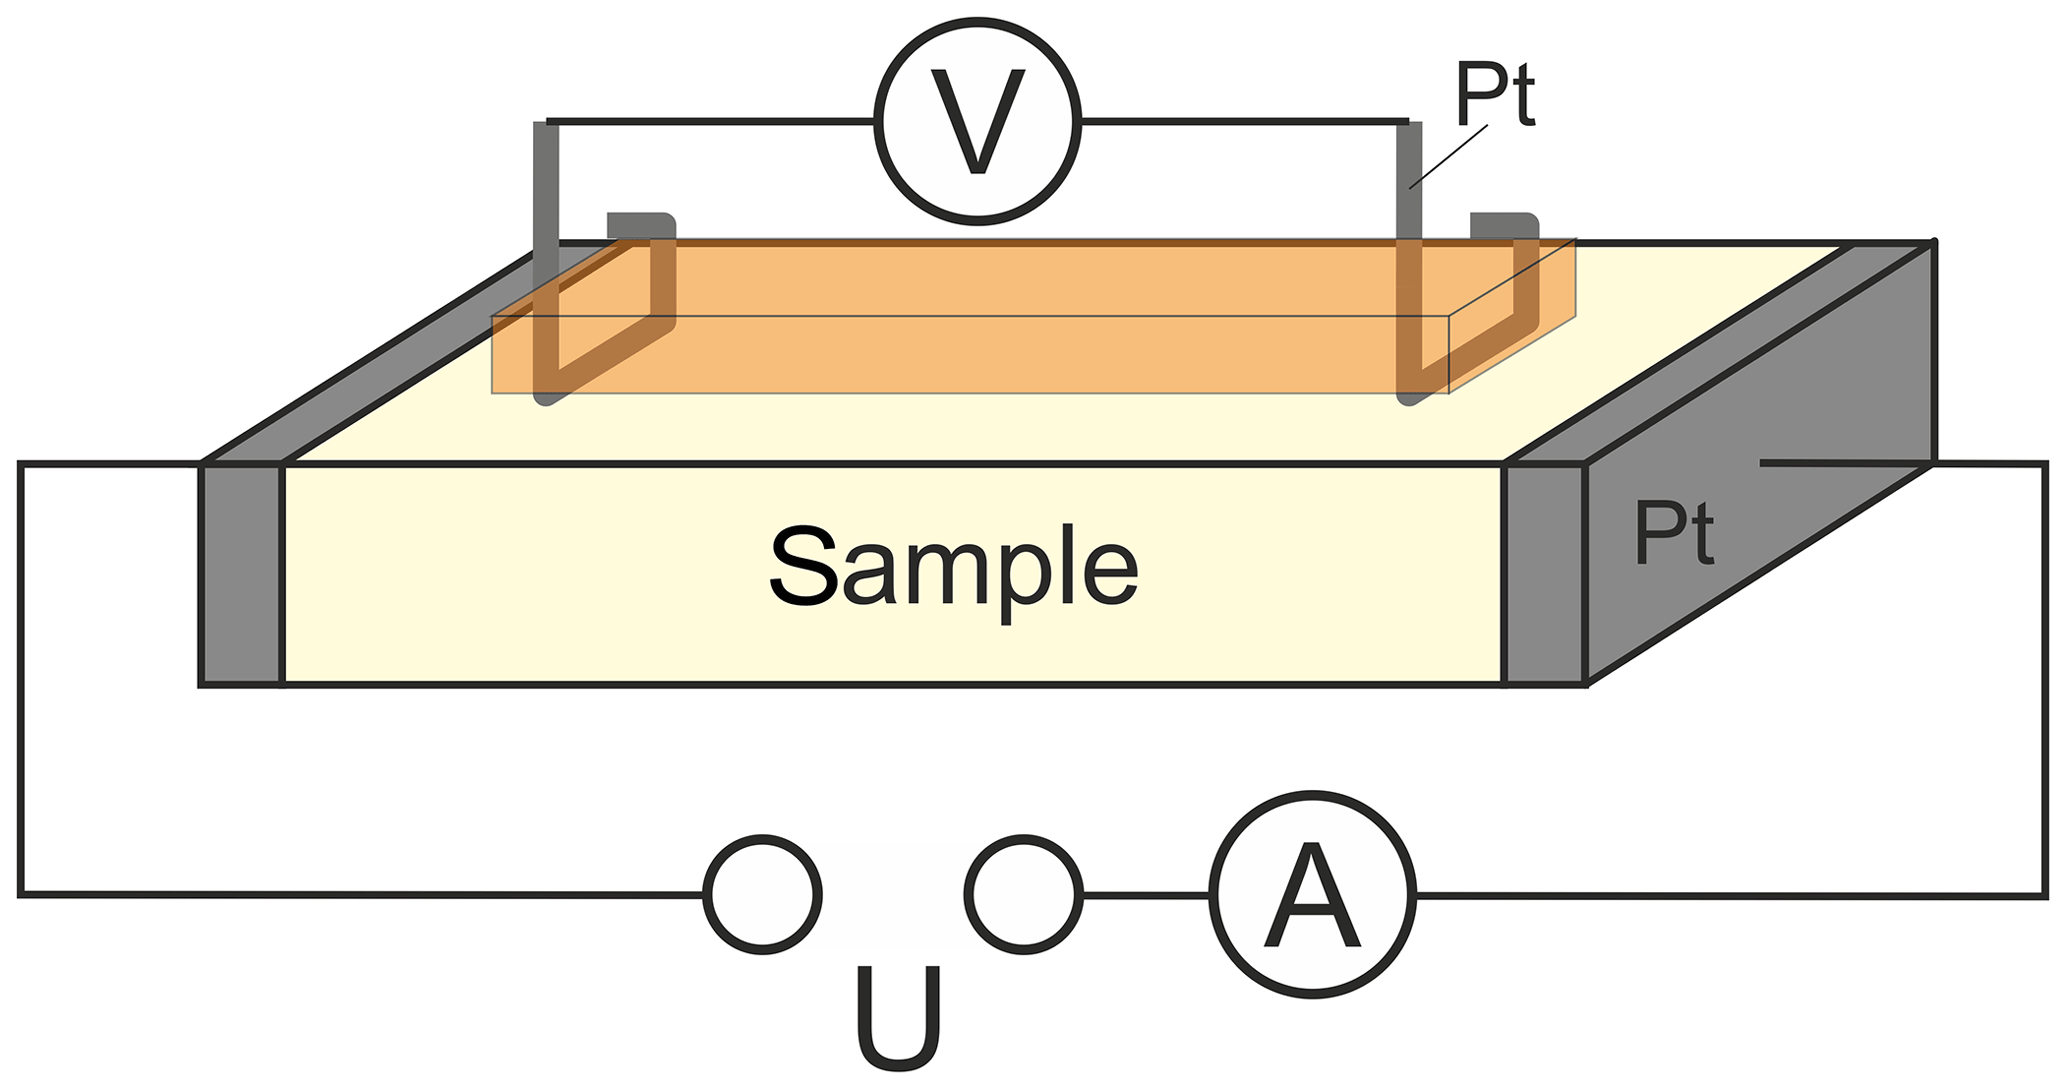
Figure 2Schematic representation of the four-point contacting of the sample for AC and DC conductivity measurements.
The electrical connection with the sample was established by pressed platinum contacts as schematically given in Fig. 2. These contacts are pressed onto the sample by two different high-temperature springs in a reversible manner to ensure rapid and reliable electrical connection for each sample to be investigated in the above-mentioned temperature range. The four-point contacting is provided for AC and DC conductivity measurements at samples to be investigated as the main focus of the setup. Those measurements are not presented in this paper, which is directed towards the characterization of important setup parameters. As described in detail in the next chapter, the characterization of the lower limit of detection was carried out by polarizing an YSZ sample using an Interface 1000 potentiostat (Gamry Instruments, Warminster, USA).
The control unit for the setup is described in detail by Schelter et al. (2013). It monitors the potentials of downstream NC1/2, sample temperature and titration current at cell two.
2.2 Experimental parameters
All measurements were conducted with N2 5.0 with p(O2)<0.1 Pa. For characterization of oxygen dispersion, titration efficiency and kinetics, flow rates of 50 and 100 mL min−1 were established, and galvanostatic pulses between 125 µA and 4 mA were applied at cell one with durations between 30 and 120 s. Before and after each pulse, cell one was held at open-circuit conditions. At cell two the pulses were coulometrically titrated at mV. The open circuit potential (OCP) of NC2 was measured to quantify the titration completeness of cell two.
To determine the oxygen partial pressure range, in which the coulometric oxygen titration can be applied, the polarizations of cell one UP,1 and of cell two UP,2 were varied stepwise between −280 and −200 mV, leading to oxygen partial pressures in the measuring gas p(O2)′ between 0.06 and 2.42 Pa. At each individual oxygen level, additional oxygen was pumped into the measuring gas by current pulses between 125 µA and 1 mA for 60 s and the oxygen was coulometrically titrated at cell two.
To demonstrate the lower limit of detection for exchanged oxygen, a sample of 8 mol-% YSZ with the dimensions of was prepared and positioned in the sample holder. This sample was pulse-polarized at different potentials in the range between 6.25 and 100 mV at 650 ∘C, while a constant polarization voltage mV was applied at cell one and the exchanged oxygen was coulometrically titrated at mV at cell two.
An example of the oxygen dispersion in the non-heated sample furnace and the titration efficiency of cell two is shown in Fig. 3.

Figure 3Plot of the current pulse in cell one (black) and the titration currents in cell two (blue, red). Furnace temperature 25 ∘C; cell temperatures 750 ∘C.
The black curve indicates a pulse of the pumping current applied at cell one, while the titration currents measured at the flow rates 50 and 100 mL min−1 are indicated in red and blue, respectively. The oxygen, pumped into the nitrogen gas flow, amounts to 154.2 nmol, while integration of the current peaks measured at cell two results in 151.4 nmol for 100 mL min−1 and 153.6 nmol for 50 mL min−1. The corresponding ratios of 98.1 % and 99.6 % of recovered oxygen in cell two prove the outstanding precision of the setup for oxygen exchange measurements. The residual oxygen in the gas flow through cell two at times outside the pulse is indicated by the baselines of the blue and red curves. The corresponding oxygen concentration is provided in Fig. 3 as well. Therefore, this residual oxygen is not included in the given amounts of oxygen calculated by peak integration. Doubling the flow rate results in a retention time shift of the peak maximum from 290 to 200 s and a peak maximum broadening, which is connected with a slight increase in peak height.
The results in Fig. 3 show that nearly 100 % of the oxygen introduced by pumping can be measured at cell two up to very large amounts of introduced oxygen.
The titration kinetics in cell two was characterized by measuring the amount of oxygen slipping through cell two at mV, which changes the OCP of NC2. Integrating the potential peak measured at NC2 results in the amount of slipped oxygen given in Fig. 4.
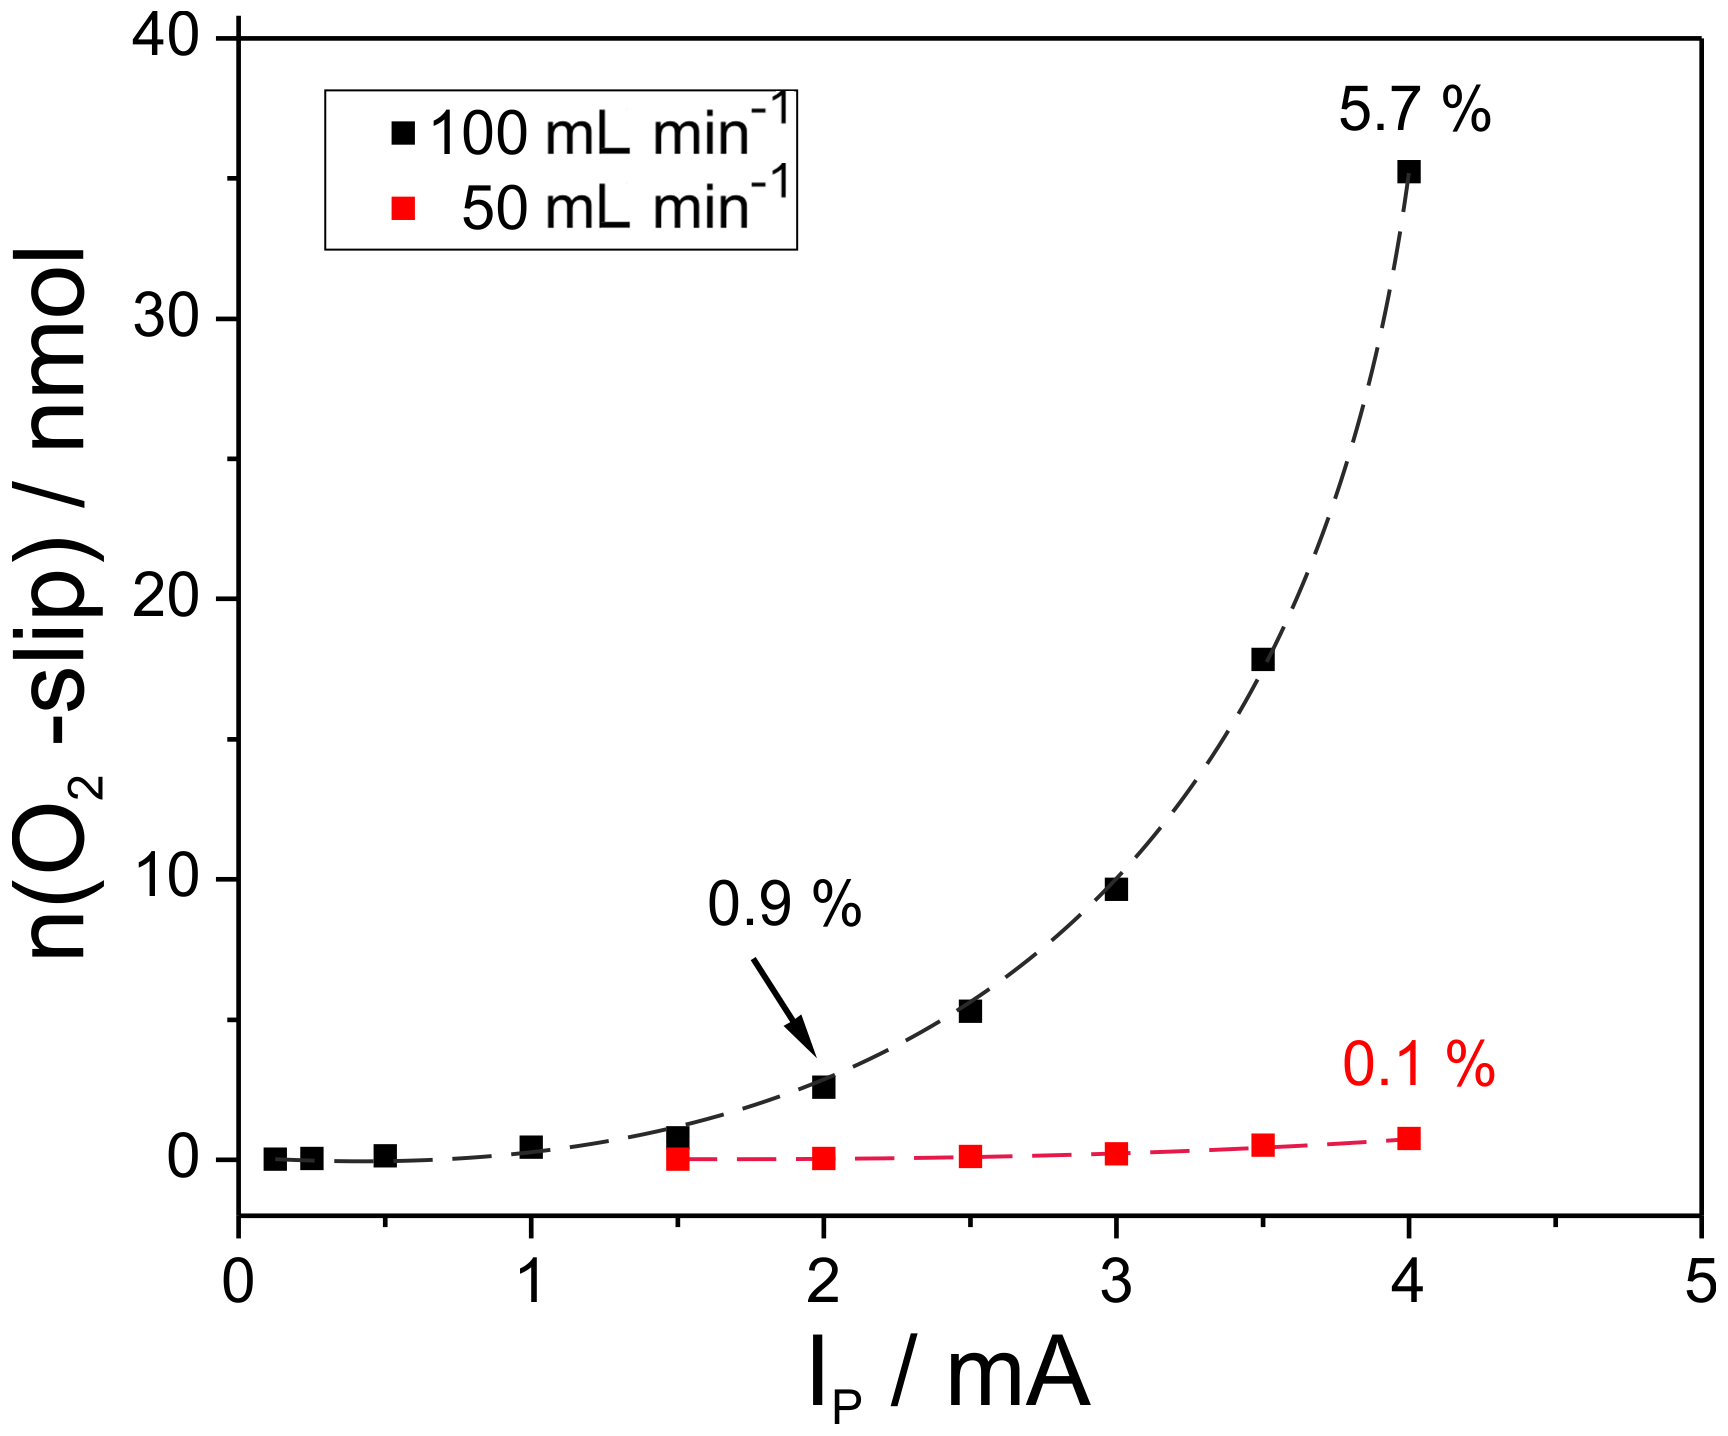
Figure 4Amount of oxygen, slipped through cell two during titration as a measure for the electrode kinetics, depending on the amount of introduced oxygen at different flow rates; cell temperatures 750 ∘C.
In addition, the fraction of slipped oxygen in relation to the total amount of pumped oxygen is displayed for three selected measuring points. As expected, the amount of slipping oxygen increases with the amount of introduced oxygen and with the flow rate. The largest oxygen pulse applied at 100 mL min−1 results in 35 nmol slipping oxygen, which equals 5.7 % of the initial pulse. In contrast to that, the slip amounts to max. 0.1 % at 50 mL min−1.
The results verify that relatively high amounts of oxygen can be titrated with appropriate precision if the flow rate does not considerably exceed 50 mL min−1.
The extent of slip-free coulometric titration at increasing basic oxygen partial pressure in the measuring gas is illustrated in Fig. 5 for pulses of 78 nmol O2 (500 µA for 60 s) at a flow rate of 50 mL min−1.
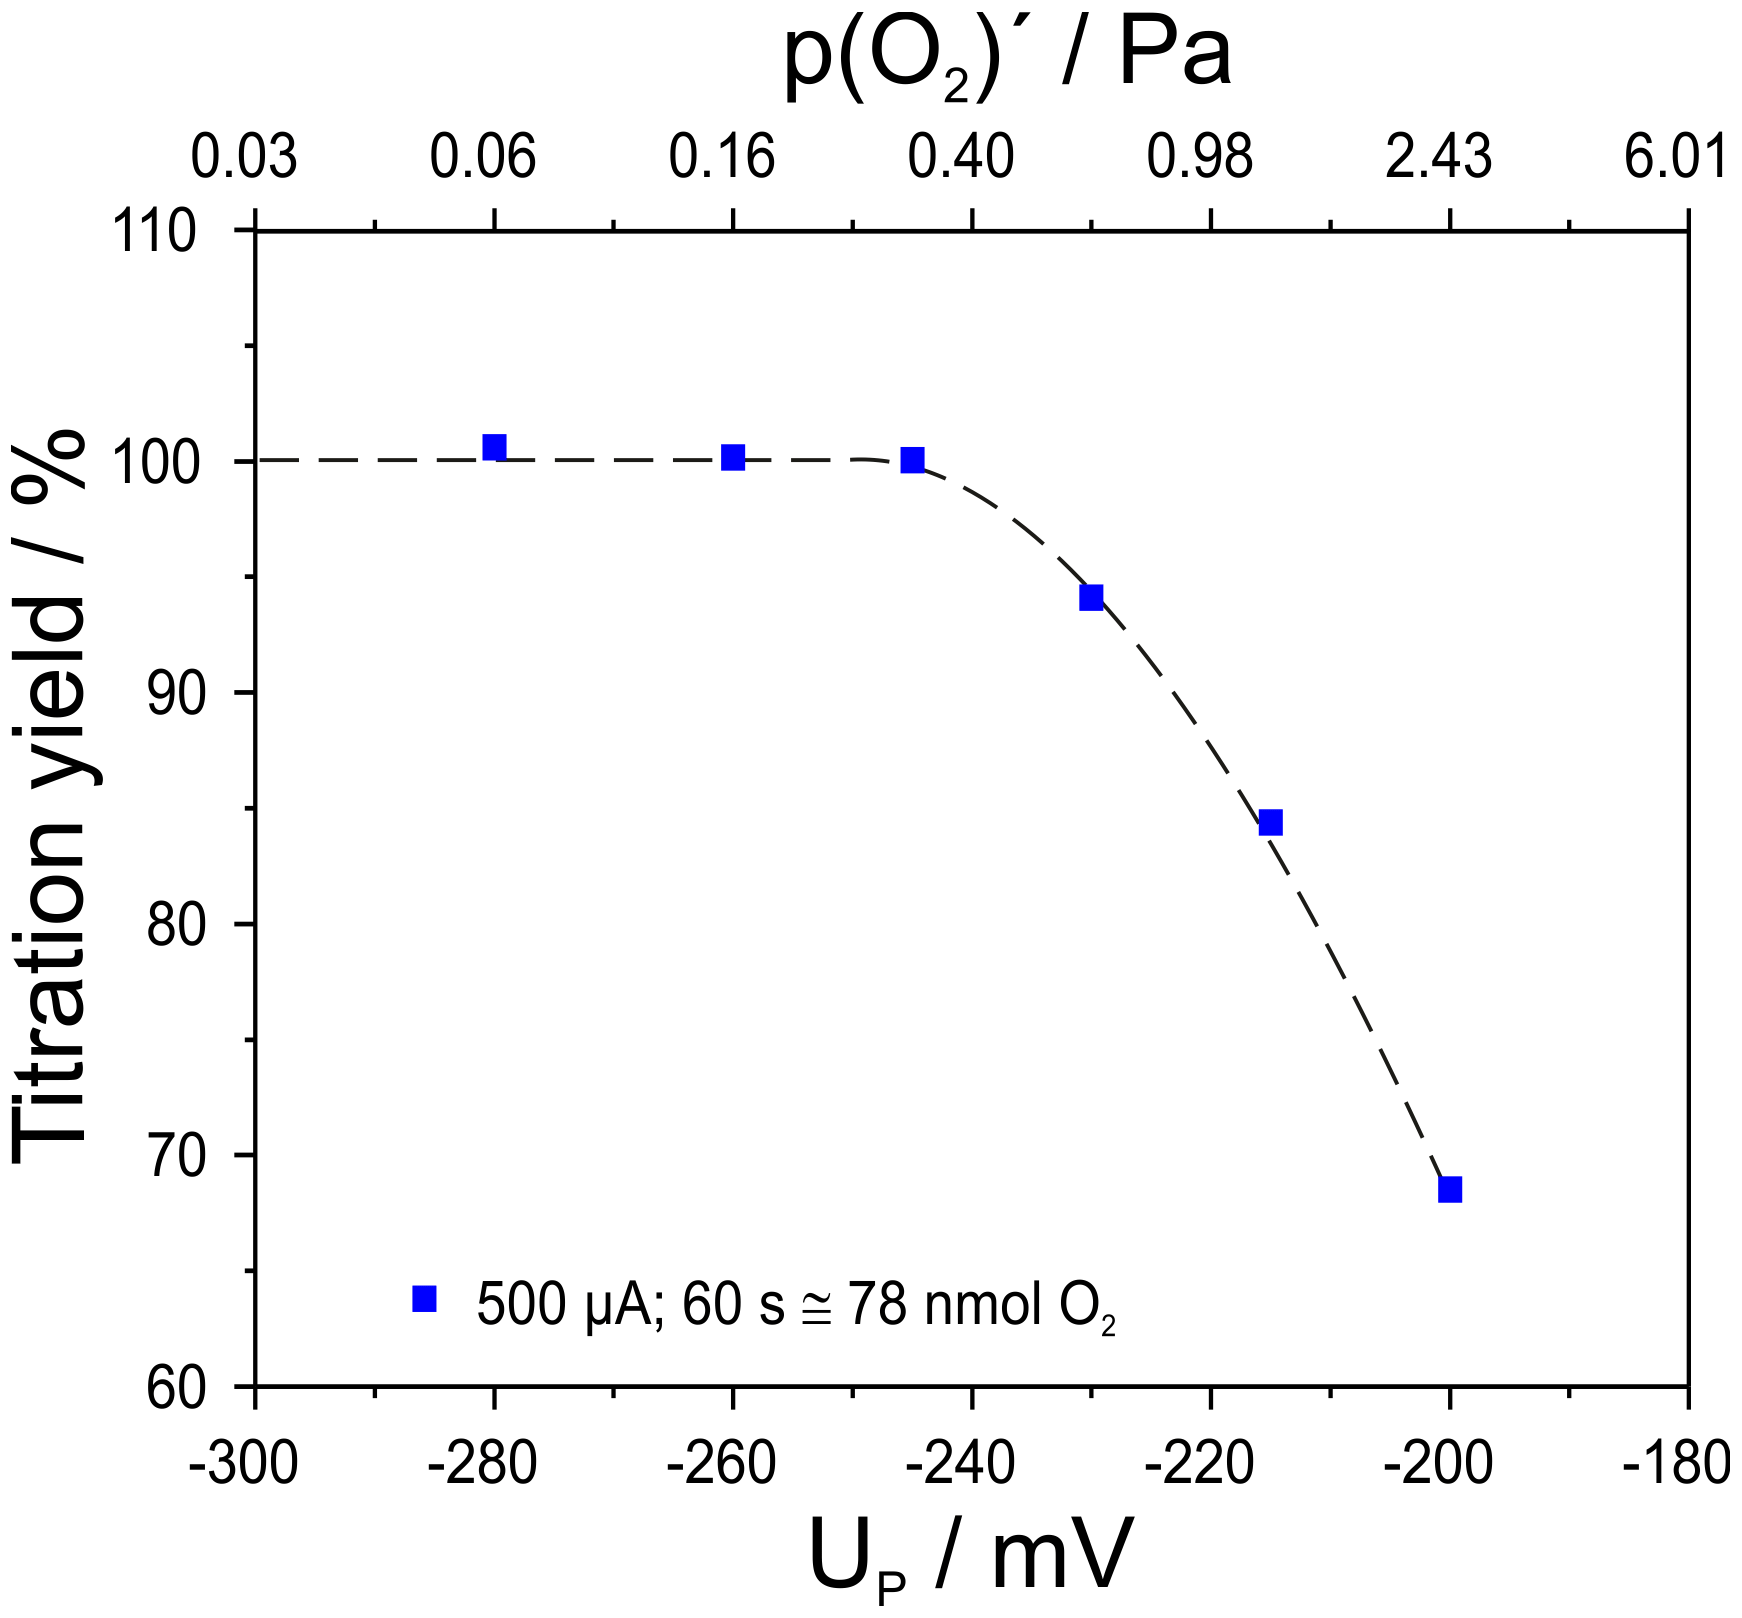
Figure 5Titration yield for an oxygen pulse of 500 µA for 60 s (78 nmol O2) depending on the adjusted basic oxygen partial pressure; flow rate 50 mL min−1; cell temperatures 750 ∘C.
The yield of the titration was found to be 100 % for the experiments conducted with a p(O2) at the furnace entrance (see Fig. 1) of Pa and mV. At higher p(O2)′ the yield decreases to 68 % for the titration at Pa and mV.
This result gives a first insight into the upper limit of detection of this setup for high-precision coulometry at higher oxygen partial pressure.
The experiments for characterizing the setup at small amounts of pumped oxygen were accomplished by pumping very small amounts of oxygen into the system at the sample position by using the YSZ sample described in Sect. 2.2. While adjusting p(O2)′ to 25 mPa at the sample, it was potentiometrically pulsed, which results in oxygen release at the anode and oxygen uptake at the cathode.
During the pulse the amount of oxygen uptake is much smaller than that of oxygen release since the surrounding gas atmosphere contains nearly no oxygen. Therefore, the sample releases net oxygen during the pulse and takes it up again after pulse end. The released oxygen then flows downstream and can be detected in cell two. This measurement can also be used as a highly sensitive calibration method for this kind of OSEC setup.
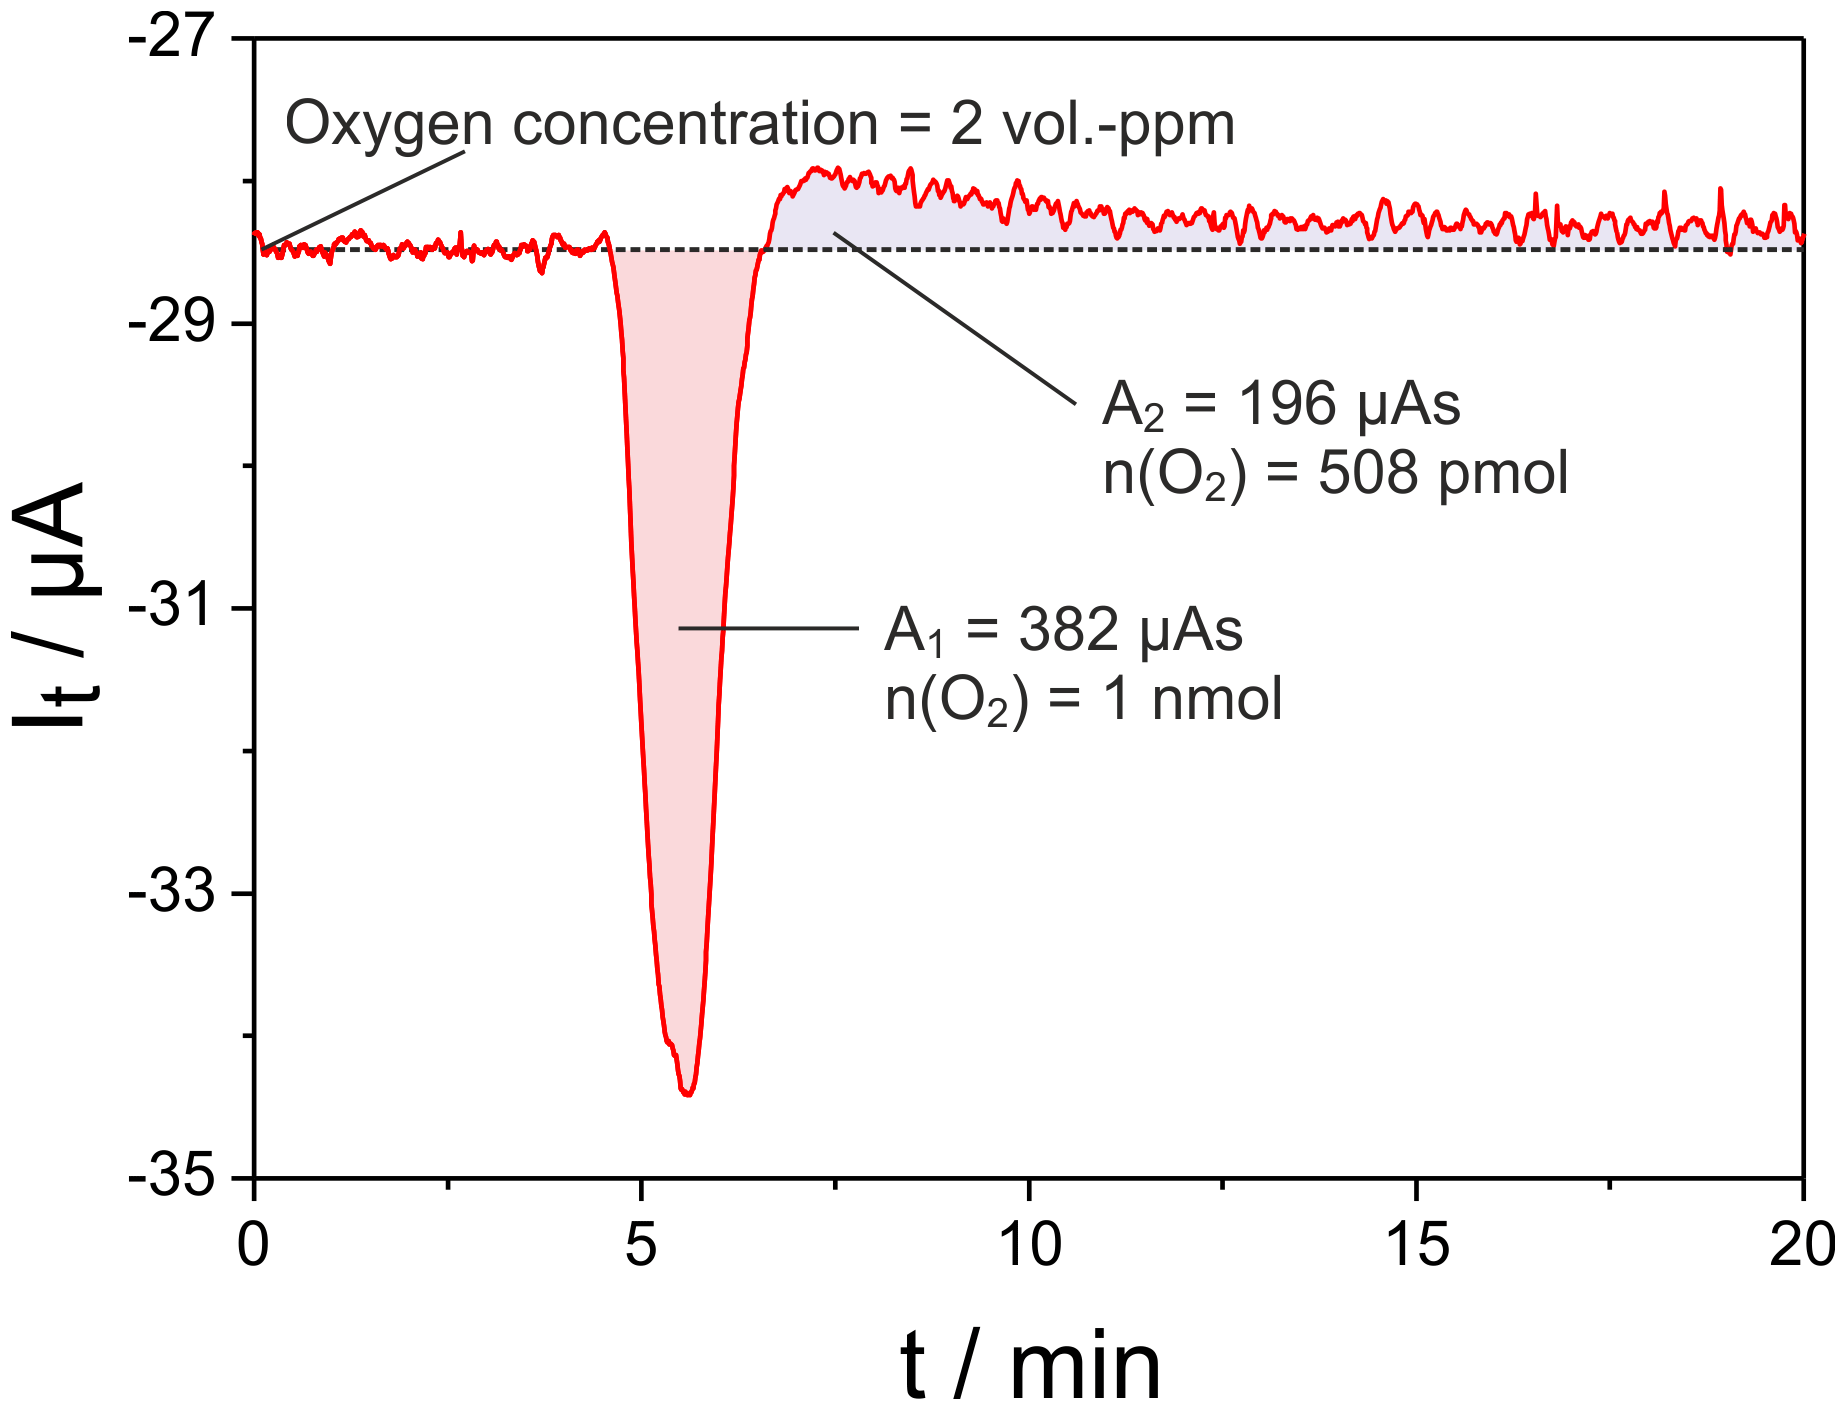
Figure 6Oxygen titration peak measured with cell two of the setup given in Fig. 1 at mV; sample: 8 mol-% YSZ; sample temperature 650 ∘C; sample polarization 25 mV for 60 s; flow rate 50 mL min−1.
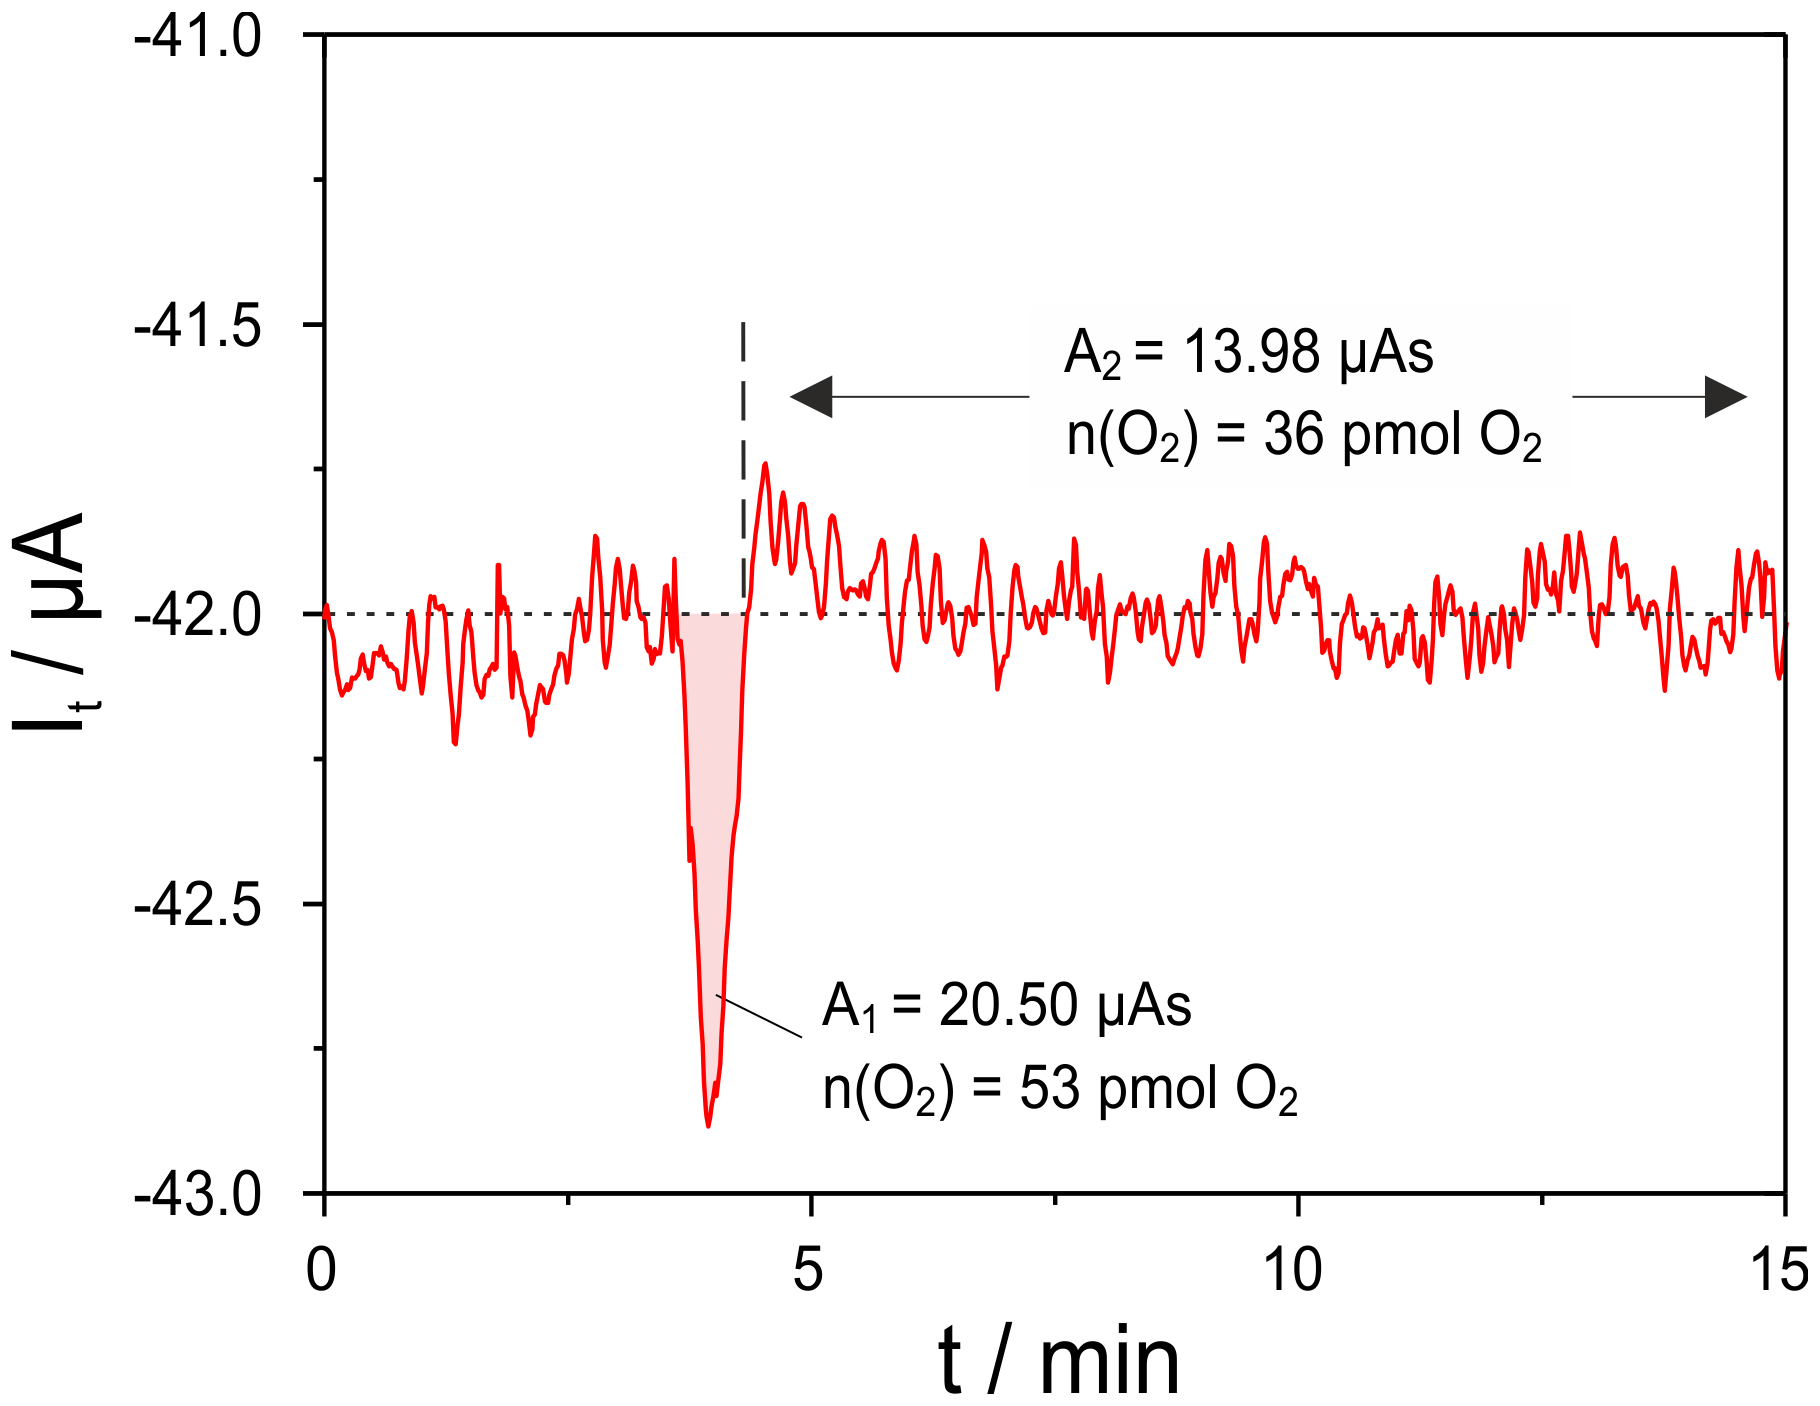
Figure 7Oxygen titration peak measured with cell two of the setup given in Fig. 1 at mV; sample: 8 mol-% YSZ; sample temperature 650 ∘C; sample polarization 25 mV for 10 s; flow rate 50 mL min−1.
In Fig. 6 an example of the resulting titration current pulse at cell two is shown. Here a pulse of UP=25 mV was applied for 60 s across the sample, resulting in a charge transfer of 539 µAs at the sample. The net released oxygen amounts to 1 nmol, while the oxygen uptake after pulse end is roughly 380 µAs during the observation over 20 min. The oxygen uptake is significantly slower than its release since it proceeds at OCP conditions in nitrogen.
To characterize the lower limit of detection of this setup, the polarization time of the sample was stepwise decreased. In Fig. 7 the titration current is plotted for a polarization of 25 mV for 10 s. This caused a charge transfer of 80 µAs at the sample. The net released oxygen amounts in this case to 53 pmol, while the uptake is hardly detectable and amounts to around 36 pmol over 10 min.
These results demonstrate the capabilities of this setup to detect ultra-small amounts of oxygen down to values around 100 pmol, which are exchanged between the sample and the measuring gas.
The key parameters upper and lower limits of detection and titration kinetics of a setup for oxygen exchange measurements at solid materials were investigated. The setup was tested at temperatures between room temperature and 650 ∘C, at flow rates of 50 and 100 mL min−1 and incoming oxygen partial pressures ranging between and 2.4 Pa.
The results prove that the newly developed arrangement with its highly improved overall tightness enables the precise measurement of exchanged oxygen or oxidizable gases from the picomol up to the higher nanomol range. During the pulse-like oxygen introduction experiments considerable deviations of the titrated oxygen from the total oxygen to be measured were found at pulse currents above 2 mA for the flow rate 100 mL min−1 at incoming mPa. An increase in this incoming p(O2)′ results in considerable deviations above values of 0.4 Pa. Comparison to the state of the art proves that the optimized setup enables oxygen exchange measurements with a precision which was not achieved so far.
The underlying measurement data are not publicly available and can be requested from the authors if required.
AH, as the main author, planned and manufactured important parts of the setup, planned and performed the experiments, carried out the data evaluation and drafted the manuscript. JY participated in building the setup and in performing experiments. JZ designed the experimental setup and supervised the experiments. VV provided fundamental ideas for the experimental setup. WO and MM discussed the experimental results and contributed to the manuscript.
The authors declare that they have no conflict of interest.
This article is part of the special issue “Sensors and Measurement Systems 2018”. It is a result of the “Sensoren und Messsysteme 2018, 19. ITG-/GMA-Fachtagung”, Nürnberg, Germany, from 26 June 2018 to 27 June 2018.
Parts of the work are funded by the German Federal Ministry of Education and
Research, project nos. 03EK3029C and 03SF0542D, and by Sächsische
Aufbaubank, grant 100243804/3235. The authors want to thank Matthias Schelter
for his valuable contributions to this work.
Edited by: Peter A. Lieberzeit
Reviewed by: two anonymous referees
Fouletier, J., Vitter, G., and Kleitz, M.: Measurement and regulation of oxygen content in gases using solid electrolyte cells, III, Oxygen pump-gauge, J. Appl. Electrochem., 5, 111–120, https://doi.org/10.1007/BF00613213, 1975.
Sahibzada, M., Mantzavinos, D., Hartley, A., Morton, W., and Metcalfe, I. S.: Solid Electrolyte Coulometric Studies of Oxide State and Kinetics, Chem. Eng. Res. Des., 78, 965–970, https://doi.org/10.1205/026387600528229, 2000.
Schelter, M., Zosel, J., Oelßner, W., Guth, U., and Mertig, M.: A solid electrolyte sensor for trace gas analysis, Sensor Actuat. B-Chem., 187, 209–214, https://doi.org/10.1016/j.snb.2012.10.111, 2013.
Schelter, M., Zosel, J., Oelßner, W., and Mertig, M.: A novel method for measuring dissolved gases in liquids, Sensor Actuat. B-Chem., 193, 113–120, https://doi.org/10.1016/j.snb.2013.11.070, 2014.
Schelter, M., Zosel, J., Vashook, V., Guth, U., Oelßner, W., and Mertig, M.: Trace gas measurements with zirconia sensors: An overview, in: Sensors and Electronic Instrumentation Advances: Proceedings of the 2nd International Conference on Sensors Engineering and Electronics Instrumental Advances (SEIA' 2016), 22–23 September, Barcelona, Spain, 2016.
Stöber, M., Cherkouk, C., Leisegang, T., Schelter, M., Zosel, J., Walter, J., Hanzig, J., Zschornak, M., Prucnal, S., Böttger, R., and Meyer, D. C.: Oxygen Exchange Kinetics of SrTiO3 Single Crystals: A Non-Destructive, Quantitative Method, Cryst. Res. Technol., 53, 1800004, https://doi.org/10.1002/crat.201800004, 2018.
Teske, K., Popp, P., and Baumbach, J.: Solid-state coulometric cell as detector for gas chromatography, J. Chromatogr. A, 360, 417–420, https://doi.org/10.1016/S0021-9673(00)91690-X, 1986.
Ullmann, H. and Trofimenko, N.: Composition, structure and transport properties of perovskite-type oxides, Solid State Ionics, 119, 1–8, https://doi.org/10.1016/S0167-2738(98)00474-3, 1999.
Vashook, V., Zosel, J., and Guth, U.: Oxygen solid electrolyte coulometry (OSEC), J. Solid State Electr., 16, 3401–3421, https://doi.org/10.1007/s10008-012-1876-3, 2012.