the Creative Commons Attribution 4.0 License.
the Creative Commons Attribution 4.0 License.
 | 03 May 2018
Bilateral comparison for determining the dynamic characteristic values of contact thermometers in fluids
Silke Augustin
Thomas Fröhlich
Marc Schalles
Stefan Krummeck
In applicable standards and sets of rules (VDI/VDE, 2014; DIN, 2010, 2017), recommendations are made concerning the types of experiments for determining the dynamic parameters in fluids (flowing water and flowing air) under well-defined conditions. In the data sheets of the thermometer manufacturers, quite different specifications can be found, such as time percentage values or time constants. Only a few thermometer manufacturers specify the medium and flow conditions under which these parameters have been determined. Above all, it is not common practice to indicate a measurement uncertainty for the dynamic parameters found. In Augustin et al. (2017), a first model for the indication of the measurement uncertainty of dynamic parameters in flowing air was presented.
The present paper describes the results of a bilateral comparison made for the first time for determining dynamic parameters in the laboratories of the JUMO GmbH & Co. KG Fulda company and at the Institute of Process Measurement and Sensor Technology of the TU Ilmenau. In doing so, two type-N thermocouples with different diameters were investigated in experimental facilities with flowing water and flowing air. Subsequently, the dynamic parameters found were compared with each other. The differences revealed mainly resulted from plant-specific parameters.


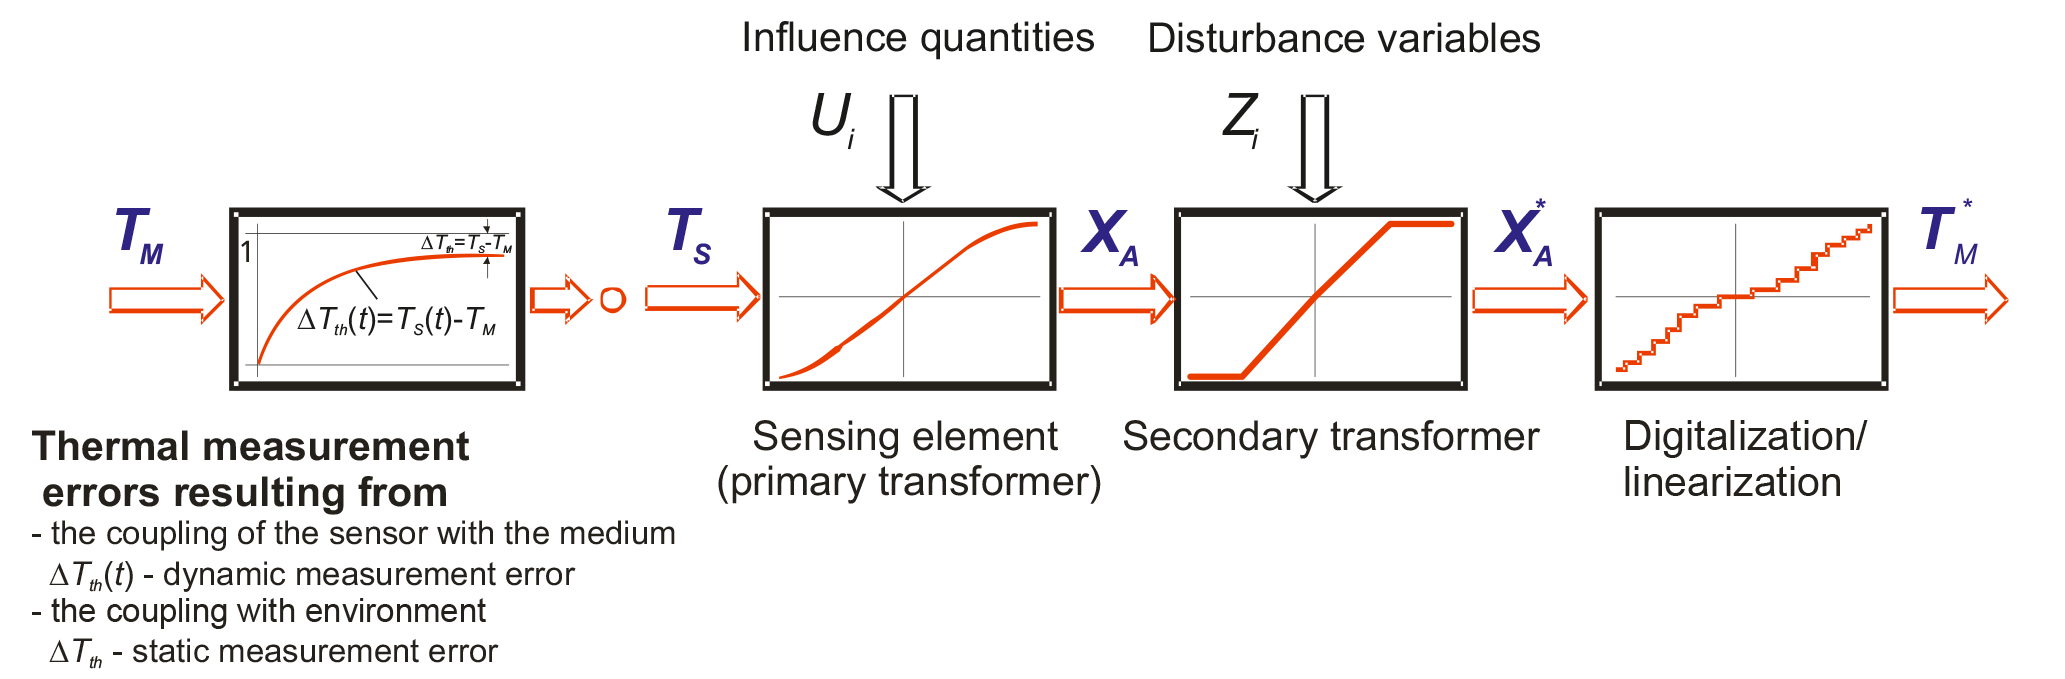
Figure 1Representation of the contact thermometer as a measuring chain (Augustin et al., 2017).
The temperature prevailing in fluids or also on/in solids is often measured by means of contact thermometers. Contact thermometers do not only include mechanical but also electric thermometers (resistance thermometers and thermocouples), which are most commonly used in industry. In contrast to non-contact temperature measurements using radiation thermometers, the contact thermometer must be brought into mechanical contact with the medium. The metrological aim of these measurements is to make sure that the contact thermometer and the measuring medium are in a thermal equilibrium when being in the stationary state (t→∞). In this case, the temperature sensor with the temperature TS assumes the temperature of the measuring medium TM (TS=TM). A prerequisite for this is a sufficiently long heat exchange between the medium and the contact thermometer through the various kinds of heat transport (thermal conduction, convection and heat radiation). Contact thermometers are supposed to make measurements as quickly and exactly as possible. Whether this aim can be achieved depends both on the design structure of the sensor and on the medium and surrounding conditions. Therefore, static and also dynamic measurement deviations of a thermometer can be specified only for well-defined conditions.
In Augustin et al. (2017) and Bernhard (2014), the measurement by means of contact thermometers is described as a measuring chain. Here, the thermal influences resulting from the coupling of the thermometer with the medium, the mounting conditions and the environment are characterized, and the measurement deviations which are due to the conversion of the temperature of the sensing element TS to the variable XA and, depending on some further processing steps, to disturbance variables acting on the secondary converter (e.g., transmitter) and digitalization/linearization are taken into account.
The measurement deviation
(with the indicated measuring value is composed of
-
the thermal measurement errors resulting from the coupling of the sensor with the medium and with the environment presenting a different temperature (represented in Fig. 1, left-hand side),
-
characteristic deviation of the temperature sensor (primary transformer) during the conversion of the temperature of the sensing element TS to a variable XA (e.g., resistance or thermoelectric voltage) and measurement deviations resulting from a change in the influence quantities Ui on the primary transformer (e.g., due to non-linearity or changes in the reference junction temperature in thermocouples, mechanical tensions or thermoelectric voltages in resistance sensors, pressure influence in mechanical thermometers),
-
deviation due to disturbance variables Zi on the secondary transformer (e.g., influence of increasing ambient temperature in head-mounted transmitters),
-
deviation of the measuring value displayed resulting from linearization, resolution of the display, etc.,
The portions of the overall measurement deviation itemized in the last three bullet points above are represented in Fig. 1 on the right-hand side. Their amount depends on the type of the contact thermometer used (resistance thermometer, thermocouple or mechanical thermometer). The value of the single amounts can be determined by calibration. In the relevant guidelines, e.g., DAkkS (2010a, b), it is detailed how these portions of the overall uncertainty of a calibration have to be taken into account.
The deviations ΔTth and ΔTth(t) (Eq. 2) are independent of the physical principle of conversion of the contact thermometer and can be taken into account only partially by calibration. In DAkkS (2010a, b), it is established, for example, for the tempering equipment (thermostatic bath, oven) used for calibration, that – for determining the measurement uncertainty – the spatial and also temporal temperature distribution in the working space as well as the heat dissipation have to be determined quantitatively and taken into account as they exert a considerable influence on the static measurement deviation ΔTth.
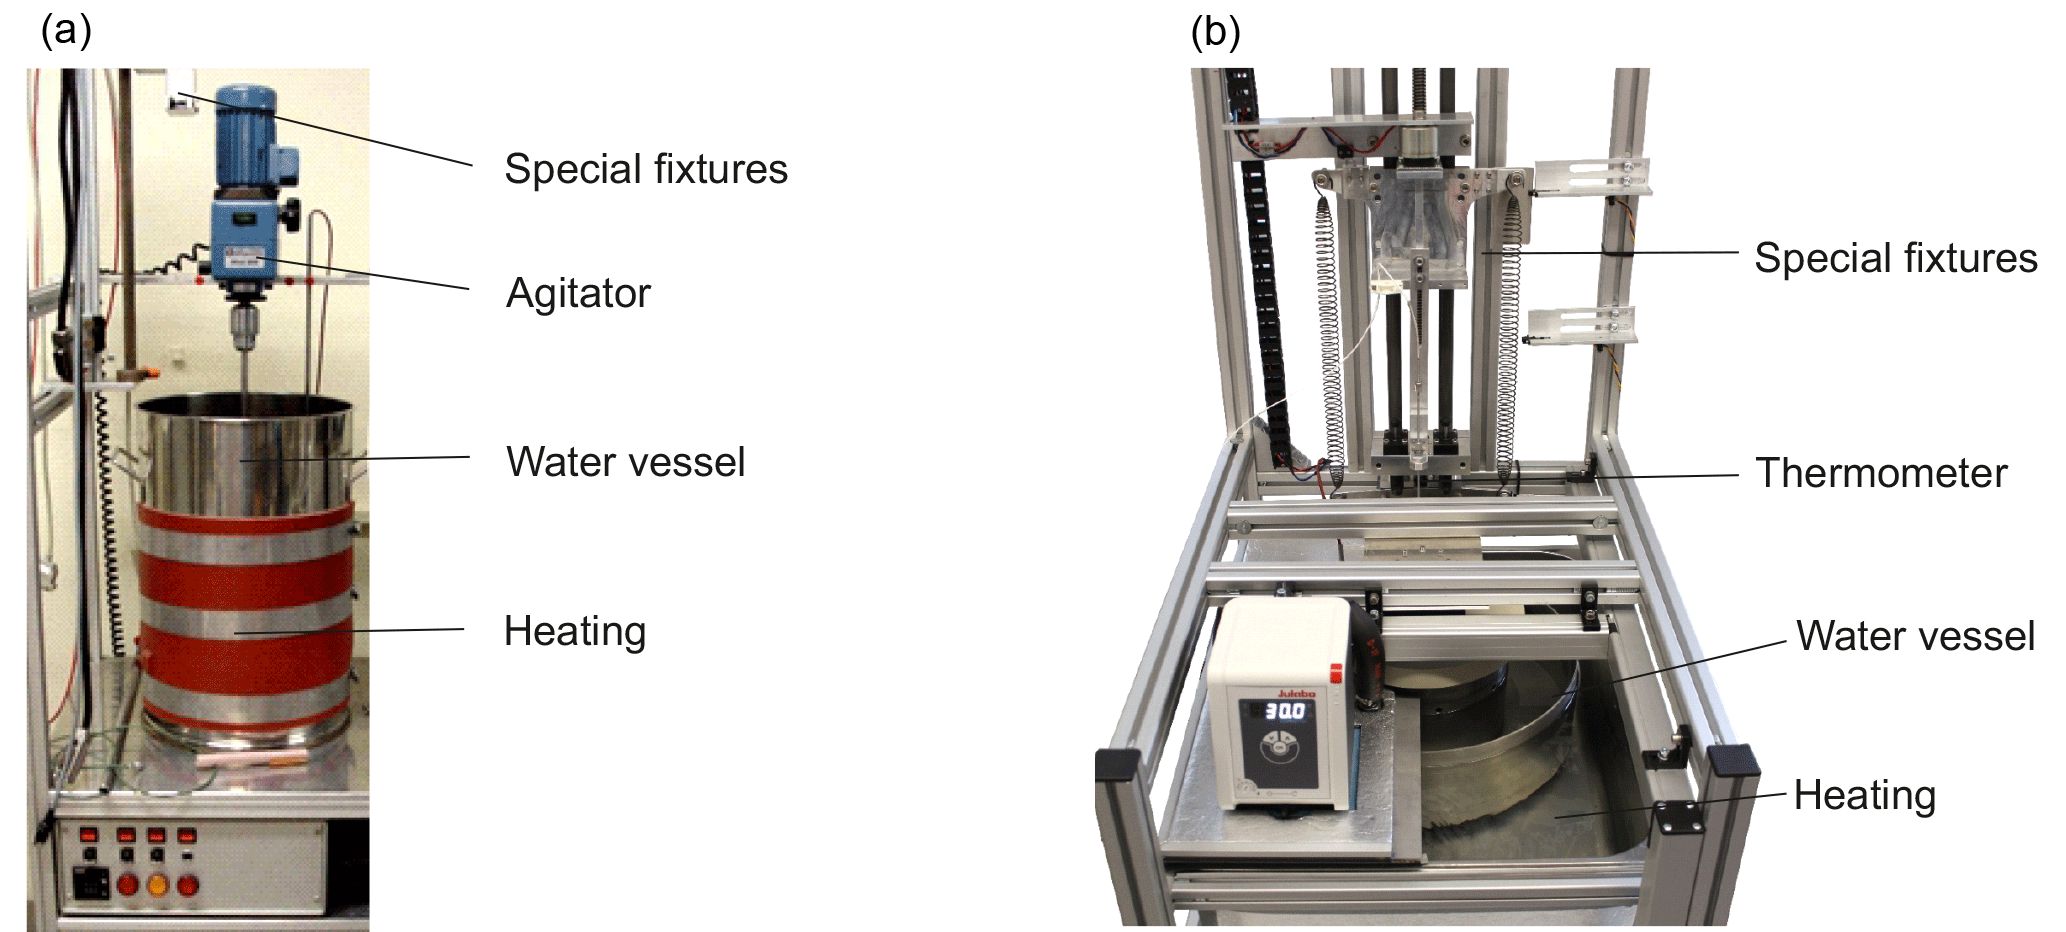
Figure 4Test equipment for flowing water (a JUMO GmbH & Co. KG Fulda company, b TU Ilmenau).
However, the user will, in general, not use the thermometers under calibration conditions but under differing measuring conditions, not always being aware of the fact that the static and dynamic thermal deviations greatly influence the overall measurement uncertainty.
In this paper, the static deviations are not described in greater detail, instead particular attention is devoted to the factors which influence the uncertainty in the determination of the dynamic parameters of contact thermometers. In VDI/VDE (2014), the theoretical fundamentals of the dynamic behavior of contact thermometers as well as possibilities of the experimental determination of the parameters are described. A first approach for determining the measurement uncertainty of the dynamic parameters was presented in Augustin et al. (2017).
This approach shall now be verified and extended further on the basis of a bilateral comparison – unique in this field – between two laboratories.
If the temperature of a medium changes or also if the temperature sensor is placed in or near a medium with a certain temperature TM ≠ TS, the temperature of the sensing element TS(t) of a contact thermometer follows the course over time TM(t) with a delay (VDI/VDE, 2014; Augustin and Fröhlich, 2017).
The course of the temperature of the sensing element TS(t) is mainly influenced by
-
the heat transfer within the medium,
-
the heat transfer/heat exchange between the measurement medium and the contact thermometer,
-
the heat transfer within the contact thermometer and to the environment.
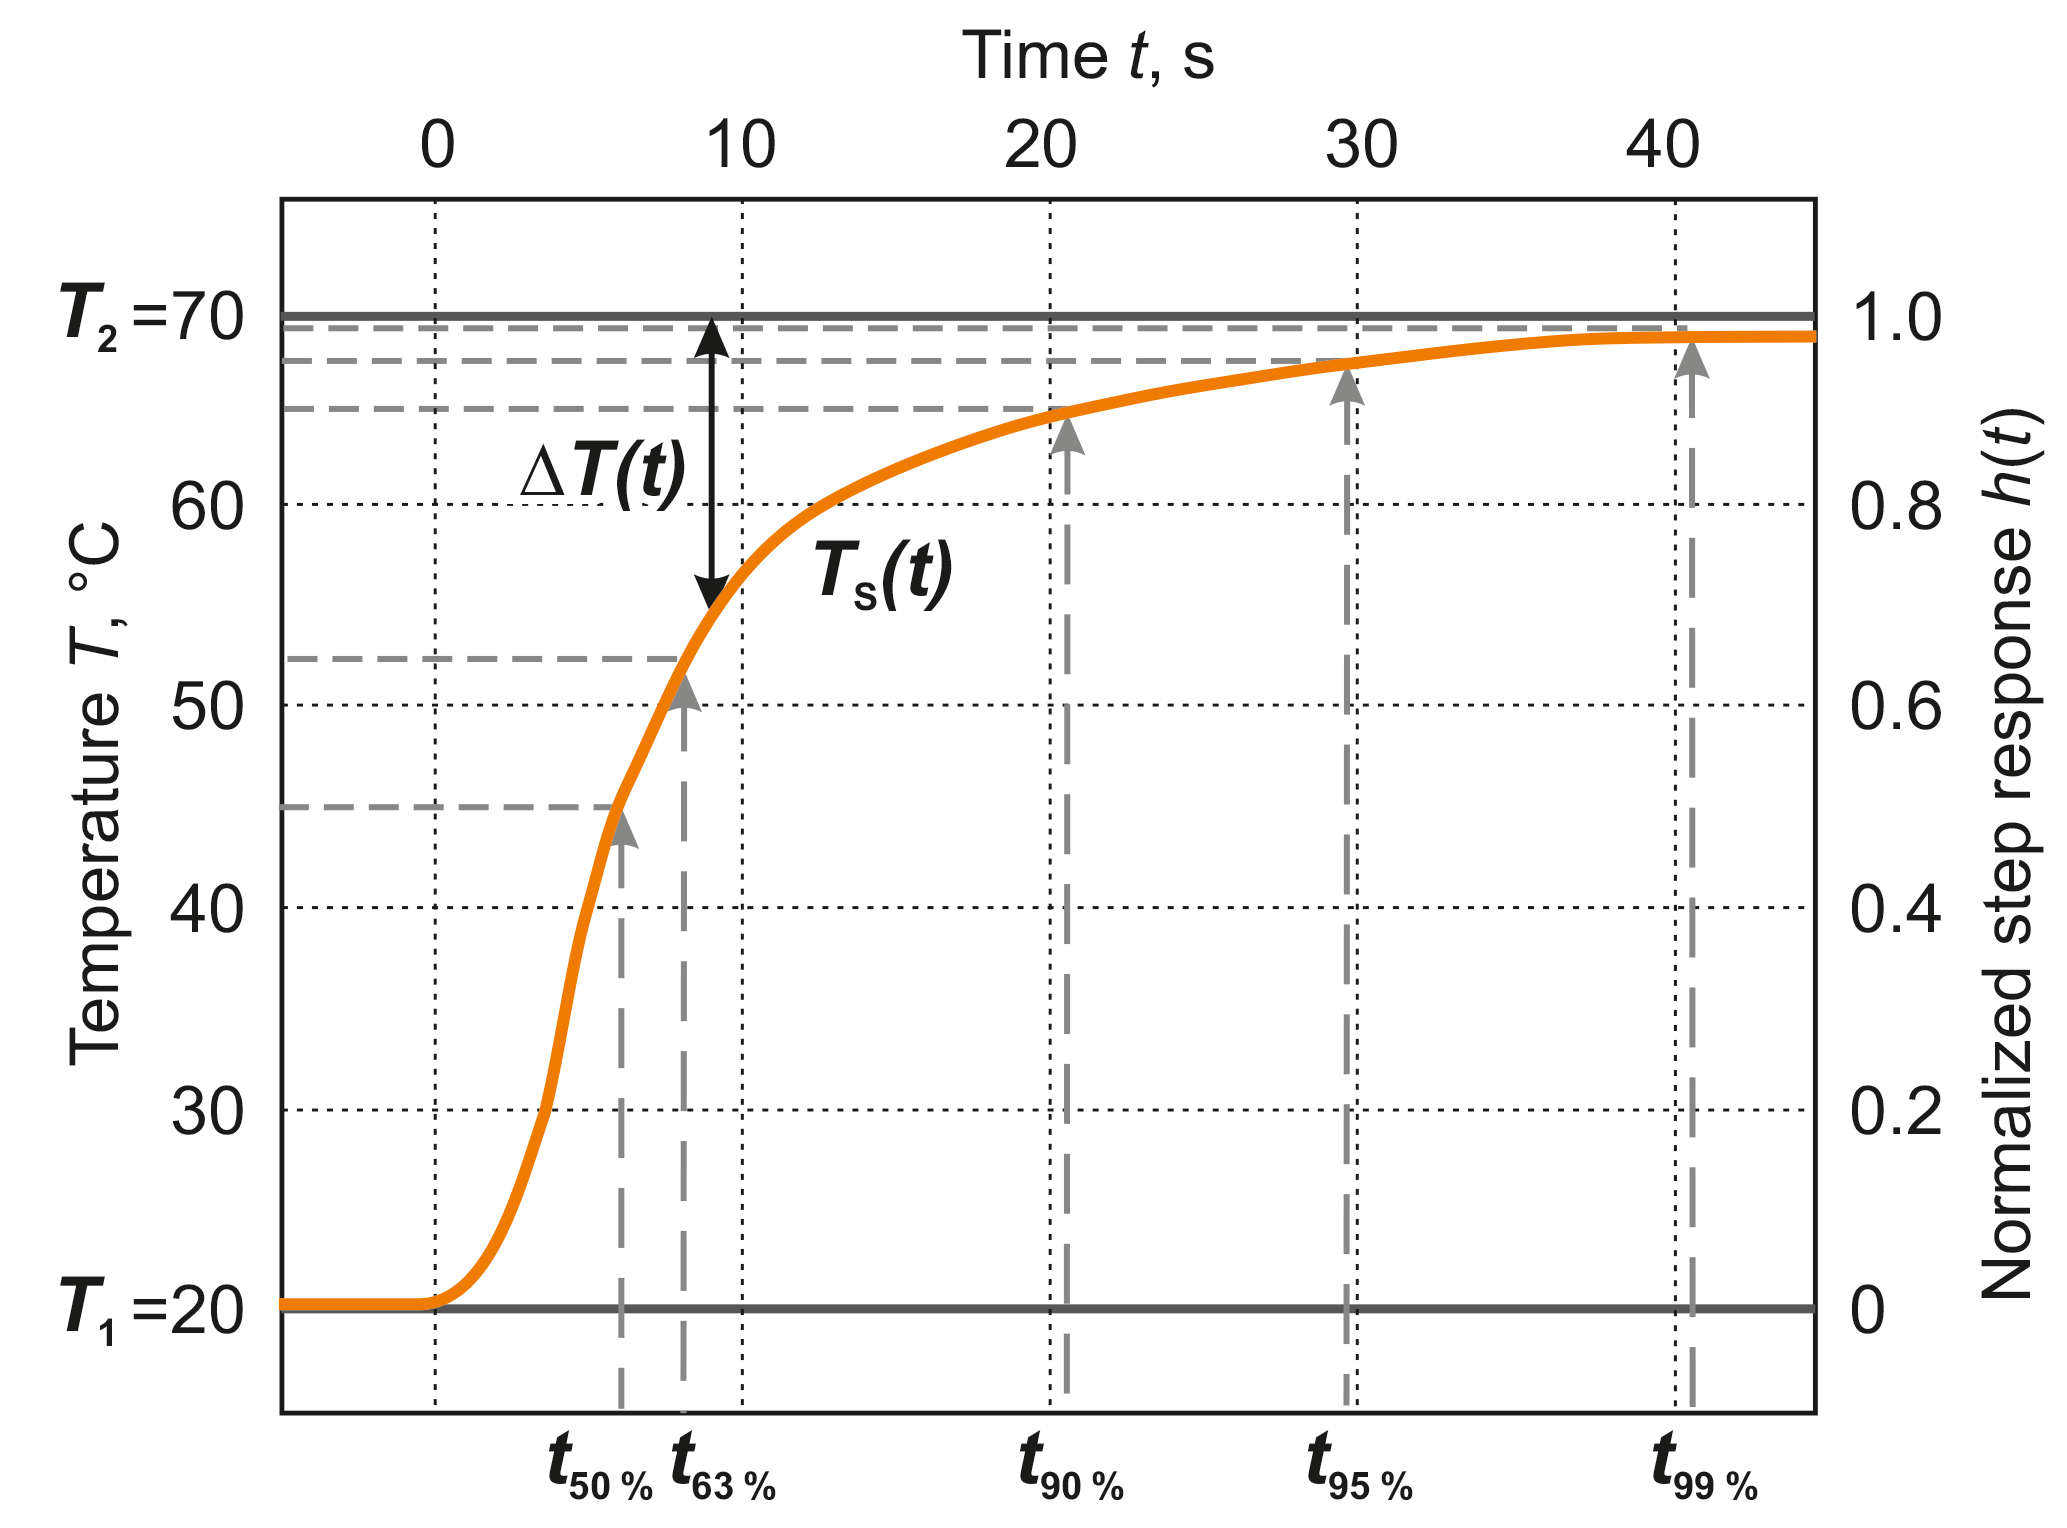
For evaluating quantitatively the dynamic behavior of contact thermometers, dynamic parameters (time percentage values tx%, time constants τ or cut-off frequencies fG) are used (Augustin et al., 2017). They can be described both when installed by changing the medium temperature of the process and by generating a step response when the temperature sensor changes from one medium with the temperature T1 to another medium with the temperature T2 (T1≠T2). In the first case, it should be noted that the dynamic behavior – when installed – cannot be considered independently of the installation conditions, i.e., a change in the medium temperature always affects both the temperature sensor and the point of installation (wall, fitting, insulation, etc.). Therefore, for determining the dynamic parameters the step response is most often used (see Fig. 2).
As a result, the time percentage values tx% (time at which a certain percentage value of the transition function is reached) are determined from the step response. The time constants and also the cut-off frequencies in many cases cannot be determined directly from the step response. For this, transfer functions are more suitable.
In the investigations described in this paper, the time percentage values have been established in each case offline from the measured standardized step response (see Fig. 3):
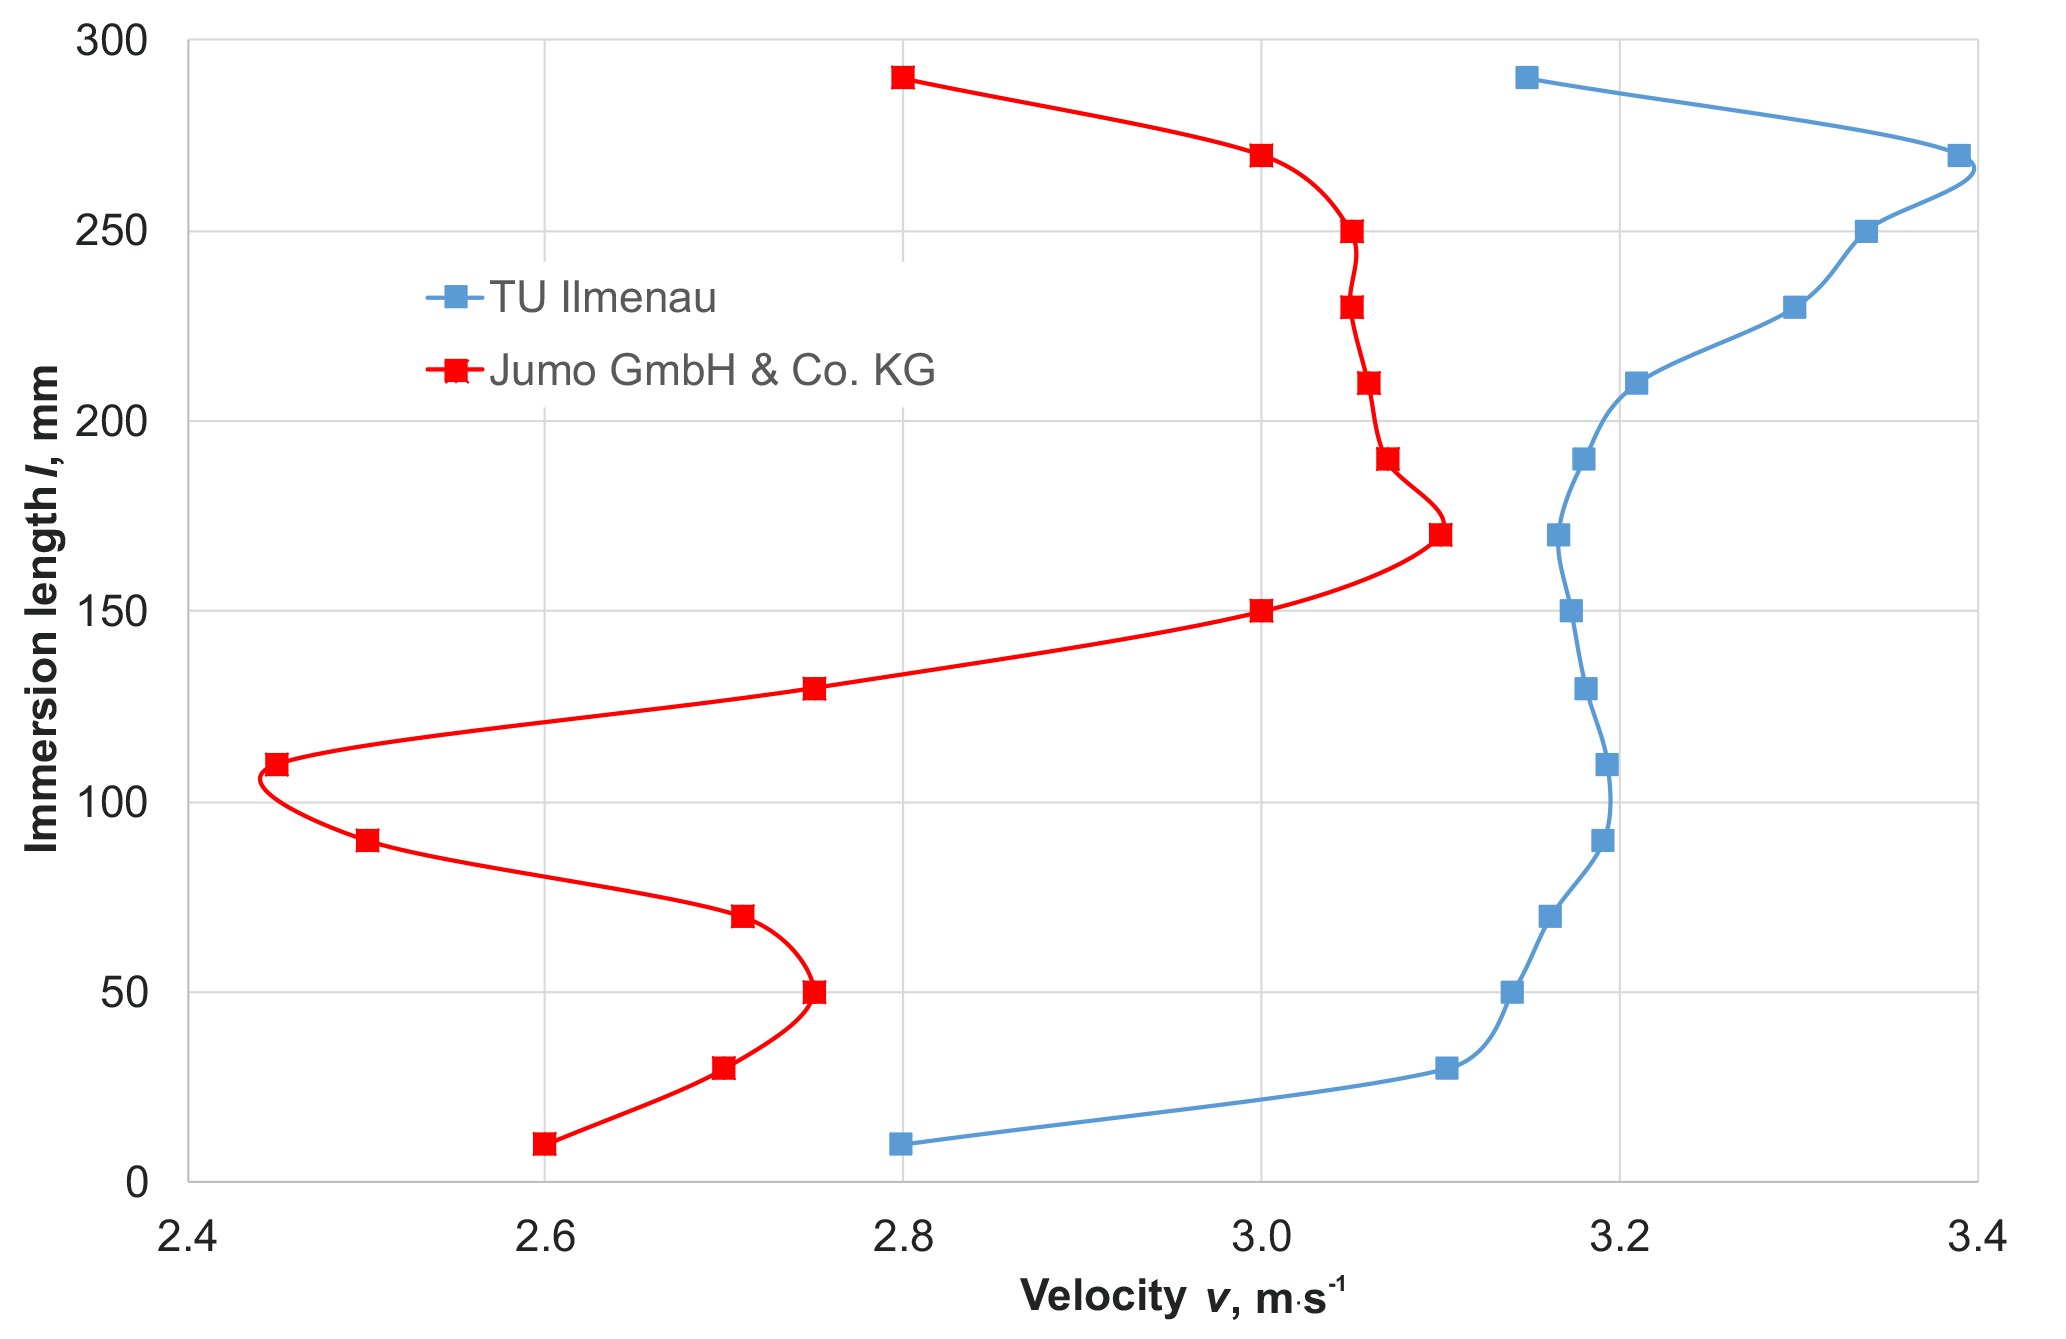
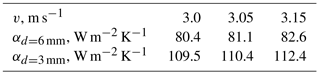
Table 1Dependency of the flow velocity on the heat transfer coefficient (α calculated by using VDI, 2013).
The thermoelectric voltages found were first converted to temperatures in accordance with the standard characteristic; the sensors and the following measuring chain were not calibrated. The average temperature prevailing in the stationary state at the end of the measuring chain was adopted as the medium temperature TM.
The metrological investigations described in the following were carried out in the laboratories of the JUMO GmbH & Co. KG Fulda company and at the Institute of Process Measurement and Sensor Technology of the TU Ilmenau. Two sheathed thermocouples of type N with a length of l= 500 mm and a diameter of d= 6 and 3 mm, respectively, were investigated in test facilities with flowing water and flowing air. The measurements were made at a reference junction temperature of TV= 0 ∘C.
4.1 Test equipment with flowing water
In the laboratories of the Institute of Process Measurement and Sensor Technology of the TU Ilmenau, and of the JUMO GmbH & Co. KG Fulda company, there are two water testing facilities available recommended in VDI/VDE (2014), sheet 2. The tempered measuring medium with the temperature TM is set in a rotational movement inside a round vessel. At time t= 0, the temperature sensor under the test is immersed in the rotating flow from a starting position in the ambient air with the temperature TS(0)≈ 23 ∘C (see Fig. 4).
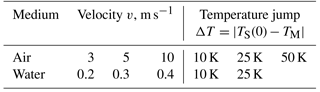
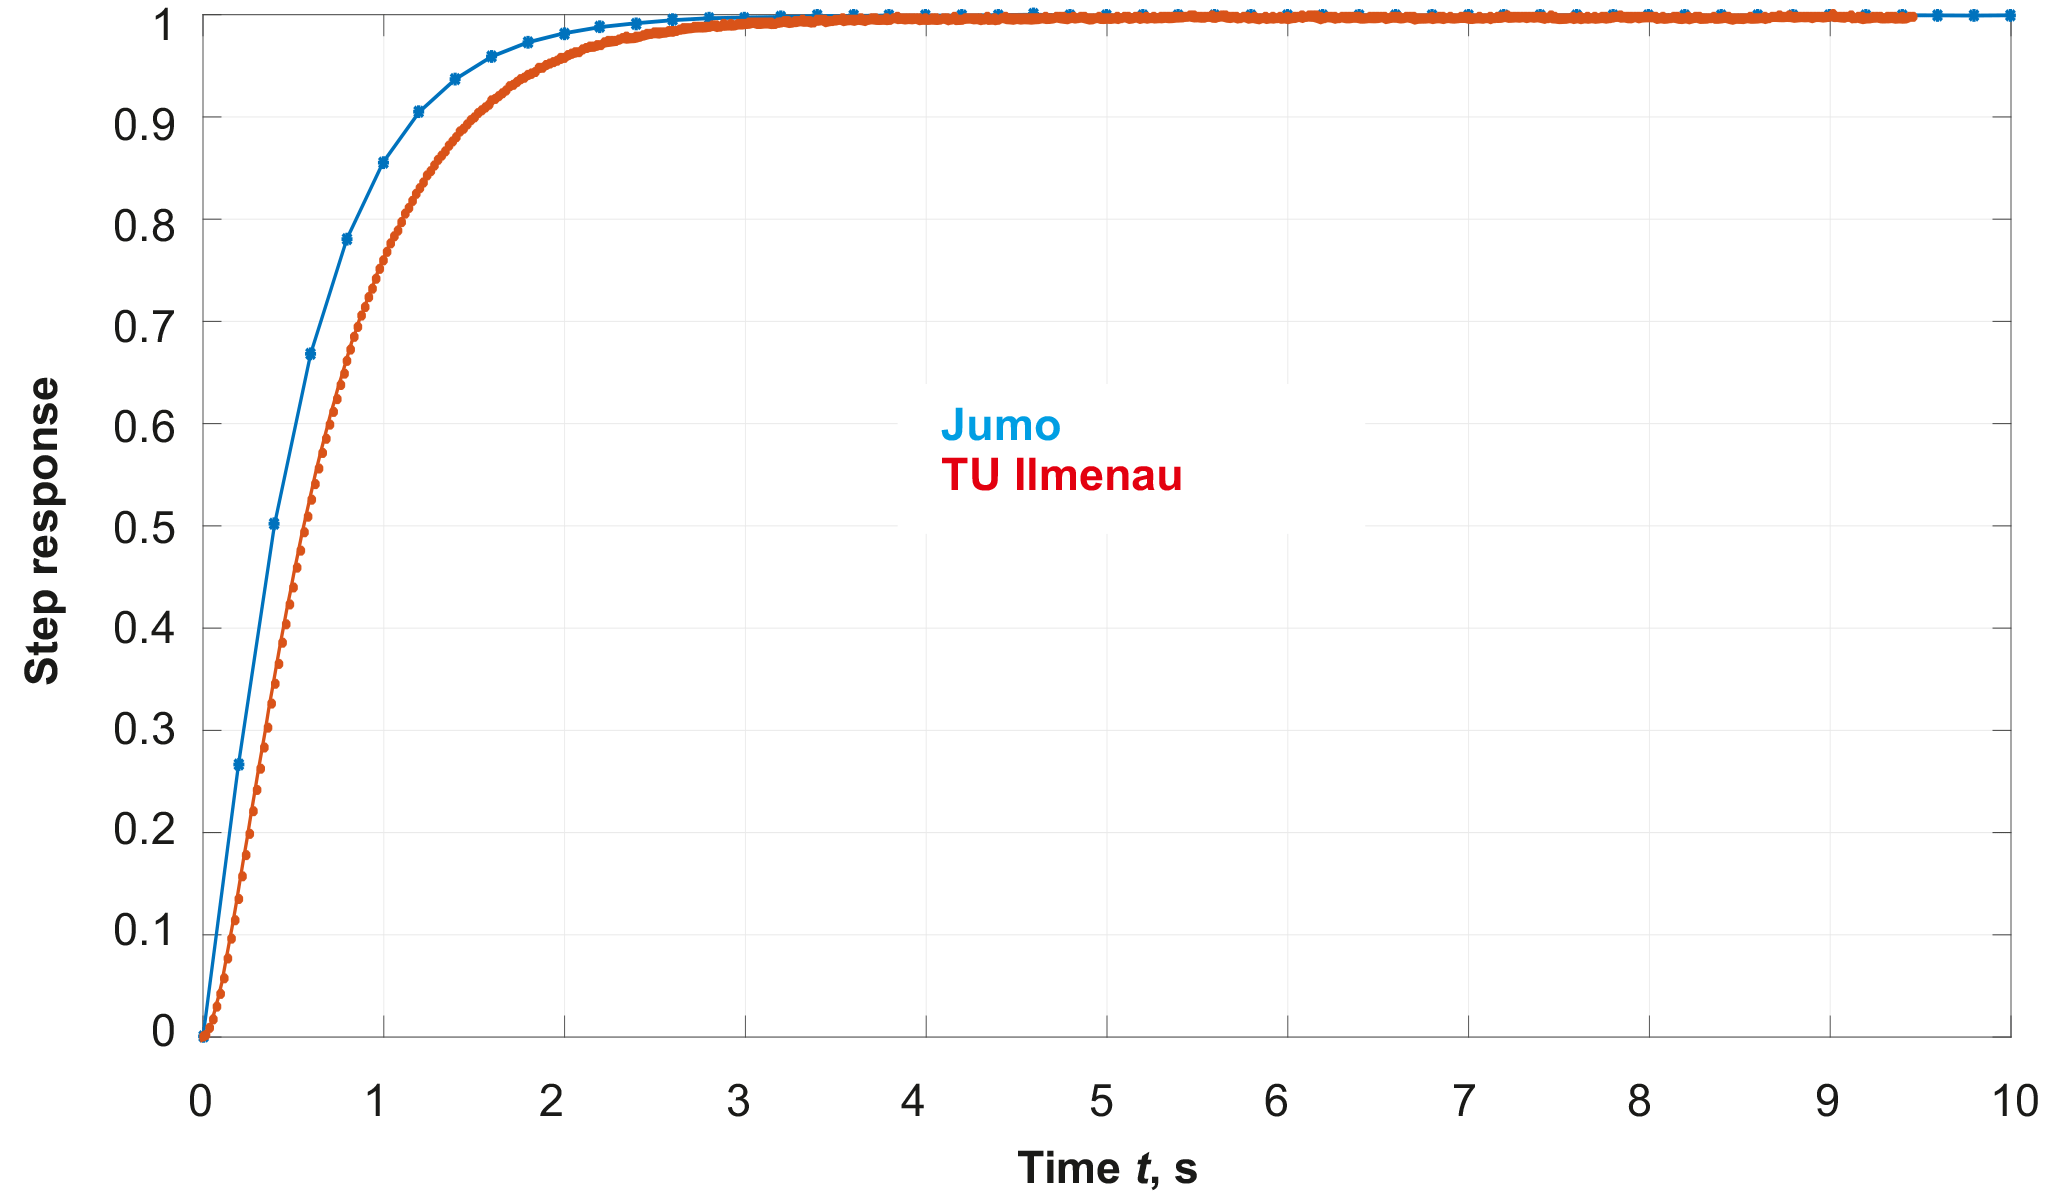
Table 3Time percentage values determined for the thermocouple d= 3 mm and ΔT= 25 K.
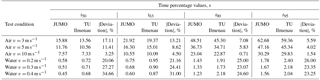
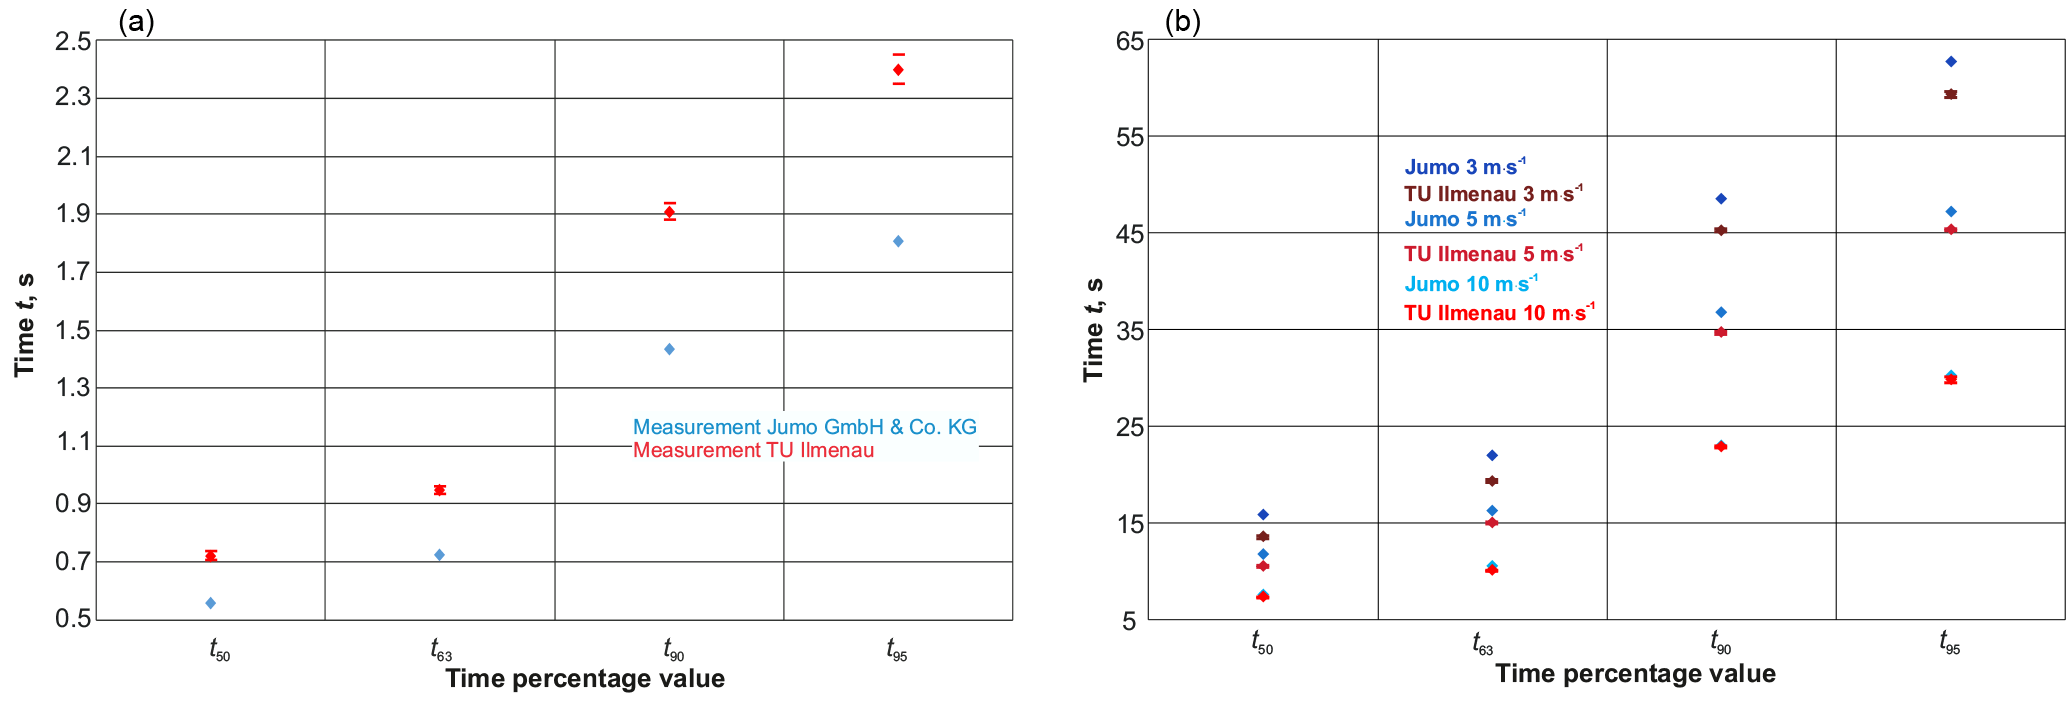
Figure 8(a) Comparison of the time percentage values for measurements in water v= 0.2 m s−1. (b) Comparison of the time percentage values for measurements in air at different flow velocities.
Both test facilities differ from each other particularly with respect to the generation of the water flow. The test equipment available at the TU Ilmenau (Fig. 4 – right-hand side) consists of a motor-driven rotating water vessel placed in an outer temperature-controlled container (Mammen et al., 2017). By contrast, the JUMO GmbH & Co. KG company uses a cylindrical vessel to determine the dynamic parameters in water. In this vessel, the flow is controlled by means of an agitator with a double impeller wheel and adjustable rotational speed (JUMO, 1994). An electrical heating mat mounted on the outside wall is employed to control the temperature of the water.
Both test facilities are provided with special fixtures by means of which the temperature sensors can be immersed in a reproducible way in the water vessel. Previously for both installations, the speed profile prevailing in the area of the point of installation and also the associated measurement uncertainty had been determined.
The thermocouples were immersed at a length of l= 100 mm in the water channel of the TU Ilmenau; the immersion length used at JUMO was l= 200 mm.
4.2 Test equipment with flowing air
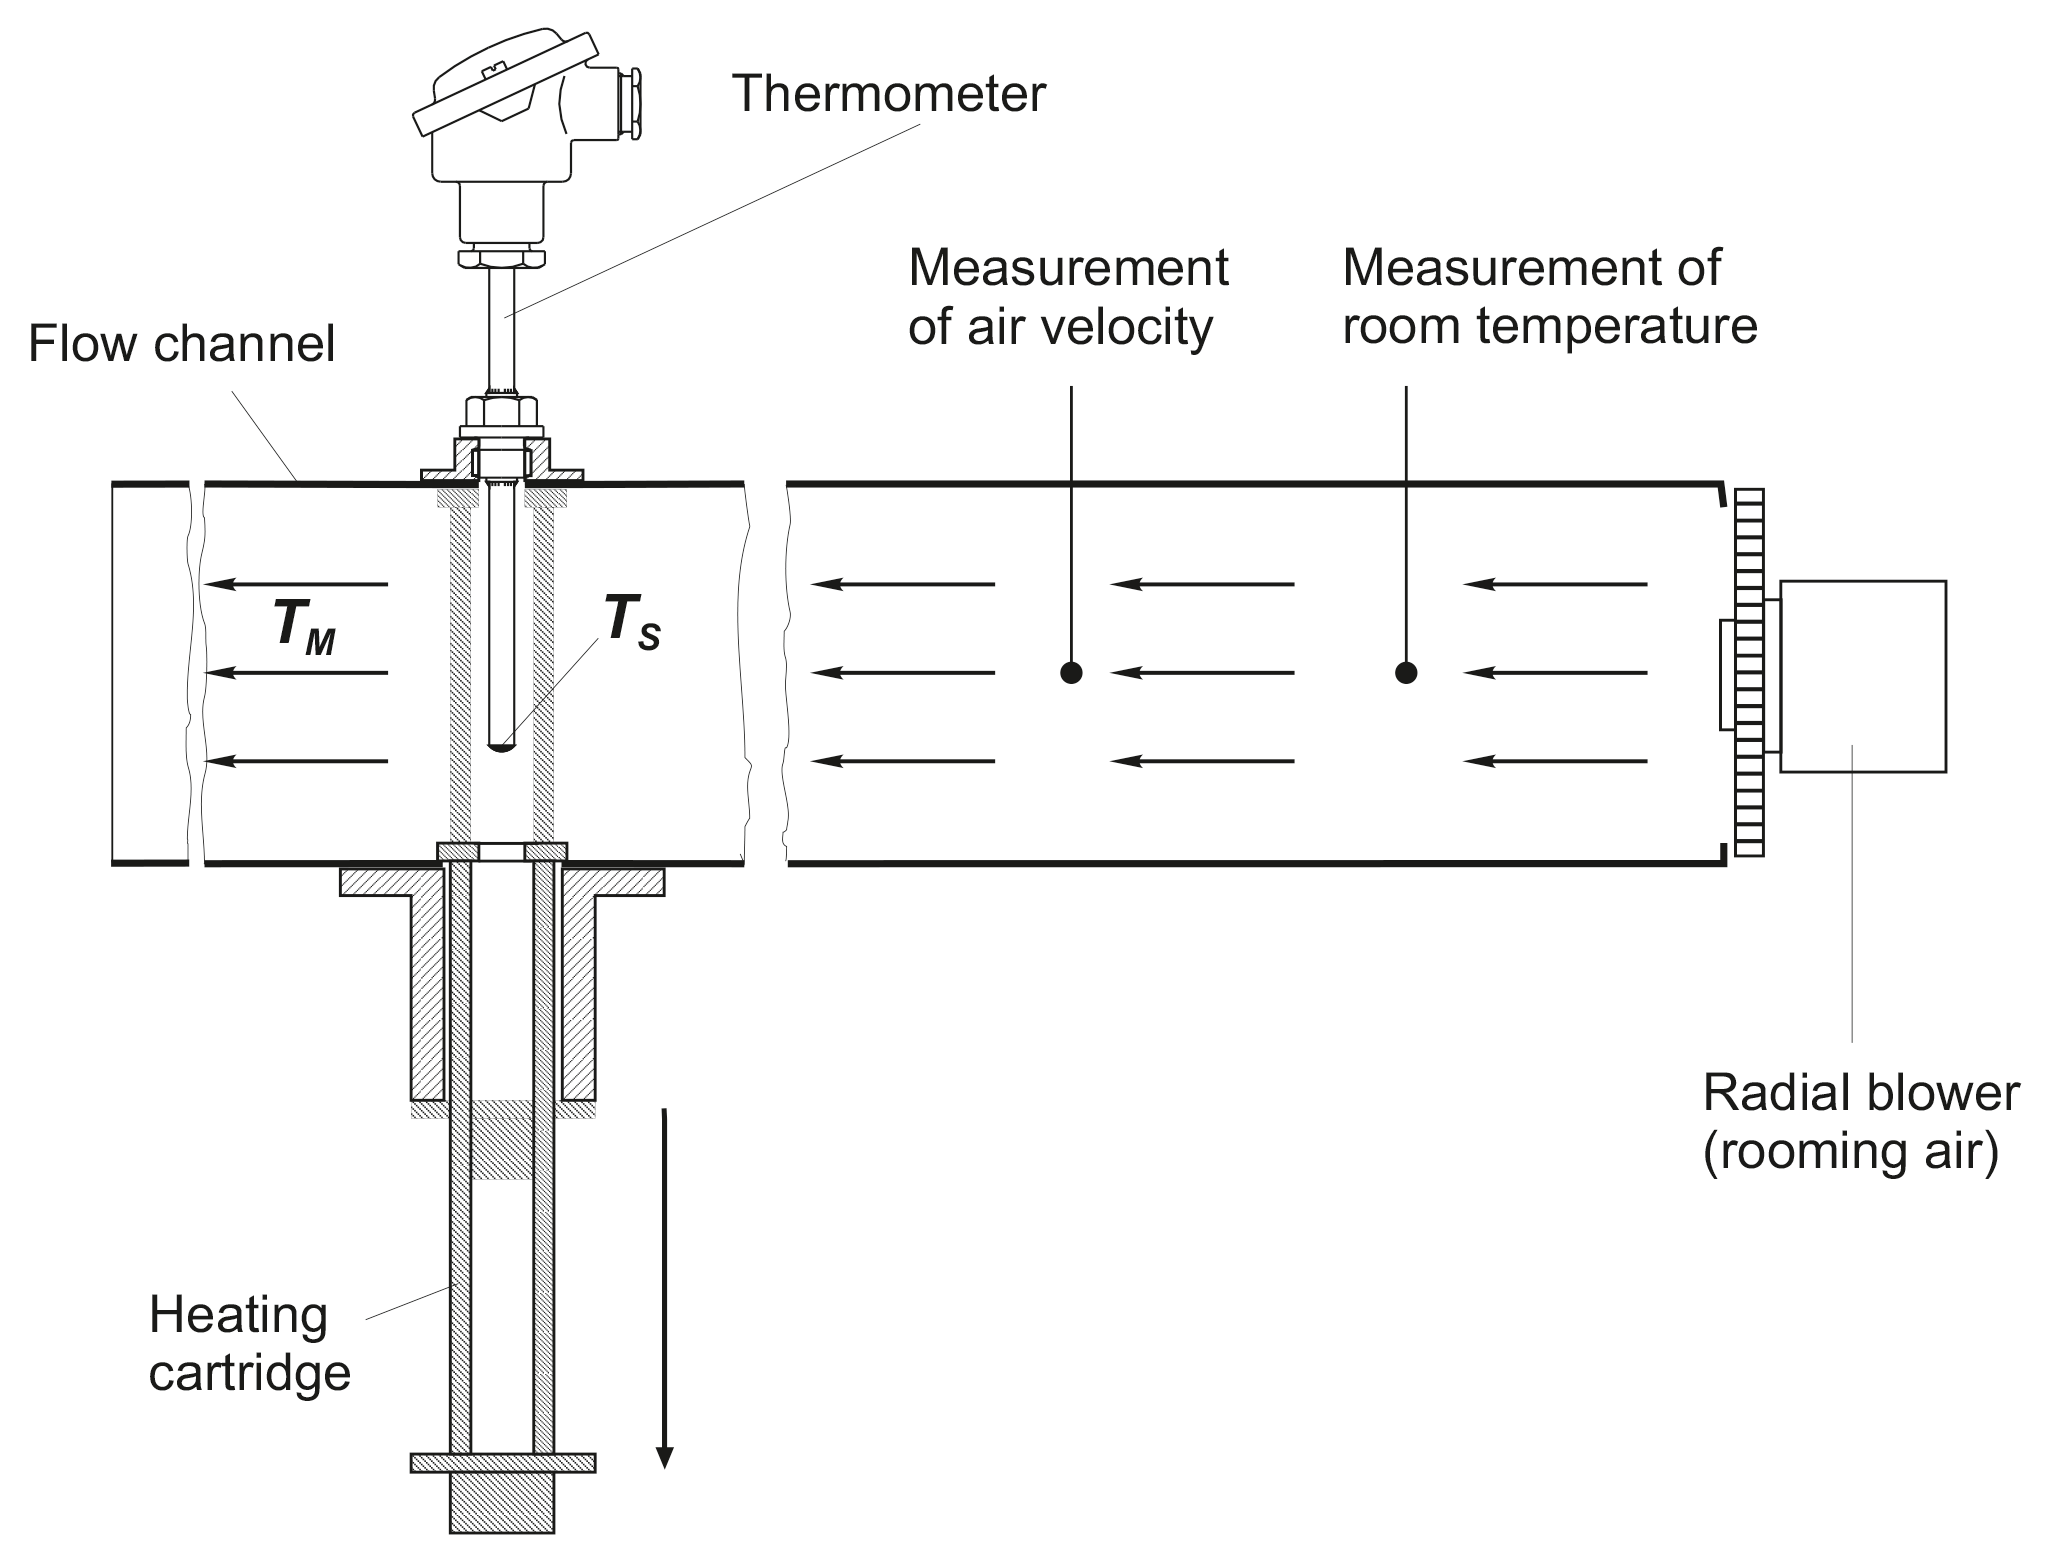
In both laboratories, the dynamic parameters prevailing in air are determined using an installation which is based on the paper published by Lieneweg (1964). The test channel set up at the Institute of Process Measurement and Sensor Technology for determining the dynamic parameters of contact thermometers in air (see Fig. 5) enables temperature steps to a medium temperature approx. equal to the room temperature (TM≈ 23 ∘C) from initial temperature (TS(0)= 40–200 ∘C) at flow velocities of v= 1–10 m s−1. It has an inner diameter of 300 mm and a length of about 4000 mm. The inlet pipe between the channel adapter for the radial blower and the measuring section is 1700 mm long. In the channel, the thermometers are heated to the initial temperature TS(0) by means of the removable heating pipe. The construction of the heating pipe is such that only the thermometer itself is heated, not the air flowing past. At time t = 0, the heating cartridge drops down by gravitational acceleration. The thermometer is cooled down by the air with TM≈ 23 ∘C flowing through the channel at the preset speed (during the heating phase the blower is always running). This speed is registered by a thermal anemometer during the single measurements.
In the framework of the commissioning, the channel was metrologically characterized in order to be able to estimate some single contributions to the uncertainty of the determination of the dynamic parameters (Wienecke, 1993). These contributions were described again in detail in Augustin et al. (2017).
The test channel used by the JUMO GmbH & Co. KG Fulda company has a similar structure except that it has a rectangular cross section (300 × 200 mm) and a length of 3000 mm. In contrast to the test facility used at the TU Ilmenau, the removable heating pipe can be replaced and, thus, adapted to the dimensions of the sensors to be investigated. For initiating the temperature step, the heating pipe is pneumatically moved downwards, and the radial fan is turned on only when the measurement starts. Therein lies the main difference between the two test facilities, which also has an impact on the time percentage values determined (see Sect. 5).
In preparation of the metrological investigations, the flow profile of the air prevailing at a speed of v= 3 m s−1 in the area of the point of installation of the sensors had been determined in both test channels (see Fig. 6).
The main aim of the preliminary investigations was to find an optimum immersion length of the sensors and to determine how far the speed in the area of the point of installation deviates from the velocity set at the controller. It was found that the velocity in the channel used by the JUMO GmbH & Co.KG company is very constant at an immersion depth of l= 180–150 mm, and it is also very constant in the channel used at the TU Ilmenau at l= 90–210 mm. From this, immersion lengths of the thermometer of l= 200 mm (JUMO) and l= 170 mm (TU Ilmenau) were derived for the measurements.
The deviation of the velocity at the point of installation from the preset velocity on the controller of v= 3 m s−1 has a direct influence on the heat transfer coefficient α. This coefficient describes in a simplified form the convective heat transfer of fluids to the surface of the thermometer and can be calculated by various equations (VDI, 2013). It has a decisive influence on the dynamic behavior just as it is true for the constructional design of the temperature sensors. In order to ensure better comparability, the time percentage values of a temperature sensor can also be represented as a function of the heat transfer coefficient (see Fig. 9). In this case, the systematic deviations of the flow velocity must be particularly taken into consideration. For the two test facilities, the different speeds in the area of the installation length affect the heat transfer coefficient in the following manner (see Table 1), with the influence being relatively marginal.

In the case of repeated measurements, the contribution of the flow velocity can be taken into consideration as systematic measurement deviation in the measurement uncertainty budget. The flow profile must be determined for each flow velocity. In the measurement uncertainty budget, also the uncertainty of the determination of the flow velocity itself has to be taken into account.
Using the test facilities described in the preceding chapters, the time percentage values for the two sheathed thermocouples have been determined under the following conditions (see Table 2).
At the TU Ilmenau, the measurements were made in the water test facility with an Agilent 34410A digital multimeter, with the sampling rate being 50 Hz. From this a time step width of tA= 0.02 s resulted at which the single measuring values were saved. In the air channel as well, a measuring device of this type was used. Here, the thermocouples were connected with the multimeter via a channel selector type PREMA 2024, which has an effect on the time step width. In this case, the measuring values were saved at tA= 0.034 s. At the JUMO company, the measuring values were recorded in each case absolutely in both test facilities at a time step width tA= 0.2 s.
The time percentage values obtained at the TU Ilmenau, represented below, are based on five repeated measurements in each case, always made under repeatable conditions; i.e., the installation position of the thermometer and the parameters of the step or also the fixture remained unchanged. At JUMO, three repeated measurements were made in each case.
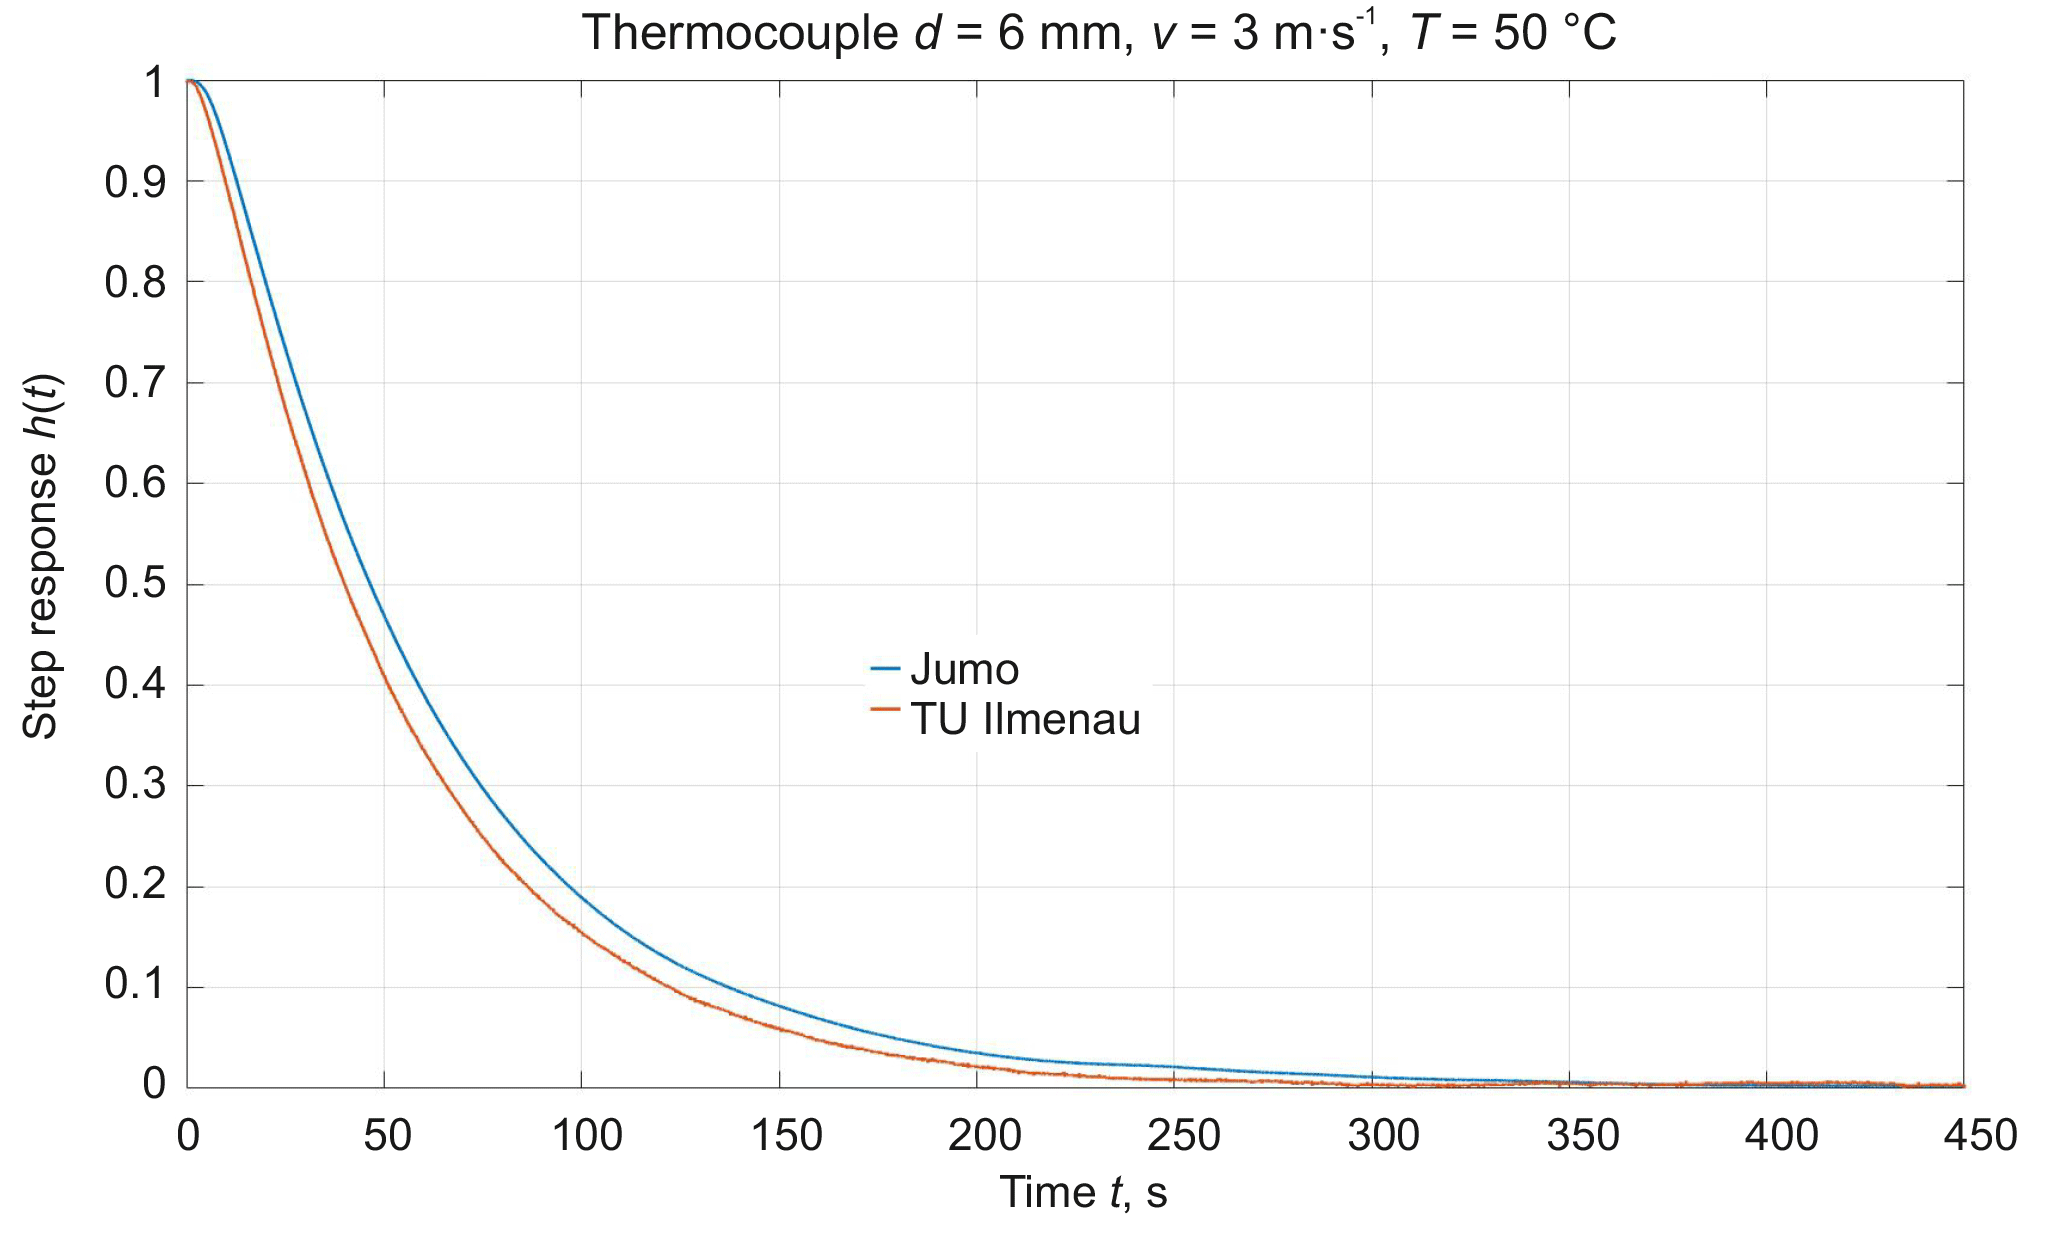
In what follows, the average values for the thermocouple with a diameter of d= 3 mm for a temperature jump of ΔT= 25 K are represented as examples (Table 3, Fig. 8a, b). Analogously, also all other test conditions were evaluated and discussed by both laboratories.
All measurements made in the two laboratories were evaluated at the TU Ilmenau in order to exclude any possible uncertainty contributions resulting from the different determination of the time percentage values (Fröhlich and Blumröder, 1998). For doing this, the original curves registered by the JUMO GmbH & Co. KG company were provided to the TU Ilmenau.
The deviations of the time percentage values in water recorded by the two laboratories lie in a range of about 21–35 %. This is mainly due to the different sampling times during the measurements as the deviation in the range of the small time percentage values is largest. At a sampling time of tA= 0.2 s at JUMO, only 2 to 4 measuring values were recorded in the range of the first time percentage value t50 (see Fig. 7).
As far as the measurements made in air are concerned, the time percentage values differ from each other in a range from about 1–17 %. This is mainly due to the fact that, at JUMO, the blower is turned on only when the heating cartridge is shut down, which can also be explained by the fact that the percentage deviation diminishes towards the end of the step response as well as in the case of higher flow velocities (see Figs. 8b and 9).
Figure 8a and b show the time percentage values with the standard deviations determined from the measurements made at the TU Ilmenau. Another possible way of representing a result can be seen in Fig. 9, where the dependence of the time percentage value t63 % on the heat transfer coefficient is depicted for the sheathed thermocouple with a diameter of d= 3 mm. The time percentage values are represented by a corresponding marking; the solid lines represent the trend lines between the single values.
For the other thermocouple just as for the other test conditions, the deviations lie in a similar range, thus presenting the same trend.
The results of the bilateral comparison have shown that – despite the test facilities set up seemingly according to the same principle – and despite the same test procedure applied for recording and evaluating the measurement results, the dynamic parameters may differ greatly from each other. Therefore, the users who choose the thermometers on the basis of the manufacturer specifications concerning the dynamic parameters should thoroughly scrutinize by means of what type of test equipment those parameters were determined.
For both partners, the purpose of this comparison made for the first time by two laboratories was primarily to quantify their own test equipment and also the measurement procedure.
As far as the differences between the time percentage values determined are concerned, the following causes have been found:
-
scanning rate of the measuring device used, and possibly also the electronic up- and downstream components (up- and downstream switches, transmitters);
-
type and duration of the step triggering, accuracy of the determination of the starting point of the transfer function;
-
accuracy and stability of the determination of the flow velocity;
-
sensitivity of the characteristics of the thermometer used and the uncertainty involved when determining the normalized temperature (Eq. 6);
-
temperature consistency before the step (in the air channel in the heating cartridge) as well as at the end of the step (in the air channel in the laboratory or also in the water test device in the water channel), which also has an impact on the determination of the normalized temperature.
In this paper, no calculations of the measurement uncertainty are discussed as the purpose of the measurements made was mainly to implement some first tests and to qualify the test equipment just as the measurement procedure.
Both laboratories agreed to make further measurements while harmonizing the measurement conditions. Later, the measurement uncertainty budgets shall be determined. In particular, it will be necessary to analyze the temperature dependency of the dynamic characteristic values (Augustin et al., 2015).
The underlying measurement data are not publicly available but can be requested from the authors if required.
The authors declare that they have no conflict of interest.
This article is part of the special issue “Evaluating measurement data and uncertainty”.
It is not associated with a conference.
Edited by: Klaus-Dieter Sommer
Reviewed by: three anonymous referees
Augustin, S. and Fröhlich, T.: Dynamisches Verhalten von Berührungsthermometern, tm-Tech. Mess. 83, 402–409, https://doi.org/10.1515/teme-2015-0068, 2017.
Augustin, S., Fröhlich, T., and Ament, C.: Temperature-Dependent Dynamic Behaviour of Process Temperature Sensors, International Journal of Thermophysics, Springer Verlag, https://doi.org/10.1007/s10765-015-1869-4, 2015.
Augustin, S., Fröhlich, T., and Heydrich, M.: Bestimmung der Messunsicherheit dynamischer Kennwerte von Berührungsthermometern in strömender Luft, tm-Tech. Mess., 84, 73–82, https://doi.org/10.1515/teme-2016-0055, 2017.
Bernhard, F.: Handbuch der Technischen Temperaturmessung, 2. Auflage, Springer-Verlag, 2014.
DAkkS: DAkkS-DKD-R 5-3: Kalibrierung von Thermoelementen, Beuth-Verlag, 1. Neuauflage, 2010a.
DAkkS: DAkkS-DKD-R 5-1: Kalibrierung von Widerstandsthermometern, Beuth-Verlag, 1. Neuauflage, 2010b.
DIN: DIN EN 60751: Industrielle Platin-Widerstandsthermometer und Platin-Temperatursensoren:2008, Beuth Verlag GmbH, 2010.
DIN: DIN EN 61515:2016: Mineralisolierte metallgeschirmte Mantelthermoelementleitungen und Mantelthermoelemente, Beuth Verlag GmbH, 2017.
Fröhlich, T. and Blumröder, G.: Bestimmung des Verhältnisses der Zeitkonstanten zweier Trägheitsglieder erster Ordnung aus der Differenz der Sprungantworten, Technisches Messen, Band 65, 1998.
JUMO: Prüfverfahren und Messablauf zur Ermittlung der Ansprechzeiten, Internes Papier, JUMO, Fulda, 1994.
Lieneweg, F.: Übergangsfunktion (Anzeigeverzögerung) von Thermometern – Aufnahmetechnik, Meßergebnisse, Auswertungen, Archiv für Technisches Messen, 1964, R46–R53, 1964.
Mammen, H., Krapf, G., Hoffmann, C., Sasiuk, T., Pufke, M., Marin, S., Fröhlich, T.: Prüfeinrichtung zur Untersuchung des dynamischen Verhaltens von Berührungsthermometern in Wasser, TEMPERATUR 2017, PTB Berlin, Tagungsband, 163–168, 17 and 18 Mai 2017, Berlin, 2017.
VDI: VDI-Wärmeatlas, 11. bearbeitete und erweiterte Auflage, Springer-Verlag Berlin Heidelberg, 2013.
VDI/VDE: VDI/VDE-Richtlinie 3522: Dynamisches Verhalten von Berührungsthermometern, VDI-Verlag GmbH, 2014.
Wienecke, J.: Dynamik-Prüfeinrichtung für industrielle Temperaturfühler, Diplomarbeit, TU Ilmenau, 1993.