the Creative Commons Attribution 4.0 License.
the Creative Commons Attribution 4.0 License.
 | 05 Apr 2018
Highly sensitive benzene detection with metal oxide semiconductor gas sensors – an inter-laboratory comparison
Tilman Sauerwald
Tobias Baur
Martin Leidinger
Wolfhard Reimringer
Laurent Spinelle
Michel Gerboles
Gertjan Kok
Andreas Schütze
For detection of benzene, a gas sensor system with metal oxide semiconductor (MOS) gas sensors using temperature-cycled operation (TCO) is presented. The system has been tested in two different laboratories at the concentration range from 0.5 up to 10 ppb. The system is equipped with three gas sensors and advanced temperature control and read-out electronics for the extraction of features from the TCO signals. A sensor model is used to describe the sensor response in dependence on the gas concentration. It is based on a linear differential surface reduction (DSR) at a low temperature phase, which is linked to an exponential growth of the sensor conductance. To compensate for cross interference to other gases, the DSR is measured at three different temperatures (200, 250, 300 ∘C) and the calculated features are put into a multilinear regression (partial least square regression – PLSR) for the quantification of benzene at both laboratories. In the tests with the first set-up, benzene was supplied in defined gas profiles in a continuous gas flow with variation of humidity and various interferents, e.g. toluene and carbon monoxide (CO). Depending on the gas background and interferents, the quantification accuracy is between ±0.2 and ±2 ppb. The second gas mixing system is based on a circulation of the carrier gas stream in a closed-loop control for the benzene concentration and other test gases based on continuously available reference measurements for benzene and other organic and inorganic compounds. In this system, a similar accuracy was achieved for low background contaminations and constant humidity; the benzene level could be quantified with an error of less than 0.5 ppb. The transfer of regression models for one laboratory to the other has been tested successfully.
- Article
(1164 KB) -
Supplement
(202 KB) - BibTeX
- EndNote


Air quality is an important pre-requisite for public health. The pollution of the air with gaseous compounds contributes relevantly to the burden of disease in industrial and developing countries (Bernstein et al., 2008). One of the most important pollutants is benzene (WHO Regional Office for Europe, 2010). Due to its toxicity and its carcinogenicity, very low concentrations of benzene should be detected and monitored; threshold limits are in the ppb range, e.g. the European Air Quality Directive set the limit value at 5 µg m−3 or 1.6 ppb as the long-term environmental limit (European Parliament and Union, 2008). The benzene detection is also an important topic for indoor air quality and workplace safety, where several national regulations have been put in force, e.g. the Bundesanstalt für Arbeitsschutz und Arbeitsmedizin (2014). For environmental monitoring, analytic techniques, e.g. gas chromatography (GC), are used. In Europe, monitoring of benzene in ambient air is mandatory. The European Air Quality Directive states that the reference method for the measurement of benzene must consist of active or online sampling followed by desorption and gas chromatography (BSI, 2015). Due to the high price and maintenance costs of these methods, the number of points in the measurement network is very limited, but the necessity for a higher spatial resolution of pollution control has been reported (Batterman et al., 1994; Heimann et al., 2015). Within the EMRP project KEY-VOCs, therefore, the use of sensor systems as an indicative method for the measurement of benzene has been tested in order to assess whether the demand for a low-cost measurement device for benzene can be met. A review (Spinelle et al., 2017b) of the existing sensor technology and its commercially available systems has revealed that only very few manufacturers are targeting this concentration range and that it is doubtful whether one of these systems can meet the criteria of detection limit, selectivity and stability (Spinelle et al., 2017a). Therefore, micro analytical systems and prototype sensor systems have been included in the tests. The result of one prototype using metal oxide semiconductor (MOS) gas sensors with temperature cycle operation (TCO) is reported in this paper. This approach has previously been studied for the selective detection of volatile organic compounds (VOCs), e.g. benzene in indoor air (Leidinger et al., 2014; Schütze et al., 2017). MOS gas sensors are very robust and sensitive devices (Morrison, 1981; Sasahara et al., 2004) sensitive to a broad variety of reducing gases. The resistance of the sensor (Eq. 1) is dominated by ionized oxygen at the surface which causes an energy barrier EB and the height of the barrier depends in a quadratic function on the density of the ionized oxygen NS.
The reaction of the reducing gas with the reactive surface oxygen reduces the energy barrier and increases the conductance strongly. For constant temperature and gas concentration the change of surface charge can be described by a mass action law of chemisorbed species leading to a power law for the dependence of conductance and gas concentration (Barsan and Weimar, 2001; Madou and Morrison, 1989). While in a few cases the selectivity of the sensors can be increased by special preparation methods for example described in Hennemann et al. (2012), Kemmler et al. (2012), and Leidinger et al. (2016b), typically multi-signal methods like TCO are used. TCO is a well-known method for the improvement of selectivity reported in a multitude of papers, e.g. Eicker (1977), Gramm and Schütze (2003), and Lee and Reedy (1999). It is dynamic operation (Nakata et al., 1998a, b) and in this sense it enables sensor properties that cannot be found in a sensor at any constant temperature. Following this line, some of us could prove in the last few years that an optimized TCO can increase the sensitivity (Baur et al., 2015) and the stability (Schultealbert et al., 2017) of the sensor signal as well. The model-based optimization uses a set of rate equations for the trapping and release in surface states proposed by Ding et al. (2001). For the quantification of VOC concentrations at the ppb level, a technique based on the relaxation of the conductance at a low temperature phase has been demonstrated (Baur et al., 2015). The technique utilizes the fact that the equilibrium surface coverage with ionized oxygen depends on the sensor temperature. At high temperature (e.g. at 450 ∘C) the surface coverage and thereby the barrier height are higher than at low temperature (e.g. 200 ∘C) (Schultealbert et al., 2017). For a fast temperature reduction, an excess of surface coverage can be obtained (Baur et al., 2015). At this stage, the reaction at the sensor surface is far from equilibrium as the ionosorption of oxygen is very unlikely. The sensor surface is then predominantly reduced by gases, e.g. benzene, causing a strong increase in sensor response compared to isothermal operation. This increase can be several orders of magnitude in terms of relative conductance. The reduction of the surface is linear to the applied gas dosage or gas concentration given that the concentration is constant over one surface reduction (Baur, 2017). The change in the logarithmic sensor conductance lnGinit at the beginning of a low temperature plateau (beginning at t0=0) is linear to the gas concentration cgas.
Please note that Eq. (2) is only valid if the surface charge is still high above equilibrium; otherwise, the ionosorption of new surface charge is not negligible anymore. A detailed discussion can be found in Schultealbert et al. (2017).
Following this line, we could show that the benzene concentration in the range from 500 ppt to 10 ppb air can be quantified very accurately in a purified air background, whereby compensation of the ubiquitous gas background and interfering gas reduces the accuracy of detection (Leidinger et al., 2017).
2.1 Sensor system
The sensor system is equipped with three different commercial MEMS gas sensor elements. Two sensor elements are integrated in a dual-sensor package (MiCS 4510 from SGX, Switzerland) and the third sensor is a single-sensor device (AS-MLV from ams Sensor Solutions, Germany). All sensors are operated in TCO with independent control and read-out. A block diagram of the sensor system can be found in the Supplement (Fig. S1). Rapid temperature changes from a high temperature of 450 ∘C to lower temperatures (200/250/300 ∘C) are used. The duration of the high temperature plateau is 10 s each, for the 200 and 250 ∘C plateau the duration is 35 s, and for the 300 ∘C plateau it is 20 s. The TCO control and the read-out are done using a modified sensor system (SensorToolbox, 3S GmbH, Germany) that can support up to four sensor modules (ToolboxModule). The sensor signal Slog for each sensor is measured using a logarithmic amplifier comparing the sensor current Isens with a reference current Iref=1 mA. The sensor is operated at a constant voltage of 0.25 V; hence, the sensor current Isens=0.25 V ⋅ Gsens is directly linear to the sensor conductance. The output of the logarithmic amplifier is divided by a subsequent voltage divider to match with the voltage range of the analogue–digital converter of the ToolboxModule (Eq. 1). Corresponding to this, a virtual reference conductance Gref can be calculated. The output of the logarithmic amplifier of ULogAmp=0.5 V per decade is divided by a subsequent voltage divider to match with the voltage range of the analogue–digital converter of the ToolboxModule, yielding a voltage Ulog of 0.25 V per decade.
This output voltage (Eq. 3) is defined as sensor signal Slog which is linear to the logarithm of the conductance Gsens of the gas sensing layers.
This measuring method allows us to cover a large signal range, as MOS gas sensor resistances can vary within several orders of magnitude during rapid temperature changes (Baur et al., 2015). Please note that this sensor signal is different from the commonly used sensor response, which is defined as G∕G0. A change in the sensor signal can be easily transformed to a sensor response by . However, the definition of Slog allows a facile calculation of the change surface charge as the time-derived sensor signal Slog is proportional to the rate constant k of surface reduction (Eq. 2), which is itself linear depending on the gas (benzene) concentration (Eq. 4).
2.2 Data processing
We used our DAV3E toolbox (Bastuck et al., 2016) for the data processing. The data processing was performed in three steps: feature extraction, feature selection and quantification. The feature extraction reduces the dimensionality of the classification problem.
A set of features of each temperature cycle was extracted from the signals, which describes the shape of the signal (mean values and slopes). The slopes correspond in first approximation to the rate constant (derivative of the sensor signal Eq. (4)). These features were calculated from several segments of the cyclic sensor signal, covering all set temperatures. The ranges of the features have been varied to find the best selection by the feature selection. Feature selection was performed using a recursive feature elimination support vector machine (RFESVM) (Schüler et al., 2017) to choose the best features for classification.
Using these feature sets and the known benzene concentrations, a PLSR model (partial least squares regression) (Bastuck et al., 2015b; Wold et al., 2001) is calculated, which generates a linear combination of the features to allow an estimation of the benzene concentration.
2.3 Gas tests at the Lab for Measurement Technology (LMT)
In the first laboratory (LMT – Lab for Measurement Technology, Saarbrücken, Germany) the sensor system has been tested using a gas mixing apparatus (GMA) operating by the principle of dynamic dilution. The set-up of this system has been reported in detail previously (Helwig et al., 2014). A two-stage dilution system is used to produce the benzene test gas, starting from a gas cylinder containing 50 ppm benzene in synthetic air. The benzene is diluted with zero air, generated from a cascade of two gas purifiers. The first purifier includes a coarse filter to remove particles and oil. Subsequently, humidity and CO2 are removed by two alternating molar sieves (pressure swing) and hydrocarbons (> C3) are removed by an active charcoal filter. The second purifier has an additional pre-filter and pressure swing followed by a catalytic combustion of hydrogen, carbon monoxide and short chain hydrocarbons (< C4). The catalytic converter is furthermore equipped with a nitrogen oxide scrubber. The pure air is split into eight gas lines, of which five have been used in this investigation. In the first line, pure air saturated with humidity is generated at a dew point of 20 ∘C using an isothermal blubber with HPLC grade water (low organic carbon). The second line is used for dry air. The third line is a two-step dilution using a dry stream of purified air and diluted benzene test gas from a cylinder in the first dilution step. The second dilution step is the combination with the humid and dry main gas stream from the first two lines. In the fourth line, toluene is added to the test gas; it uses the same set-up as the benzene line. The fifth line uses a two-step dilution to generate a background of 500 ppb hydrogen, 150 ppb carbon monoxide and 1820 ppb methane from a gas cylinder with a dilution of these gases in air. These three gases are the main reducing compounds in pure environmental air (Ehhalt and Rohrer, 2009; Gilge et al., 2010). This gas background has a strong impact on the sensor response as well as on the detection limit of the sensor (Leidinger et al., 2017). A mixture of pure zero air with this background will be defined as standard air. The sensors have been tested directly in gas flow of 200 sccm in a stainless steel sensor housing.
2.4 Gas tests at JRC
For the second laboratory campaign, the evaluation was carried out using the JRC (Joint Research Center) exposure chamber. This chamber allows the control of numerous gaseous mixtures including benzene and a set of selected interfering compounds (toluene, m,p-xylene, ethane, propane, n-butane and n-pentane) plus temperature, relative humidity and wind velocity. The exposure chamber is an “O”-shaped ring-tube system, covered with dark insulation material. The full system has already been described elsewhere (Spinelle et al., 2014). All gaseous compounds are added to pure zero air. The micro-sensors in the stainless steel housing described above were directly placed inside the ring tube. High concentration cylinders were used to generate specific levels of pollutants based on the dynamic dilution principle. A specific LabView software using multiple proportional–integral–derivative (PID) feedback loops ensured the stability of the concentration. The reference value for the feedback loop was measured using a PTR-MS (proton-transfer-reaction mass spectrometer) and the reference values were measured by a gas chromatograph with a photo ionization detector (GC-PID 955 from Syntech). The direct input of reference measurements of gaseous compounds, temperature, humidity and and wind speed is used to auto-correct the gas mixture, temperature controlling cryostat and wind velocity by means of an internal fan. In particular, this set-up allows one to set independent criteria for the stability of each parameter and for a defined period of time.
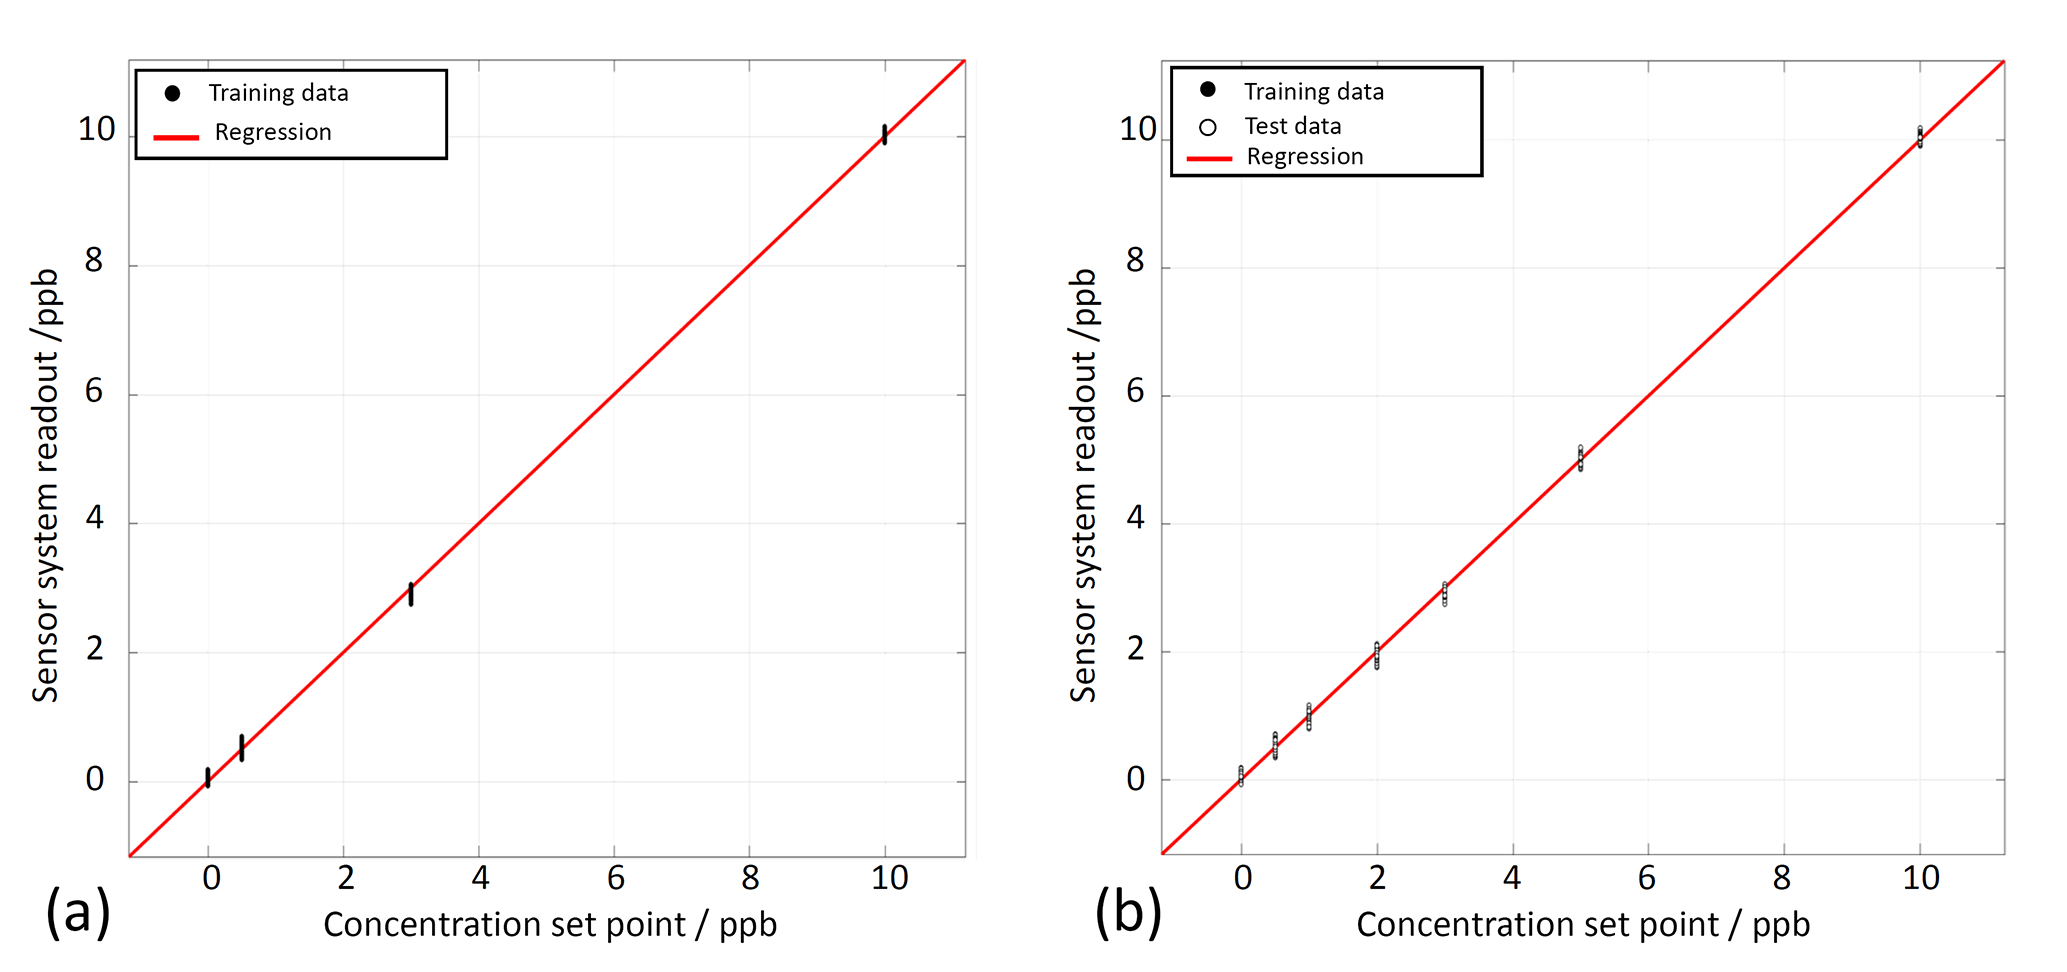
Figure 1Quantification of benzene in zero air using feature extraction and PLSR. (a) Only training data. (b) Training and test data.
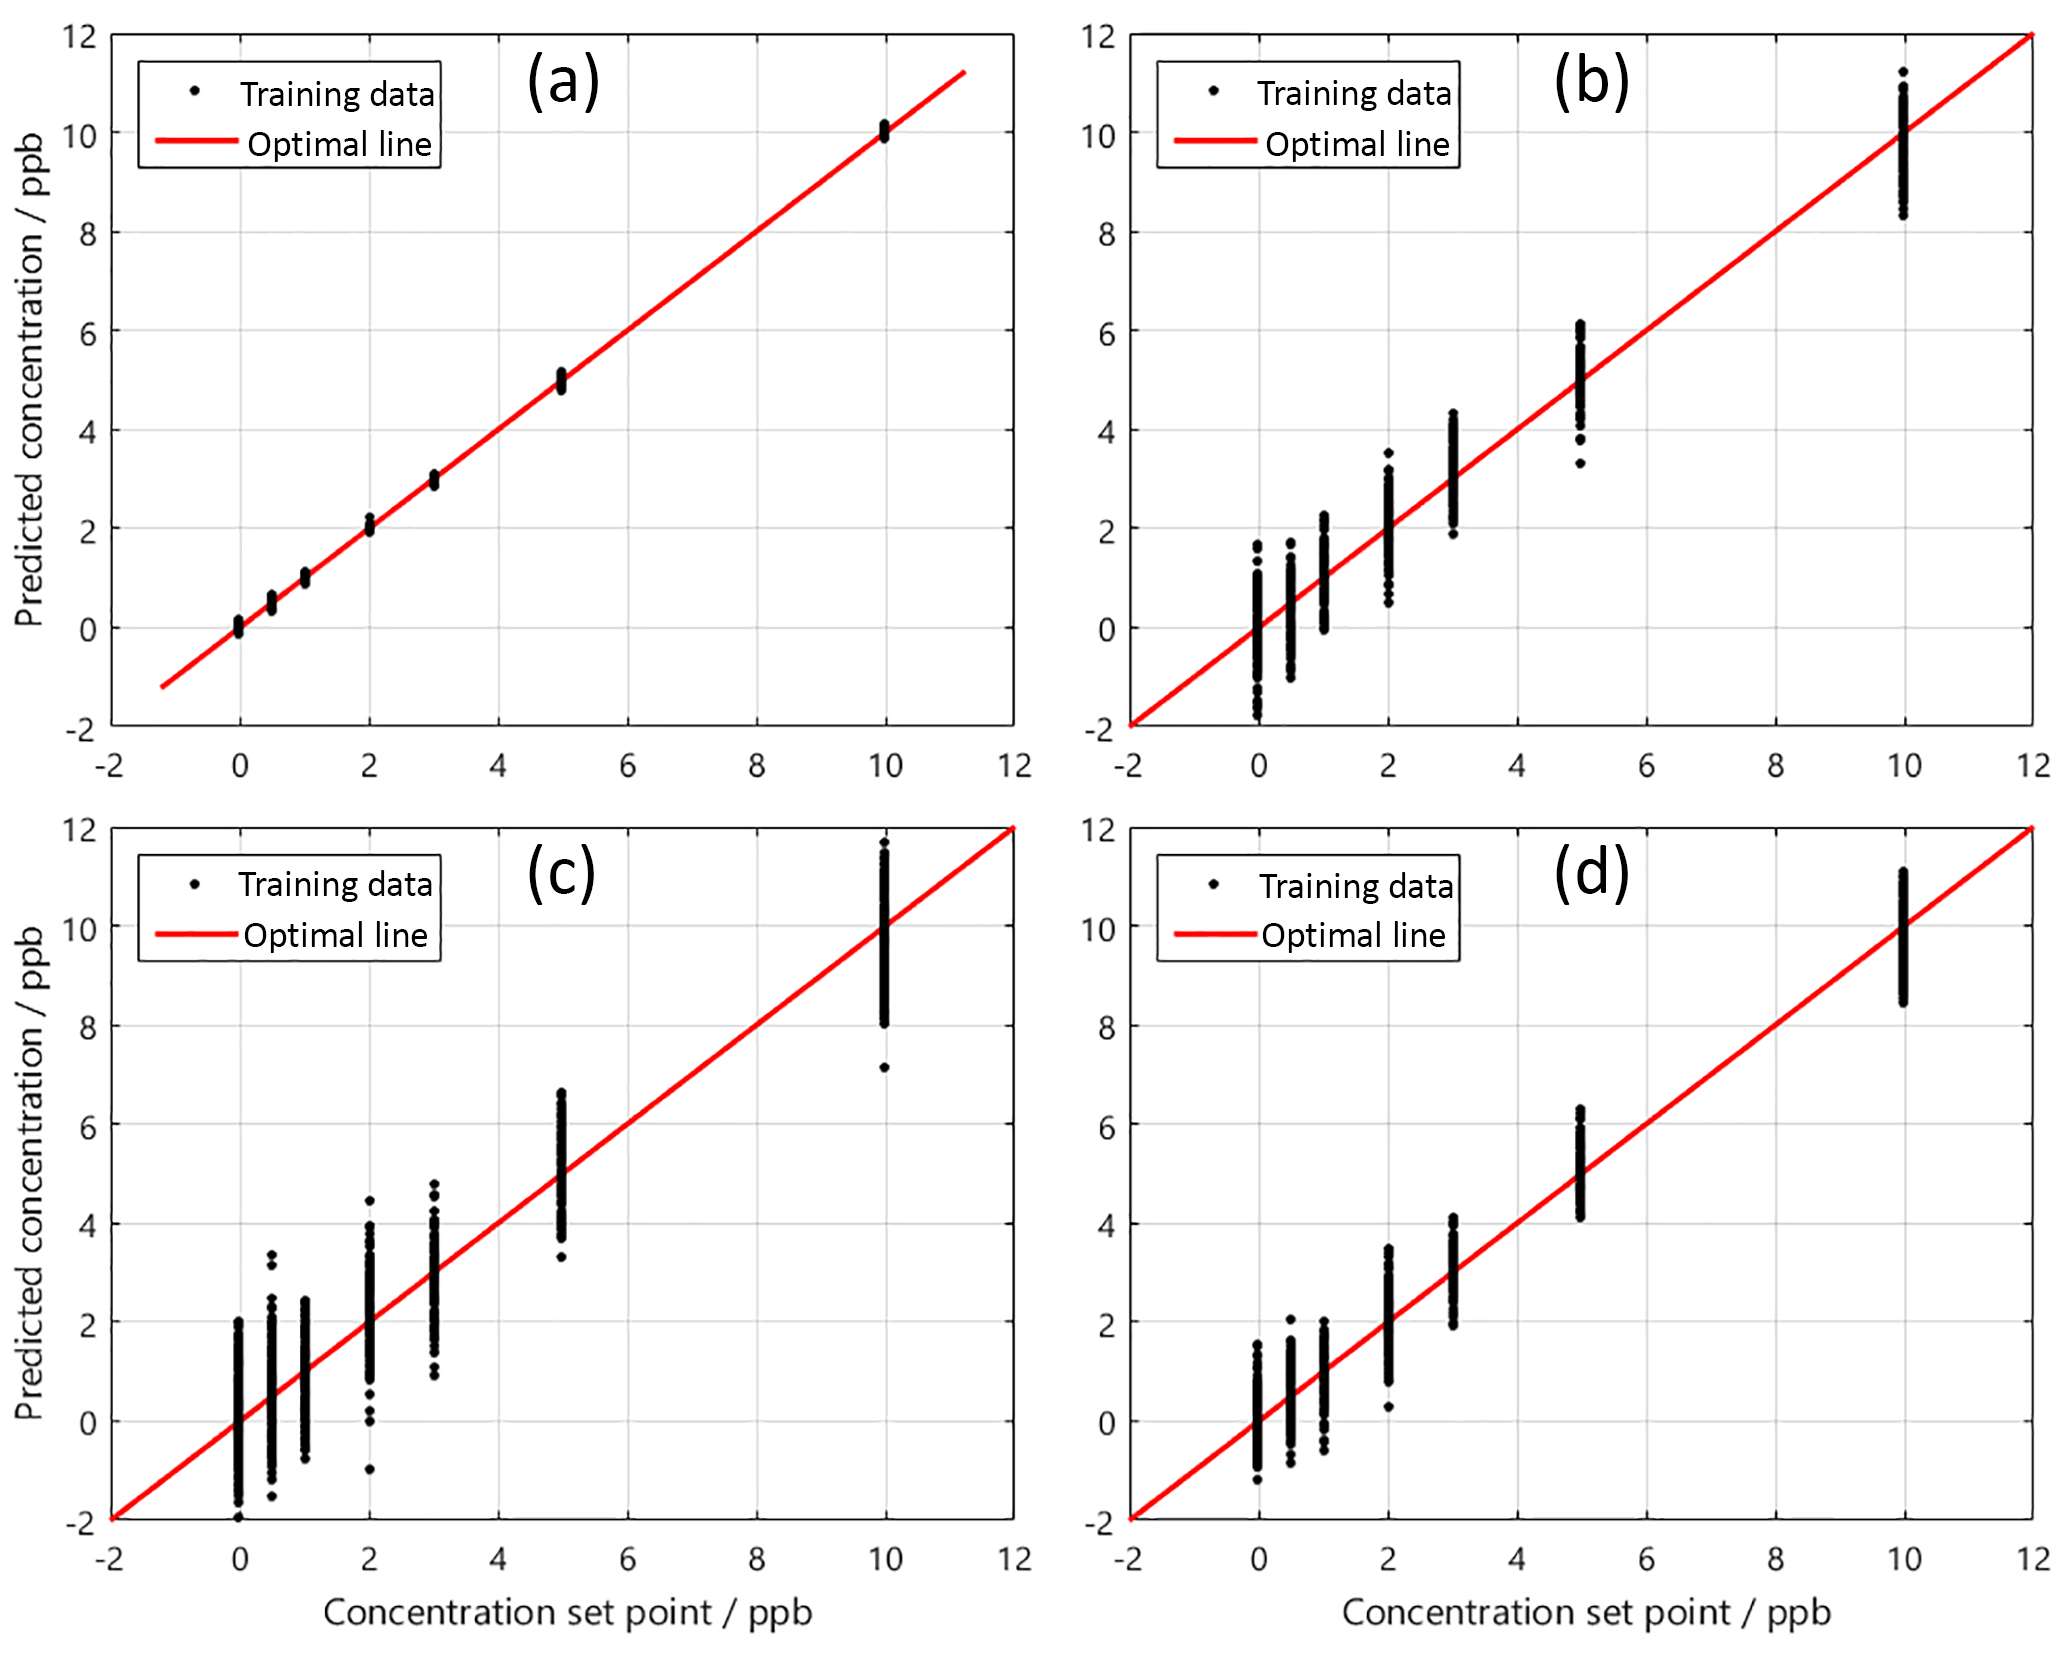
Figure 2PLSR benzene quantification results for four different background and interferent configurations (Leidinger et al., 2017): (a) benzene in pure zero air and with 2 ppb of toluene added, at 25 %RH. (b) Benzene in standard air and variation of CO background, 10, 25 and 40 %RH. (c) Benzene in standard air and variation of toluene, 10, 25 and 40 %RH. (d) Benzene in standard air and variation of toluene and CO, 25 and 40 %RH.
3.1 Benzene quantification capabilities
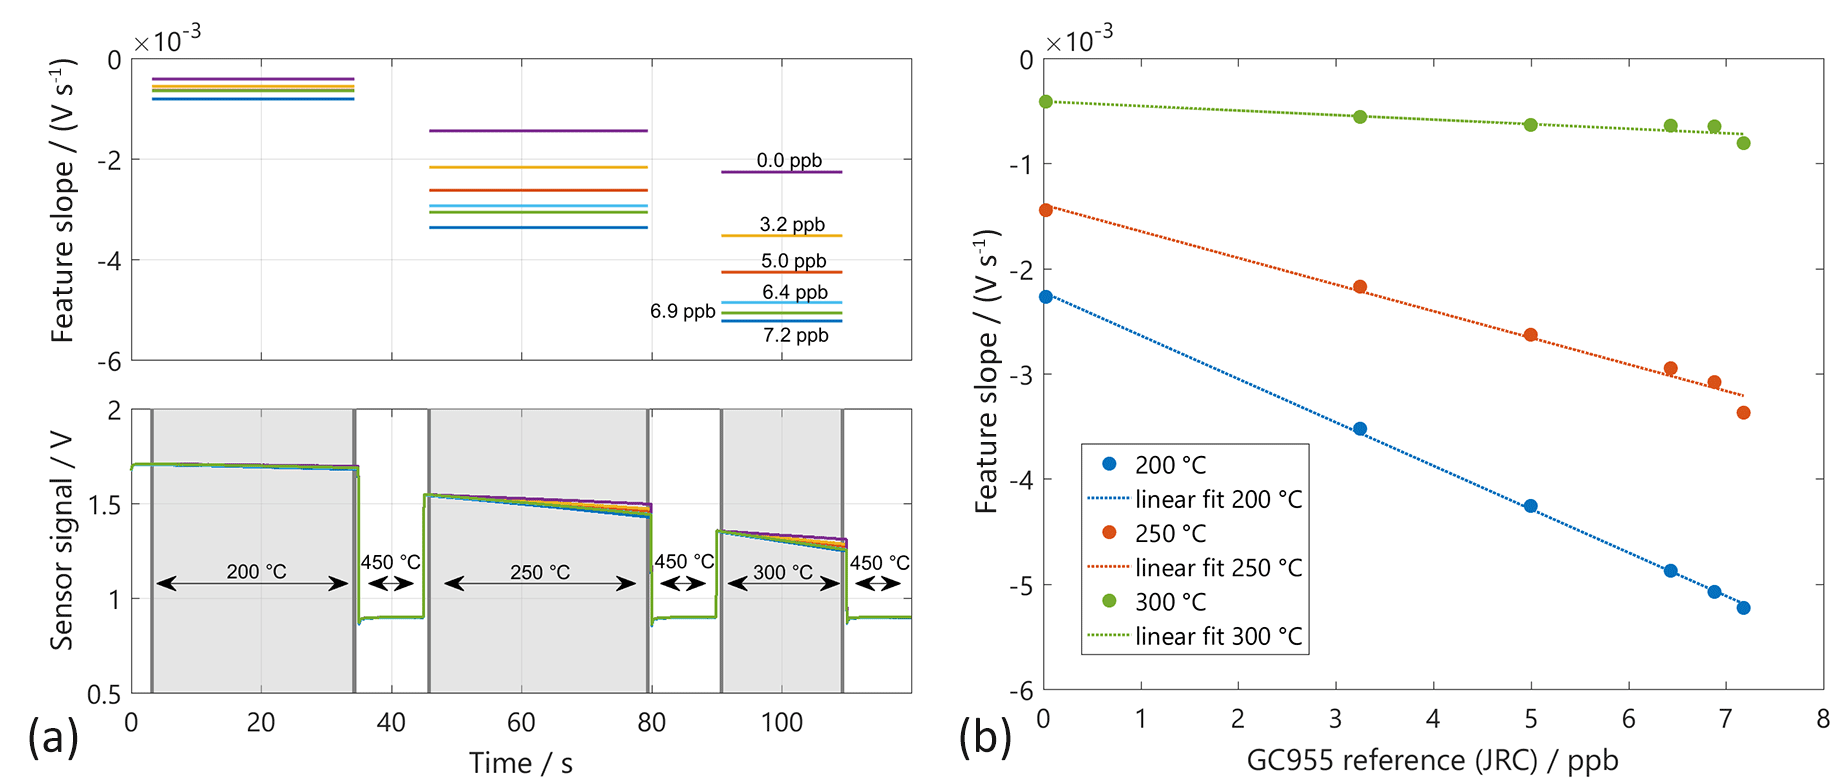
Figure 3(a) Sensor signals in temperature-cycled operation (temperature ranges: blue arrows). The relaxation constants (slope feature) are calculated from the grey marked domains. (b) Feature slope over benzene concentration according to the GC955 reference measurement.
The sensor system has been tested in the LMT system in pure zero air towards benzene at six gas concentrations from 0.5 to 10 ppb and three relative humidities (10, 25, 40 %RH) to test the quantification and humidity compensation. Due to the high purity of the zero air, the conductance of the sensors at the beginning of the low temperature phases is very low. The sensor response shows a high noise. The derivative of the sensor response is obviously an even worse signal. Thus, a feature selection tool as described above has been used instead of using the model-based feature directly. The feature selection selected only signals from the less noisy parts of the response curve. To test the quantification of benzene a PLSR has been calculated using the measurement of 0.5, 3 and 10 ppb benzene at 10 and 40 %RH (Fig. 1a). The PLSR is in general a regression of the measured values (e.g. sensor system output) with the “true” values (or a proper estimate, e.g. from a reference measurement). Please note that the value of the concentration set point (x-axis) also adds an additional uncertainty to the regression. As the LMT gas mixing system does not provide continuous reference measurements of the benzene concentration, an estimate of the real value is derived from the mixing ratio of the gas flows and the certified concentration of the gas cylinders. The gas flows are continuously measured and recorded by the gas mixing system. The proper function of the gas mixing system was confirmed as the error of the recorded flow rates is within the error margin. As estimates for the true concentration, the set points of the gas mixing system were used. Figure 1 shows that the PLSR is very accurate. The sensor system output is obviously a linear function for benzene concentration and the compensation of humidity cross-sensitivity is very good. The error of the predicted response is below 0.2 ppb for all trained concentrations. The PLSR model was applied to untrained concentrations of benzene (1, 2 and 5 ppb) at 10 and 40 %RH and to the six concentrations of benzene tested at 25 %RH. This test of the model prediction is shown in Fig. 1b. The full circles denote the trained data points and open circles denote the untrained “test” data point. The test data points do not show any decisive deviation from the trained data points. The interpolation of the benzene concentration and a compensation of an untrained humidity background are demonstrated by this result. However, the quantification of benzene in ambient air at the sub-ppb level cannot be derived from this result since even clean air contains significant inorganic reducing gas components as described in Sect. 2. A similar test therefore has been made under standard air (cf. Sect. 2.2) instead of zero air. The quantification properties have been tested in detail under standard air and other interfering gases in a previous work (Leidinger et al., 2017) showing the strong impact of gas background on the accuracy of the detection. Measurements were made with the dynamic dilution set-up at LMT. In the first case (Fig. 2a), two sweeps of the benzene concentration are included, one in pure zero air without interferents and one with a 2 ppb toluene background, at a constant gas humidity of 25 %RH. The benzene concentrations predicted by the PLSR model still show a very small error of below 200 ppt with respect to the concentration set point. The introduction of standard air has a strong impact on the quantification of benzene. In Fig. 2a the PLSR is shown in standard air, including a variation of the CO concentration between 150 ppb (ubiquitous) and 500 ppb (lightly polluted air). Still, the PLSR shows a linearity between the sensor system output and the set-point concentration, but the error of the prediction is between 1 and 2 ppb depending on the benzene concentration. The addition of interferents like toluene between 2 and 20 ppb (Fig. 2c) seems to reduce the accuracy of the benzene quantification further. However, the strongest impact comes from the standard air conditions. The quantification error can be reduced if the data from 10 %RH are removed from the data set corresponding to a reduction of interfering complexity. Figure 2d contains only two gas humidities; the signals recorded at the lowest value are not taken into account. For this condition the quality of quantification of benzene was improved; compared to the scenarios in Fig. 2b and c, the groups are more compact and error for the benzene concentration is below 1.8 ppb over the whole concentration range.
3.2 Lab intercomparison
After the initial calibration at LMT, the system was transferred to the JRC. During this transfer, the interface of the read-out electronic of the dual sensor (MiCS4514) was damaged. For the lab intercomparison the remaining sensor (AS-MLV) has been used and the signal processing has been re-trained. Only tests with zero air background at various humidity and interferent levels have been compared, as in the JRC set-up no addition of the inorganic background was foreseen. The features have been calculated according to Eq. (4) directly, without selection of the feature ranges using RFESVM. However, a short time span at the beginning of the low temperature has been left out manually to reduce the noise (cf. Fig. 3; the sections for feature extraction are marked in grey). The sensor signal Slog in the low temperature plateaus has a good linearity over the full temperature plateau in good agreement with Eq. (4) for all temperature plateaus at all tested benzene concentrations (Fig. 3). Obviously, the strongest response of the sensor to benzene can be found at 300 ∘C (Fig. 3). Using these features a PLSR model has been trained from the data of the JRC measurement and tested with the data from the LMT measurements. Please note that only three features can be calculated from the single sensor and that the impact of the feature at 200 ∘C is very small, leading to an incomplete compensation compared to the three-sensor system described in Sect. 3.1. Therefore, only measurement results with pure benzene have been evaluated. For the training of the PLSR, the data of the reference measurement from the GC-PID 955 were used as estimates of the true values. We compared the transfer of a PLSR model obtained by training data of one test system to test data obtained by the other test system (Fig. 4). The transfer of the model trained with JRC test data to LMT test data is shown on the left side in Fig. 4. The black circles denote the trained data points from the JRC lab and the red circles denote the untrained data points from the LMT lab. The benzene concentrations predicted by the PLSR model for the JRC data at 60 %RH still show a very small error of below 200 ppt with respect to the concentration measured by the GC-PID 955. We see two different trend lines of the predicted data points from the LMT lab. Each trend line shows a specific humidity at 10 %RH and 25 %RH. Both trend lines show a good linearity and the same slope, but also an offset to the optimal line. The transfer from the model obtained with LMT data is shown in Fig. 4 on the right. The training was performed with only a single humidity (25 %RH), as obviously the humidity compensation of the single sensor system is not sufficient. The test data from the JRC as well as the test data from the LMT show a good linearity, but also an offset to the training data. The offset is probably due to the humidity as the data with 60 %RH exhibit a negative offset, while the data with 10 %RH exhibit a positive offset.
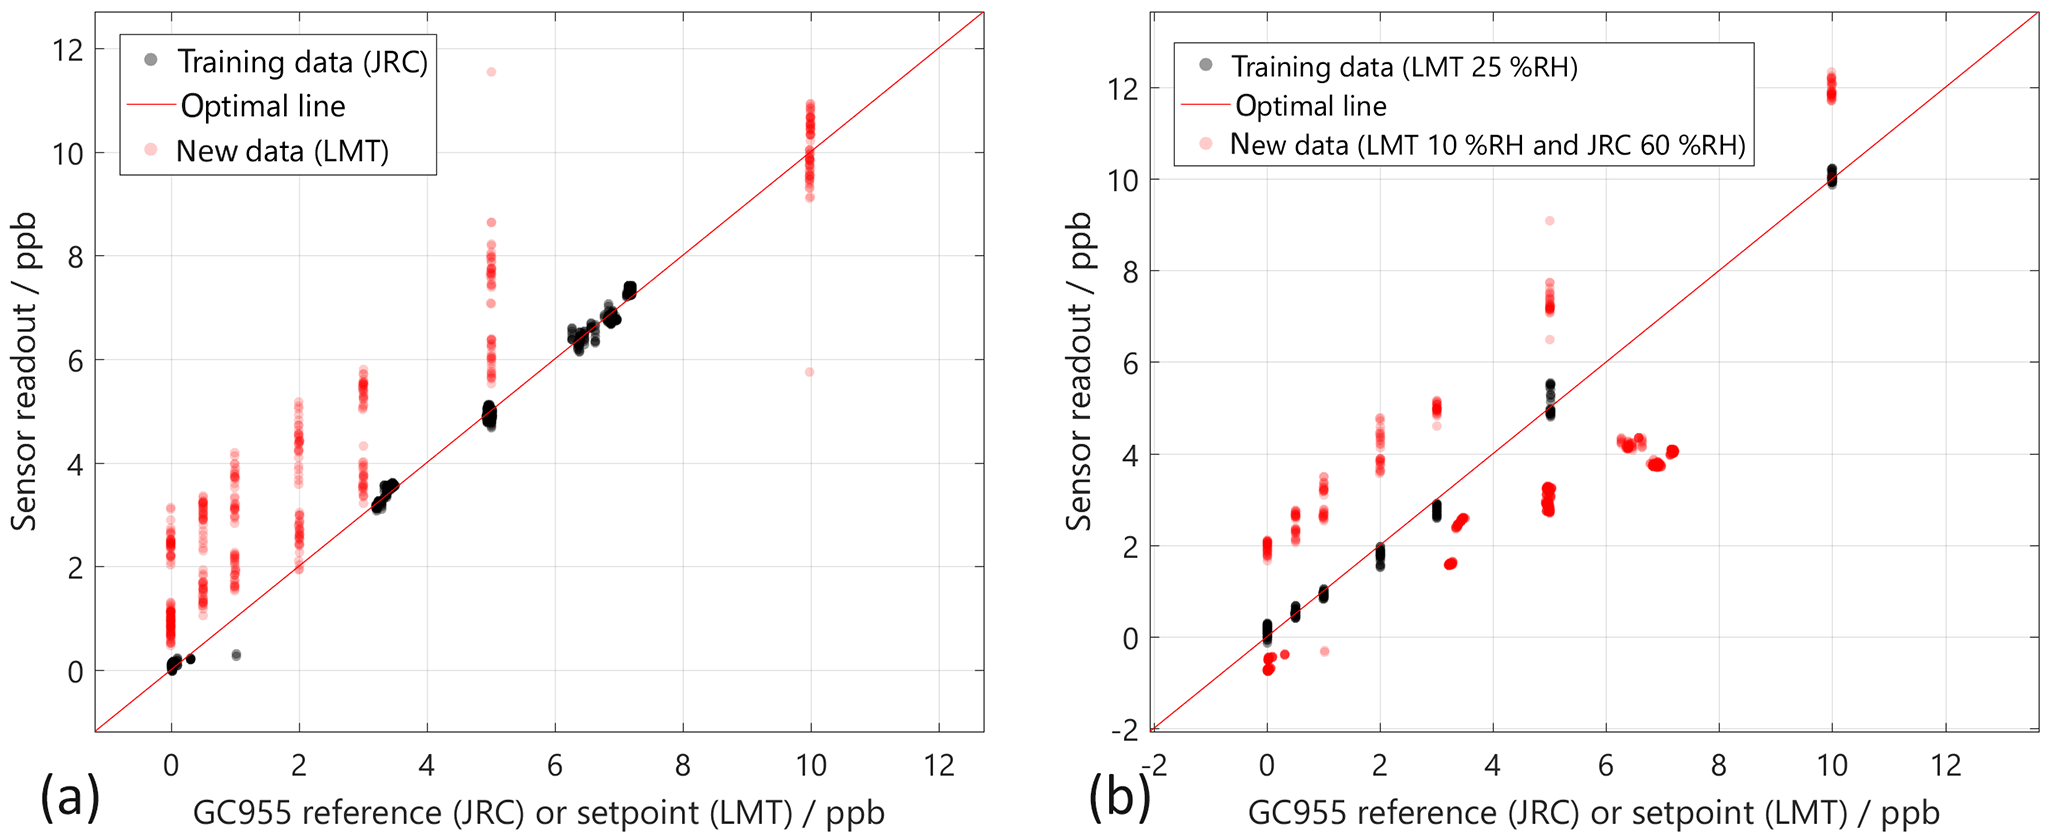
Figure 4Transfer of the PLSR model from training data of one gas mixing system to test data from another gas mixing system. (a) Training using the JRC measurement (60 %RH black solid circles) and test data from the LMT measurement (10 and 25 %RH open red circles). (b) Training using LMT measurements (25 %RH black circle) and test using the JRC data (60 %RH) and the LMT data (10 %RH). Both test data are shown in open red circles.
The presented MOS gas sensor system shows very good performance for benzene quantification, especially in pure air even with low levels of interfering toluene, including the interpolation of unknown benzene concentrations over the full humidity range tested. However, at standard air and a realistic background level of interferents, especially CO, the error of quantification is in the range of 1–2 ppb. For the environmental monitoring, especially in rural areas, even lower detection limits are needed to monitor the benzene concentration (Schneidemesser et al., 2010). A possible strategy for the further reduction of the detection limit are sensor/pre-concentrator micro systems (Leidinger et al., 2016a) and a further optimization of the sensor system electronics to reduce the noise of the signal (Baur and Schütze, 2017). For the quantification of benzene, a combination of the DSR model for feature extraction and a multilinear regression for the compensation of interferents has been tested successfully. Within the measured sensor signals all tested benzene concentrations were in good agreement with the prediction of the DSR model. The multilinear regression yields very good compensation of humidity and even toluene interference. The regression for all conditions shows a good linearity without further pre-processing of the signal; this is an advantage of the system over other TCO modes, which usually does not yield a linear signal with concentration requiring a special pre-processing before PLSR (Bastuck et al., 2015a). The system can be successfully calibrated at different labs and testing conditions, indicating that the very different methods of generating benzene yield similar levels of test gas. The transfer of a regression model from the JRC test data to the LMT test data shows good linearity of the measured benzene concentration but an offset of the response curve on the order of 2 ppb. The observed offset is probably due to the different humidity as the humidity compensation of the single-sensor system is not as good as in the three-sensor system. Moreover, a residual contamination of the GMA with VOC can contribute. Test of the VOC background of the LMT system showed that it is typically in the range of a few µg m−3 (Helwig et al., 2014), which is in the same range as the benzene concentration tested. The result demonstrates the need for the definition of common test standards for trace gas sensor systems and the high potential of those systems for the quantitative detection even of small levels of pollutants like benzene. This is an important step for the development of monitoring grids with high resolution using indicative sensor systems to increase the number of nodes strongly.
The underlying measurement data are not publicly available and can be requested from the authors if required.
The supplement related to this article is available online at: https://doi.org/10.5194/jsss-7-235-2018-supplement.
The authors declare that they have no conflict of interest.
This article is part of the special issue “Sensor/IRS2 2017”. It is a result of the AMA Conferences, Nuremberg, Germany, 30 May–1 June 2017.
The work has been funded by EMRP Joint Research Project ENV56 KEY-VOCs. The
EMRP is jointly funded by the EMRP participating countries within EURAMET and
the European Union. Some foundations, especially the set-up of the sensor
system, were laid within the SENSIndoor project (funding by the European
Union's Seventh Framework Programme for research, technological development
and demonstration under grant agreement no. 604311 is
acknowledged).
Edited by: Jens
Zosel
Reviewed by: two anonymous referees
Barsan, N. and Weimar, U.: Conduction Model of Metal Oxide Gas Sensors, J. Electroceram., 7, 143–167, https://doi.org/10.1023/A:1014405811371, 2001.
Bastuck, M., Leidinger, M., Sauerwald, T., and Schütze, A.: Improved quantification of naphthalene using non-linear Partial Least Squares Regression, in: 16th International Symposium on Olfaction and Electronic Nose, Dijon, France, 28 June–1 July 2015, 1–2, available at: http://arxiv.org/abs/1507.05834 (last access: 2 February 2018), 2015a.
Bastuck, M., Bur, C., Sauerwald, T., Spetz, A. L., Andersson, M., and Schütze, A.: Quantification of Volatile Organic Compounds in the ppb-range using Partial Least Squares Regression, Proceedings SENSOR 2015, 19–21 May 2015, Nuremberg, Germany, 584–589, https://doi.org/10.5162/sensor2015/D5.1, 2015b.
Bastuck, M., Baur, T., Schütze, A., and Sauerwald, T.: DAV3E: Data Analysis and Verification/Visualization/Validation Environment für die Multisensor-Datenfusion, 18. GMA/ITG-Fachtagung Sensoren und Messsyst. 2016, 10–11 May 2016, Nuremberg, Germany, 729–734, https://doi.org/10.5162/sensoren2016/P7.3, 2016.
Batterman, S., Chambliss, S., and Isakov, V.: NIH Public Access, Atmos. Environ., 94, 518–528, 1994.
Baur, T. and Schütze, A. T. S.: Detection of short trace gas pulses, Proc. Sens. 2017, 87–91, available at: https://www.ama-science.org/proceedings/details/2497 (last access: 2 February 2018), 2017.
Baur, T., Schütze, A., and Sauerwald, T.: Optimierung des temperaturzyklischen Betriebs von Halbleitergassensoren, Tech. Mess., 82, 187–195, https://doi.org/10.1515/teme-2014-0007, 2015.
Bernstein, J. A., Alexis, N., Bacchus, H., Bernstein, I. L., Fritz, P., Horner, E., Li, N., Mason, S., Nel, A., Oullette, J., Reijula, K., Reponen, T., Seltzer, J., Smith, A., and Tarlo, S. M.: The health effects of nonindustrial indoor air pollution, J. Allergy Clin. Immun., 121, 585–591, https://doi.org/10.1016/j.jaci.2007.10.045, 2008.
BSI: BS EN 14662-3:2015: Ambient air – Standard method for the measurement of benzene concentrations. Automated pumped sampling with in situ gas chromatography, BSI, London, UK, 2015.
Bundesanstalt für Arbeitsschutz und Arbeitsmedizin: TRGS 910: Risikobezogenes Maßnahmenkonzept für Tätigkeiten mit krebserzeugenden Gefahrstoffen, Gmbi (64), 1313, 2014.
Ding, J., McAvoy, T. J., Cavicchi, R. E., and Semancik, S.: Surface state trapping models for SnO2-based microhotplate sensors, Sensor. Actuat. B-Chem., 77, 597–613, https://doi.org/10.1016/S0925-4005(01)00765-1, 2001.
Ehhalt, D. H. and Rohrer, F.: The tropospheric cycle of H2: A critical review, Tellus, 61, 500–535, https://doi.org/10.1111/j.1600-0889.2009.00416.x, 2009.
Eicker, H.: Method and apparatus for determining the concentration of one gaseous component in a mixture of gases, US Patent 4012692A, 1977.
European Parliament and Council of the European Union: Directive 2008/50/EC of the European Parliament and of the Council of 21 May 2008 on ambient airquality and cleaner air for Europe, available at: http://eur-lex.europa.eu/legal-content/EN/TXT/?uri=OJ:L:2008:152:TOC (last access: 2 February 2018), 2008.
Gilge, S., Plass-Duelmer, C., Fricke, W., Kaiser, A., Ries, L., Buchmann, B., and Steinbacher, M.: Ozone, carbon monoxide and nitrogen oxides time series at four alpine GAW mountain stations in central Europe, Atmos. Chem. Phys., 10, 12295–12316, https://doi.org/10.5194/acp-10-12295-2010, 2010.
Gramm, A. and Schütze, A.: High performance solvent vapor identification with a two sensor array using temperature cycling and pattern classification, Sensor. Actuat. B-Chem., 95, 58–65, https://doi.org/10.1016/S0925-4005(03)00404-0, 2003.
Heimann, I., Bright, V. B., McLeod, M. W., Mead, M. I., Popoola, O. A. M., Stewart, G. B., and Jones, R. L.: Source attribution of air pollution by spatial scale separation using high spatial density networks of low cost air quality sensors, Atmos. Environ., 113, 10–19, https://doi.org/10.1016/j.atmosenv.2015.04.057, 2015.
Helwig, N., Schüler, M., Bur, C., Schütze, A., and Sauerwald, T.: Gas mixing apparatus for automated gas sensor characterization, Meas. Sci. Technol., 25, 55903, https://doi.org/10.1088/0957-0233/25/5/055903, 2014.
Hennemann, J., Sauerwald, T., Kohl, C. D., Wagner, T., Bognitzki, M., and Greiner, A.: Electrospun copper oxide nanofibers for H 2S dosimetry, Phys. Status Solidi A, 209, 911–916, https://doi.org/10.1002/pssa.201100588, 2012.
Kemmler, J. A., Pokhrel, S., Birkenstock, J., Schowalter, M., Rosenauer, A., Bârsan, N., Weimar, U., and Mädler, L.: Quenched, nanocrystalline In4Sn3O12 high temperature phase for gas sensing applications, Sensor. Actuat. B-Chem., 161, 740–747, https://doi.org/10.1016/j.snb.2011.11.026, 2012.
Lee, A. P. and Reedy, B. J.: Temperature modulation in semiconductor gas sensing, Sensor. Actuat. B-Chem., 60, 35–42, https://doi.org/10.1016/S0925-4005(99)00241-5, 1999.
Leidinger, M., Sauerwald, T., Reimringer, W., Ventura, G., and Schütze, A.: Selective detection of hazardous VOCs for indoor air quality applications using a virtual gas sensor array, J. Sens. Sens. Syst., 3, 253–263, https://doi.org/10.5194/jsss-3-253-2014, 2014.
Leidinger, M., Rieger, M., Sauerwald, T., Alépée, C., and Schütze, A.: Integrated pre-concentrator gas sensor microsystem for ppb level benzene detection, Sensor. Actuat. B-Chem., 236, 988–996, https://doi.org/10.1016/j.snb.2016.04.064, 2016a.
Leidinger, M., Huotari, J., Sauerwald, T., Lappalainen, J., and Schütze, A.: Selective detection of naphthalene with nanostructured WO3 gas sensors prepared by pulsed laser deposition, J. Sens. Sens. Syst., 5, 147–156, https://doi.org/10.5194/jsss-5-147-2016, 2016b.
Leidinger, M., Baur, T., Sauerwald, T., Schütze, A., Reimringer, W., Spinelle, L., and Gerboles, M.: Highly sensitive benzene detection with MOS gas sensors, Proc. AMA Conf. 2017, Nuremberg, Germany, 31 May–1 June 2017, 92–97, 2017.
Madou, M. J. and Morrison, S. R.: Chemical Sensing with Solid State Devices, Academic Press, San Diego, USA, 1989.
Morrison, S. R.: Semiconductor gas sensors, Sensor. Actuator., 2, 329–341, https://doi.org/10.1016/0250-6874(81)80054-6, 1981.
Nakata, S., Nakasuji, M., Ojima, N., and Kitora, M.: Characteristic nonlinear responses for gas species on the surface of different semiconductor gas sensors, Appl. Surf. Sci., 135, 285–292, https://doi.org/10.1016/S0169-4332(98)00290-6, 1998a.
Nakata, S., Ozaki, E., and Ojima, N.: Gas sensing based on the dynamic nonlinear responses of a semiconductor gas sensor: Dependence on the range and frequency of a cyclic temperature change, Anal. Chim. Acta, 361, 93–100, https://doi.org/10.1016/S0003-2670(98)00013-0, 1998b.
Sasahara, T., Kido, A., Sunayama, T., Uematsu, S., and Egashira, M.: Identification and quantification of alcohol by a micro gas sensor based on adsorption and combustion, Sensor. Actuat. B-Chem., 99, 532–538, https://doi.org/10.1016/j.snb.2004.01.002, 2004.
Schneidemesser, E. Von, Monks, P. S., and Plass-Duelmer, C.: Global comparison of VOC and CO observations in urban areas, Atmos. Environ., 44, 5053–5064, https://doi.org/10.1016/j.atmosenv.2010.09.010, 2010.
Schüler, M., Schneider, T., Sauerwald, T., and Schütze, A.: Impedance based detection of HMDSO poisoning in metal oxide gas sensors, Tech. Mess., 84, 697–705, https://doi.org/10.1515/teme-2017-0002, 2017.
Schultealbert, C., Baur, T., Schütze, A., Böttcher, S., and Sauerwald, T.: A novel approach towards calibrated measurement of trace gases using metal oxide semiconductor sensors, Sensor. Actuat. B-Chem., 239, 390–396, https://doi.org/10.1016/j.snb.2016.08.002, 2017.
Schütze, A., Baur, T., Leidinger, M., Reimringer, W., Jung, R., Conrad, T., and Sauerwald, T.: Highly Sensitive and Selective VOC Sensor Systems Based on Semiconductor Gas Sensors: How to?, Environments, 4, 20, https://doi.org/10.3390/environments4010020, 2017.
Spinelle, L., Michel, G., and Aleixandre, M.: Report of laboratory and in-situ in itu validation of micro-sensor sensor for monitoring ambient air pollution, ambient air pollution, Publication Office of the European Union, Luxembourg, https://doi.org/10.2788/4277, 2014.
Spinelle, L., Gerboles, M., Kok, G., Persijn, S., and Sauerwald, T.: Performance Evaluation of Low-Cost BTEX Sensors and Devices within the EURAMET Key-VOCs (Lv), MDPI Proceedings 2017, 1, 425, EUROSENSORS 2017, 3–6 September 2017 Paris, France, 30–33, https://doi.org/10.3390/proceedings1040425, 2017a.
Spinelle, L., Gerboles, M., Kok, G., Persijn, S., and Sauerwald, T.: Review of portable and low-cost sensors for the ambient air monitoring of benzene and other volatile organic compounds, Sensors, 17, 1520, https://doi.org/10.3390/s17071520, 2017b.
WHO Regional Office for Europe: WHO guidelines for indoor air quality: selected pollutants, Copenhagen, Denmark, 2010.
Wold, S., Sjöström, M., and Eriksson, L.: PLS-regression: A basic tool of chemometrics, Chemometr. Intell. Lab., 58, 109–130, https://doi.org/10.1016/S0169-7439(01)00155-1, 2001.