the Creative Commons Attribution 4.0 License.
the Creative Commons Attribution 4.0 License.
 | 24 Jan 2018
Single-sided NMR for the measurement of the degree of cross-linking and curing
Norbert Halmen
Christoph Kugler
Eduard Kraus
Benjamin Baudrit
Thomas Hochrein
Martin Bastian
The degree of cross-linking and curing is one of the most important values concerning the quality of cross-linked polyethylene (PE-X) and the functionality of adhesives and resin-based components. Up to now, the measurement of this property has mostly been time-consuming and usually destructive. Within the shown work the feasibility of single-sided nuclear magnetic resonance (NMR) for the non-destructive determination of the degree of cross-linking and curing as process monitoring was investigated. First results indicate the possibility of distinguishing between PE-X samples with different degrees of cross-linking. The homogeneity of the samples and the curing kinetics of adhesives can also be monitored. The measurements show good agreement with reference tests (wet chemical analysis, differential scanning calorimetry, dielectric analysis). Furthermore, the influence of sample temperature on the characteristic relaxation times can be observed.
- Article
(6282 KB) -
Supplement
(26952 KB) - BibTeX
- EndNote


1.1 Cross-linking and curing
Cross-linking of commodity plastics is a common method to achieve mechanical, thermal and chemical properties comparable to those of high-performance polymers (Osswald et al., 2006). Cross-linked polyethylene (PE-X) and polyamide hold the biggest market share. Moreover, the market segments of thermoset injection molding, fiber reinforced composites and resin-based adhesives are steadily growing. Although processing time in the production of cross-linked polymers is continuously decreasing, the degree of cross-linking/curing is usually measured in the laboratory by wet chemical analysis according to DIN EN ISO 10147 (Heiduk et al., 2015). Relatively long measurement times for a quantitative result and the destructive character of these standard test methods inhibit a 100 % process monitoring. There are already initial efforts to realize process measurements by other methods, such as rheological tests (Heiduk et al., 2015).
The radicals necessary for the cross-linking of PE can be generated either by the use of special additives and energy input (PE-Xa/Xb/Xd) or radiation (PE-Xc). For resins and adhesives the reaction is started by adding the curing agent or the necessary activation energy.
1.2 Single-sided NMR
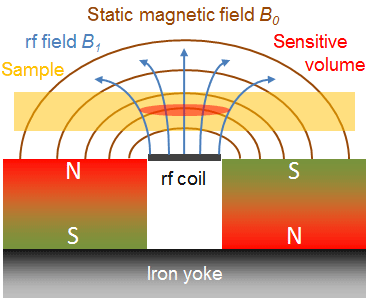
An innovative approach to overcome the drawback of destructive testing is provided by the NMR technique with test systems for a single-sided access. Such devices with inhomogeneous stray fields and specially adapted radiofrequency (rf) resonators can be used for NMR relaxometry (Blümich et al., 1998). Several magnets are arranged in a way that the magnetic field B0 is parallel to the surface at a fixed position above the rf coil. The samples to be tested are placed or moved through this so-called sensitive volume. This is schematically shown in Fig. 1.
1.3 Principles of NMR relaxation
The loss of nuclear magnetization is known as relaxation. The two main reasons are the dissipation of energy from the spin system to the molecular environment and the coherence loss of a high quantity of precessing spins. Within the formalism of the Bloch equations (Bloch, 1946), for systems with spin 1∕2, these two processes are described by the relaxation times T1 for longitudinal (or spin–lattice) relaxation and T2 for transverse (or spin–spin) relaxation, respectively:
with the gyromagnetic ratio γ, the magnetic field B, and the magnetization M. For spin systems of higher order there are further relaxation times. Spin interactions as well as the timescale and geometry of molecular motion determine the relaxation times in a certain spin system (Bloembergen et al., 1948). Therefore relaxation times and their variations are adequate indicators for the state of a material when compared with a reference.
In the case of polymers, mainly the transverse relaxation time (T2) of the sample is crucial. This parameter is influenced by the molecular motion of the polymer chains and therefore sensitive to the physical environment of the studied molecule. Due to cross-linking the degrees of freedom of molecules in amorphous regions are reduced by the formation of a network and a change in relaxation times occurs. The feasibility of correlating NMR relaxation with the degree of cross-linking and curing has already been shown (Dole, 1979; Fry and Lind, 1988; Hirabayashi et al., 2013; Netto, 2014).
1.4 Relaxation times and echo sums
In the given measurement geometry the observation of the free induction decay is not possible since the relaxation times of most polymers are shorter than the dead time of the rf coil.
To measure the transverse relaxation by single-sided NMR, spin echoes are generated which refocus the magnetization dephasing caused by inhomogeneities of the magnetic fields. For systems with spin 1∕2 a single echo can be generated by applying two rf pulses as in the echo sequence given by Hahn (1950). Instead of applying several single echoes with different echo times to get the transverse magnetization through the attenuation of the echo maxima, a multi-echo sequence is used. The commonly used multi-echo train is the CPMG sequence named after Carr and Purcell (1954) plus Meiboom and Gill (1958). It uses short echo times and allows the measurement of multiple echo maxima at different echo times in a single shot. The magnetization is given by Eq. (2):
where M0 is the magnetization at thermal equilibrium.
However, since the magnetic field is not perfectly homogeneous, the relaxation time T2 is actually an effective relaxation time T2eff because of off-resonance effects and flip angle variations in the inhomogeneous B0 and B1 (applied by rf coil) fields (Blümich et al., 1998). This is represented by Eq. (3):
with the varying field ΔB0. For simplicity only T2 instead of T2eff will be used in the further text.
The transverse relaxation of semi-crystalline polymers can be described by two components, a rapidly relaxing one deriving from crystalline and rigid amorphous areas and a slowly relaxing one from mobile amorphous regions (Blümich et al., 2005). The measurement signals can be fitted by
Another way to get suitable information is the use of echo sums (Blümich et al., 2008), also known as cumulative binning. The signal can be approximated by a sum of exponential functions
The echo sum is proportional to the signal integral which, after normalization of s(t), represents an amplitude-weighted average of the relaxation time T2 (Blümich et al., 2008):
where wi are the relative amplitudes of the components.
The longitudinal relaxation time T1 can be measured by the saturation recovery sequence following Markley et al. (1971):
Stable magnet and sample temperatures are important for the reproducibility of the measurements. On the one hand the relaxation times (T1 and T2) of plastics are strongly influenced by temperature and on the other hand the position of the sensitive volume varies with the temperature of the magnet.
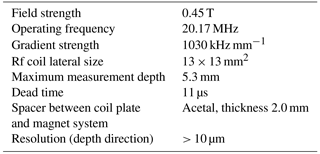
Table 1Specifications of the used NMR-Mouse PM5 by Magritek GmbH.

2.1 Measurement setup
A commercially available single-sided NMR system, the NMR-Mouse (Mobile Universal Surface Explorer) PM5 by Magritek GmbH, was used to test the capability of this technique to quantify the degree of cross-linking and curing within short measurement times while delivering depth information. Important specifications are given in Table 1. The magnetic system was used in combination with the spectrometer Kea2, also a product from Magritek GmbH. The complete measurement setup is shown in Fig. 2.
To perform depth-resolved measurements in different depth positions, the samples were placed on polymethylmethacrylate (PMMA) plates with different thicknesses and a cut-out for the rf coil. Moreover, cover glasses with 100, 150, 200, and 500 µm thickness were used to achieve different measurement depths. The sample temperature was monitored using a hand-held IR thermometer. For the measurement setup, care was taken to minimize the external disturbances (metal, power lines, radio sources with a similar frequency to the measuring frequency) as well as possible.


2.2 Sample materials
Within this work samples of PE-Xa and PE-Xc with different degrees of cross-linking were investigated. For the manufacturing of the PE-Xa samples, PE-HD (Borealis BorPEX HE1878E) with a varying amount of peroxide (AkzoNobel Trigonox 145-E85) was extruded into a mold and pressed to sheets. The PE-Xc samples (Sabic HDPE M40053SE) were first pressed to sheets and afterwards cross-linked via electron radiation by BGS Beta-Gamma-Service GmbH & Co. KG. Due to the different processing procedures the PE-Xa and PE-Xc samples differ in their crystallinity. During the processing of PE-Xa fewer crystalline areas can form because of the cross-linked amorphous areas. In contrast the PE-Xc samples show typical crystallinities since the cross-linking of the amorphous regions happens in solid state. For the NMR measurements different positions were used. These are given in Fig. 3 for the PE-Xa samples and Fig. 4 for the PE-Xc samples.
Additionally, the curing behavior of selected resins (epoxy (EP) resin and unsaturated polyester (UP) resin from LAMILUX Heinrich Strunz Holding GmbH & Co. KG) and a two-component (2C) adhesive (DELO-DUOPOX AD840 from DELO Industrie Klebstoffe GmbH & Co. KGaA) was investigated. The systems were mixed according to the recommendation given by the manufacturer and observed until they were fully cured. For the NMR measurements the adhesive was mixed within a paper cup, which was positioned directly on the NMR-Mouse, so that the sensitive volume was within the adhesive. The curing times for the 2C adhesive at room temperature (23 ∘C) and 80 ∘C are given by the data sheet. Firmness to touch is reached after 7 h (23 ∘C) or 13 min (80 ∘C) and functional strength is achieved after 16 h (23 ∘C) or 20 min (80 ∘C).
Since the resin samples were heat activated in a heating furnace from 60 to 80 ∘C, the use of paper cups was not practicable anymore. Therefore the resin samples were placed in small sample cups made of polypropylene (PP) with no measurable NMR signal contribution. They were also placed directly on the rf coil immediately after they were taken out of the furnace. For the resin systems only estimated values for curing times at certain temperatures were provided.
2.3 Reference methods
To allow a quantification of the degree of cross-linking, the standard wet chemical analysis was used for the PE-X samples. It was carried out according to DIN EN ISO 10147 (2013). PE-X flakes were weighted and cooked in xylene for 8 h. Afterwards they were dried for at least 3 h and the remaining material was weighted again. The degree of cross-linking DX was determined with Eq. (8):
Differential scanning calorimetry (DSC) was the method of choice to measure the crystallinity of the PE-X samples and also the curing state of the adhesive and resin systems at room temperature and certain times. The DSC experiments were carried out using a NETZSCH DSC 204 F1 Phoenix with standard sample pans. For the measurements two heat cycles were performed with different parameter settings for each material (PE-X: temperature range from 23 to 170 ∘C, heating and cooling rate 10 K min−1; resins/adhesive: 25 to 220 ∘C, heating rate 10 K min−1, cooling rate 2 K min−1).
Finally, dielectric analysis (DEA) allows the monitoring of the curing process of the resin and adhesive samples. A NETZSCH DEA 288 Epsilon with disposable IDEX sensors was used. The ion viscosity and loss factor were measured at different temperatures and frequencies of 1 Hz, 10 Hz, 100 Hz and 1 kHz.
3.1 Degree of cross-linking of PE-X
The wet chemical analysis showed that the degree of cross-linking of PE-Xa increases with a higher amount of peroxide and, in the case of PE-Xc, a higher energy dose. Taking into account the manufacturing process of the PE-Xa samples, a certain inhomogeneity was expected and confirmed in the form of high relative errors.
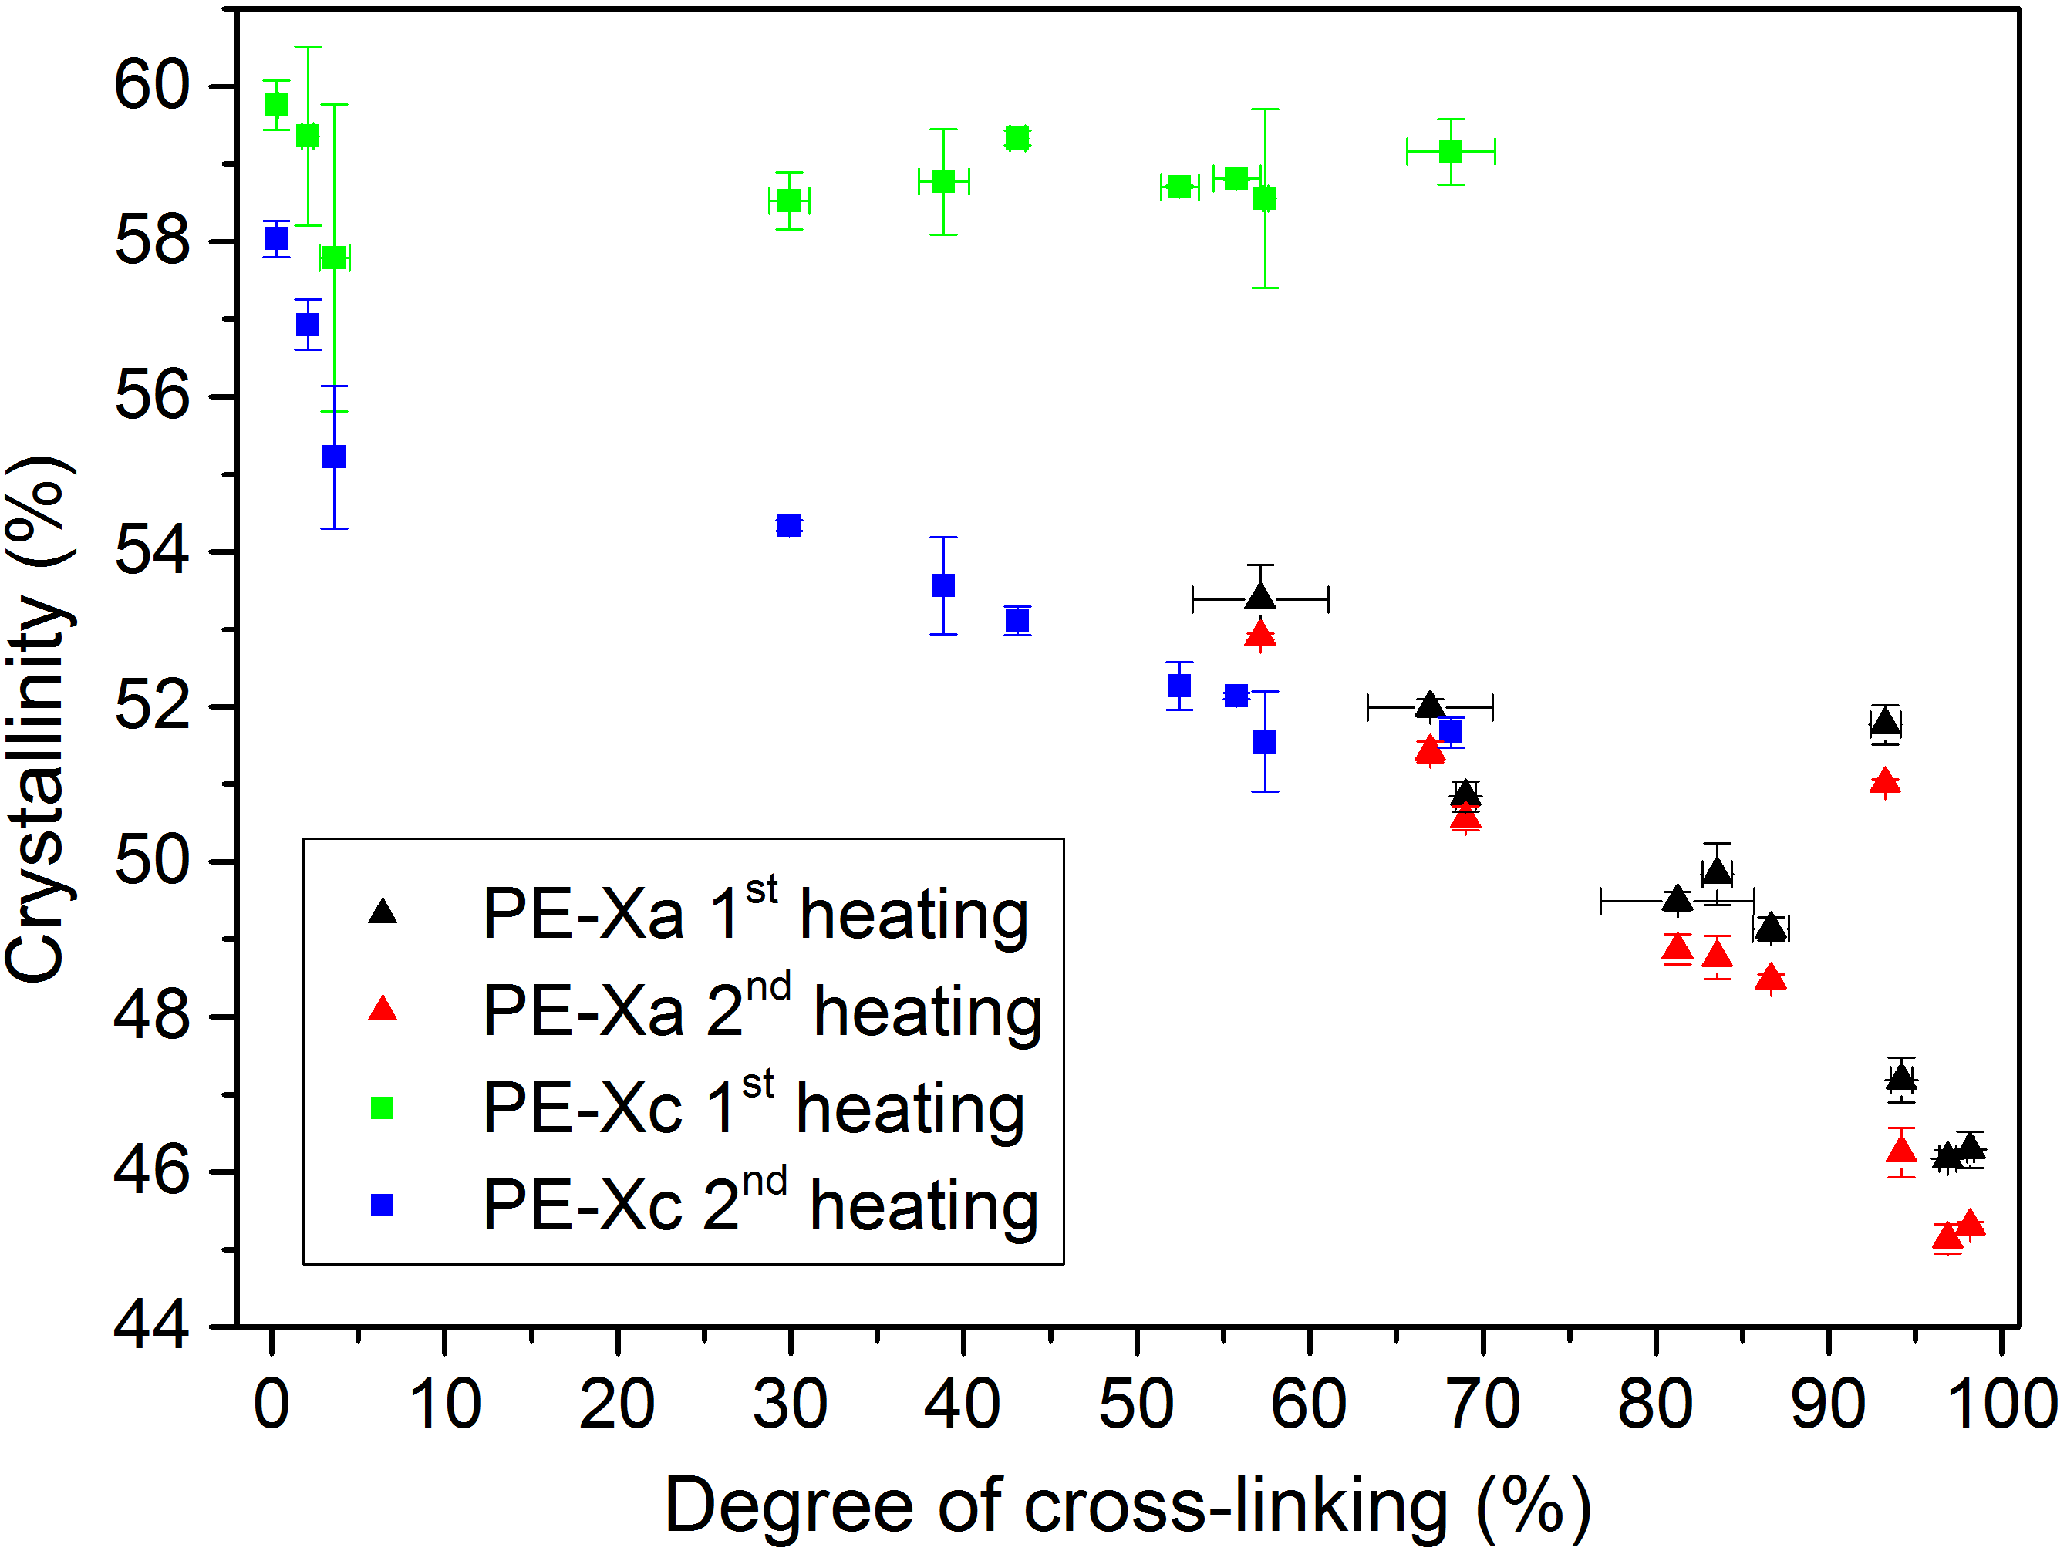
The DSC measurements showed that the crystallinity of PE-X samples decreases with an increasing degree of cross-linking, which is illustrated in Fig. 5. It was also possible to differentiate between the used PE-Xa and PE-Xc samples in the first heating, since PE-Xc samples showed a nearly constant crystallinity because of their manufacturing process. This effect vanishes in the second heating after the crystalline areas have been molten and cannot form again because of the cross-linked amorphous regions like in the PE-Xa case.
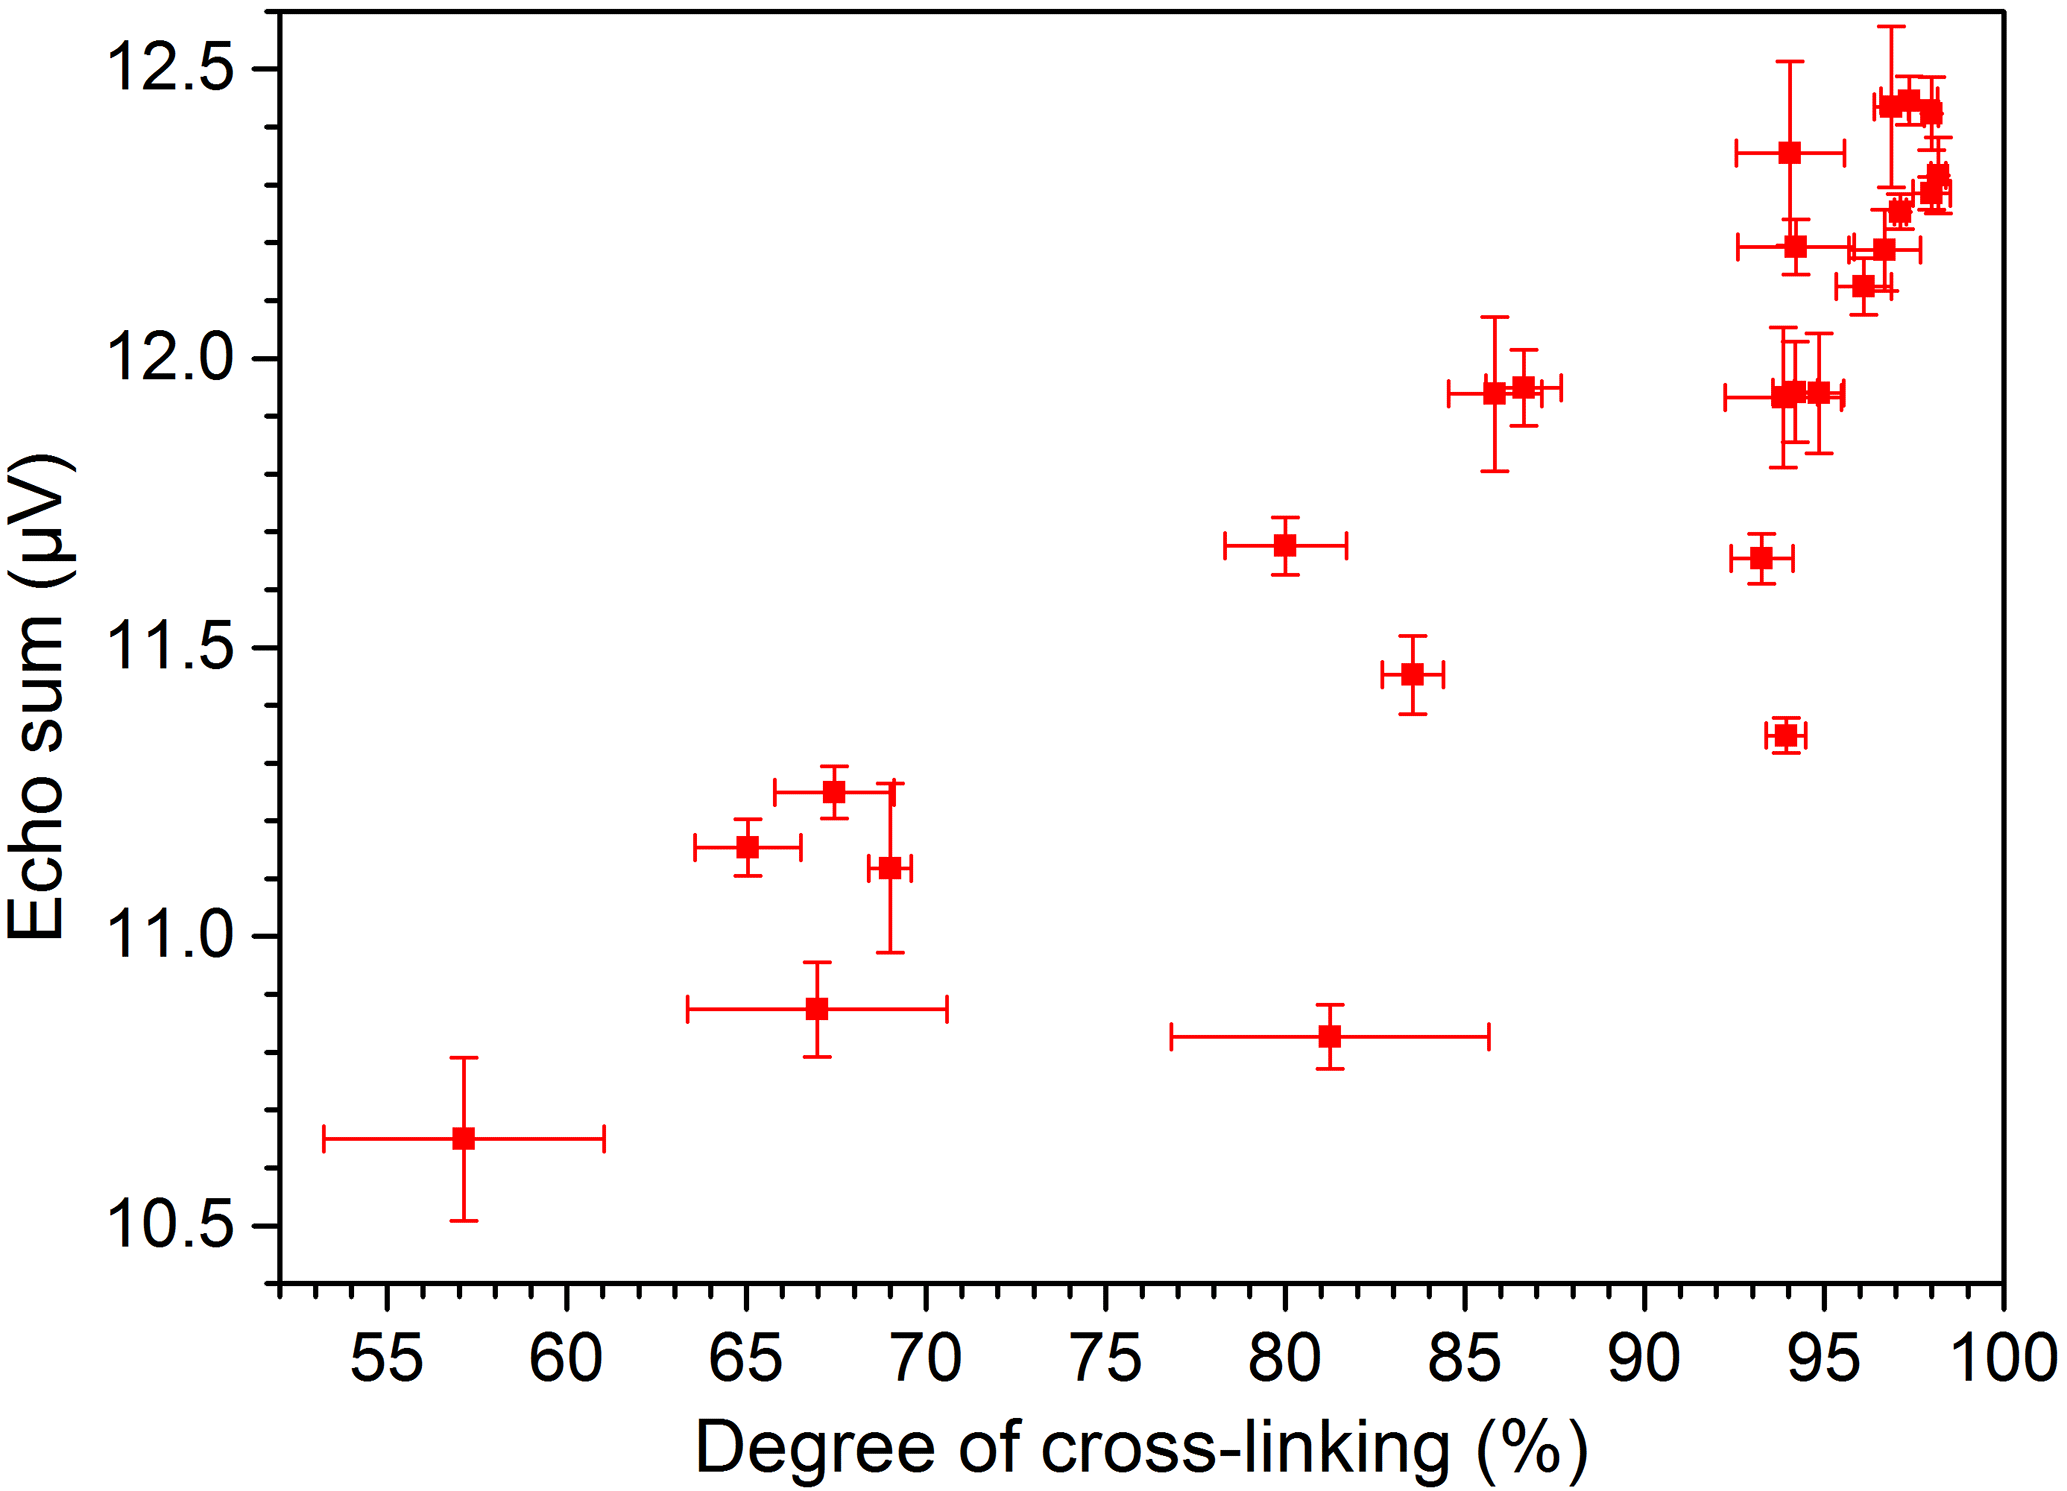
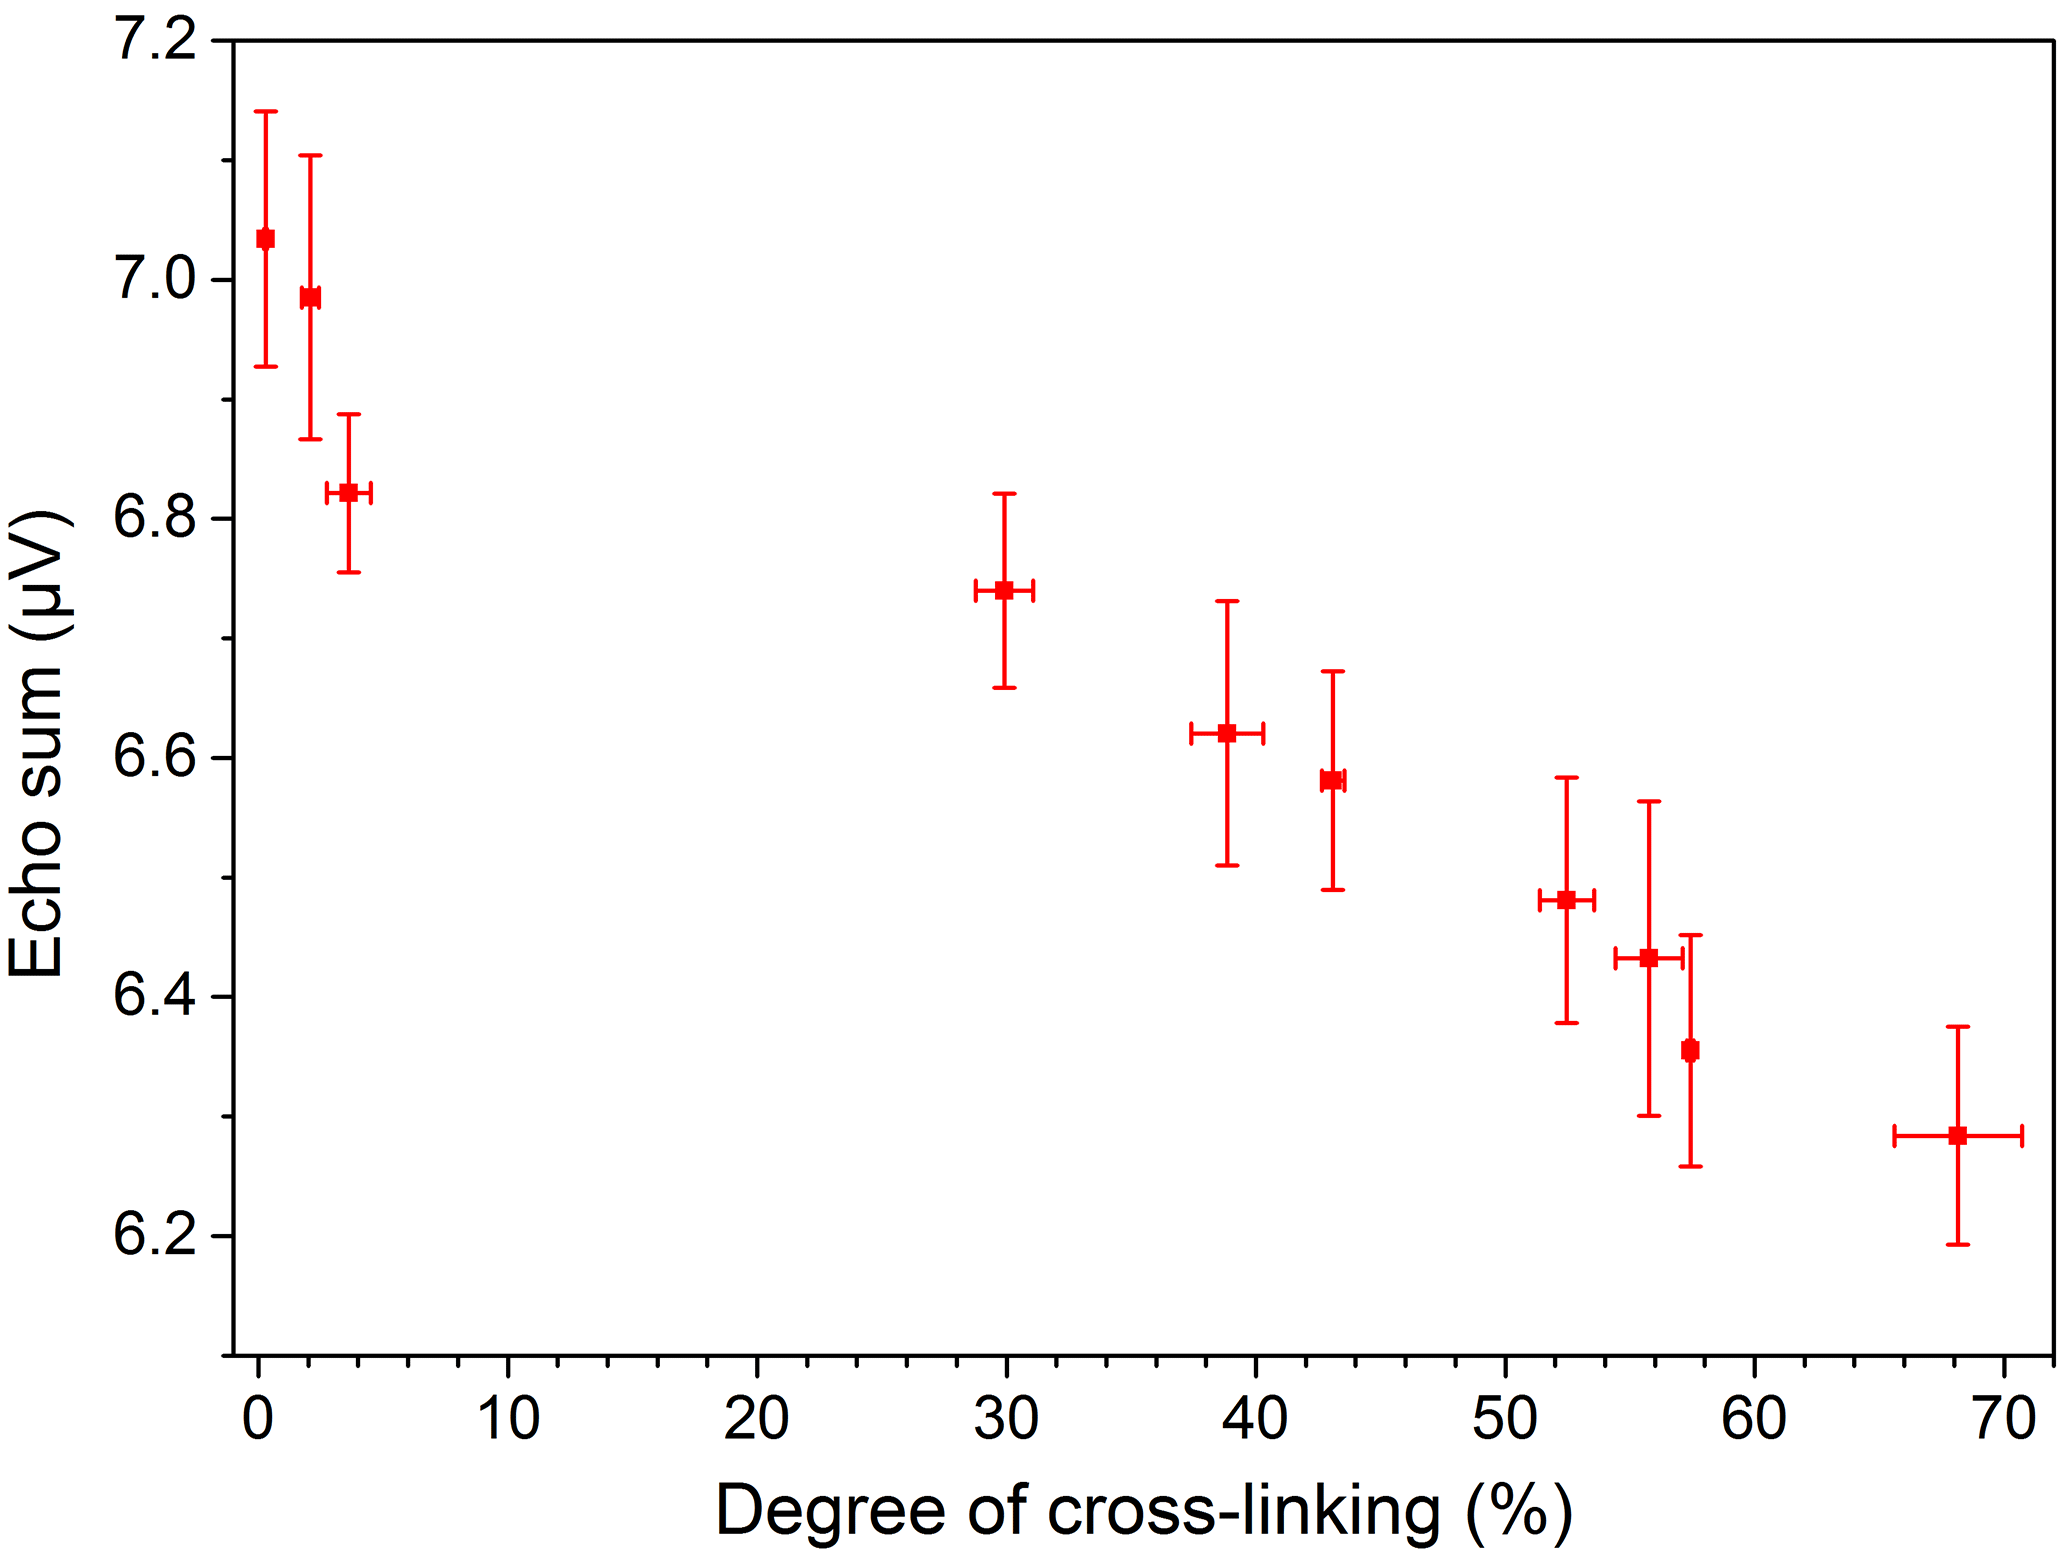
The measurements with the NMR-Mouse were conducted with CPMG pulse sequences at room temperature. The results were fitted with the bi-exponential function given by Eq. (4). This non-restricted four-parameter fit allows many different solutions with the same result for relatively short T2 times of the PE-X samples. Therefore the more robust echo sum method, non-normalized in the first step, was used. The echo sums of PE-Xa and PE-Xc samples with different degrees of cross-linking are given in Figs. 6 and 7, respectively. The error bars are each based on three measurements of the same sample at the same position. It can be clearly seen that the echo sums of the two PE-X types show different trends for increasing degrees of cross-linking. Generally, a decreasing echo sum would be expected since the cross-linking decreases the mobility of the polymer chains. For the PE-Xa samples the high number of amorphous regions affects the measurement, since the measurable signals are mainly received from the amorphous regions. This effect seems to be stronger than the signal decrease based on the increased cross-linking. Correlating the degree of cross-linking with the echo sum, the accuracy for a prediction may be possible in steps from 10 to 20 %, which is comparable to the results shown by Netto (2014).
The scattering of the results for PE-Xa may originate in the inhomogeneity of the samples. This effect was also determined when examining the general homogeneity of the samples at different lateral positions with the same measurement depth located in the center of the bulk. As shown by Fig. 8 the values measured at different locations differ over a wide range for some of the samples, which confirm the expected inhomogeneity of the used PE-Xa samples. When measuring depth profiles with distance steps of 200 µm throughout the samples at center position, comparable results are yielded. This can be seen in Fig. 9. Moreover, the signal loss when the sample is not completely covering the sensitive volume can be observed.
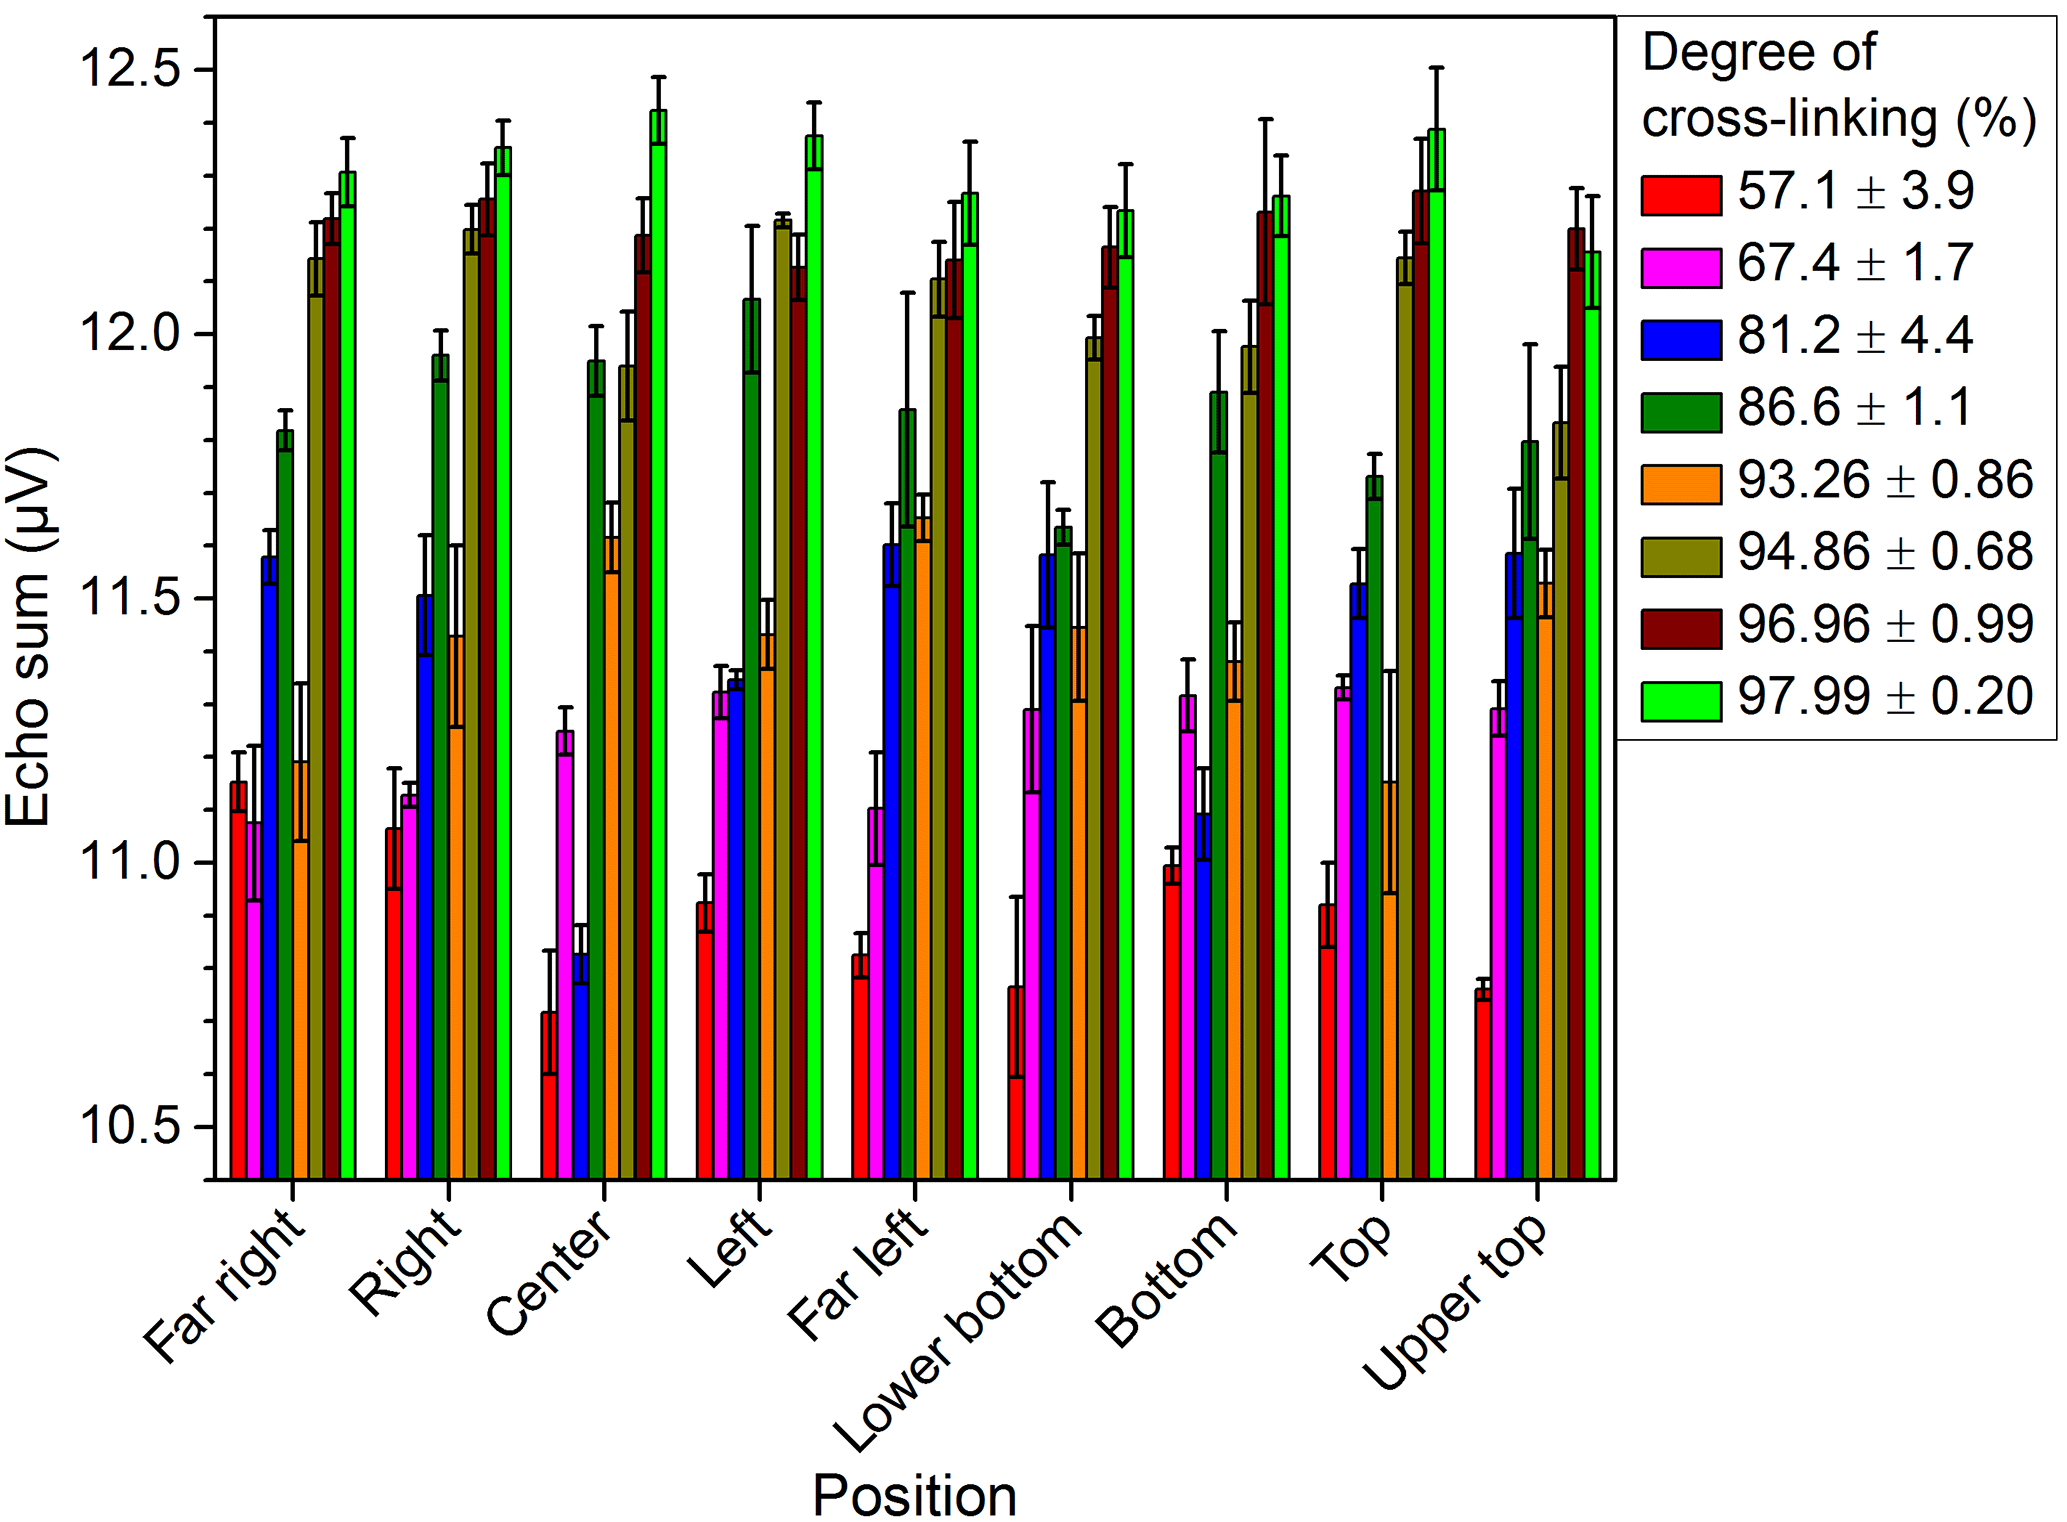
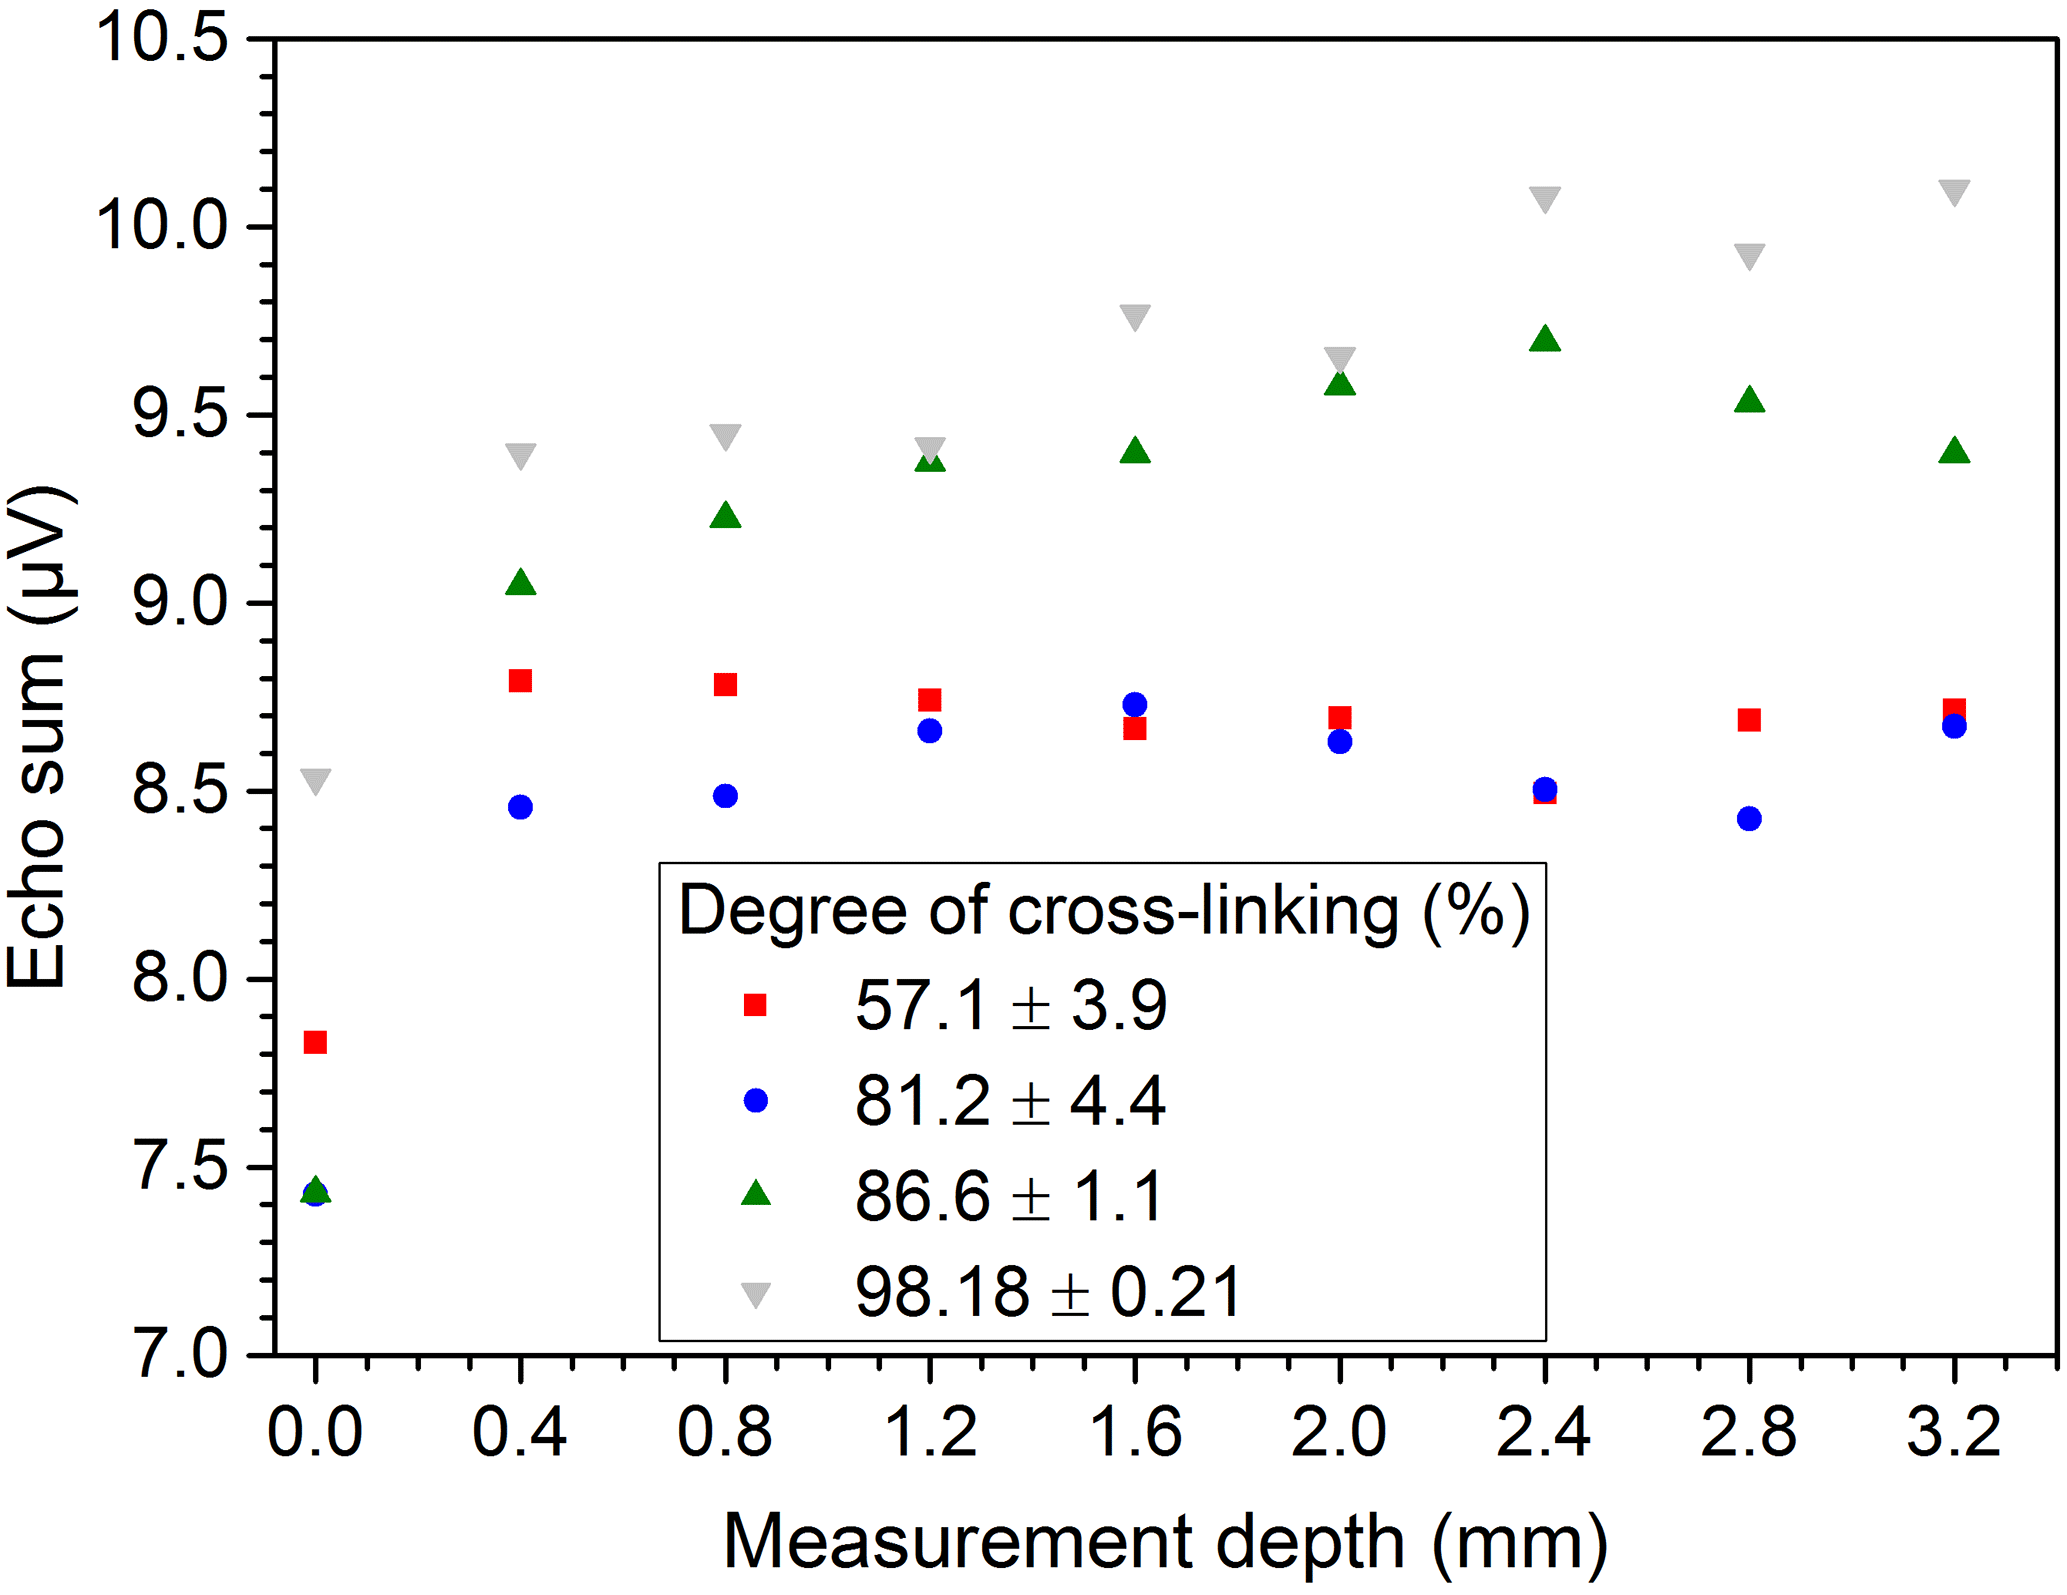
Figure 9Depth profiles of PE-Xa samples with different degrees of cross-linking measured in the center.
The PE-Xc samples show comparable values for the echo sum of different measurement positions. This is exemplarily shown in Fig. 10 for three different positions. Moreover, the equable homogeneity in the depth direction was verified by depth profiles. The results of three different PE-Xc samples measured at center position are depicted in Fig. 11.
In general, taking into account that for the depth profiles only single measurements were conducted and assuming a slight displacement of the lateral measurement position and also an uncertainty of glass spacer thickness (±20 µm), the deviation of the measured echo sums in the depth direction is on the same order (about 0.2 µV) as for the measurements in the lateral direction.
3.2 Curing of adhesives and resins
When monitoring the curing of resin samples with DSC, an exothermal peak can be measured during the first heating. The peak area decreases with increasing curing of the sample. Figure 12 exemplarily shows the results of the EP resin and the 2C adhesive which were cured at room temperature. In general this is a good indication for evaluating the degree of curing.
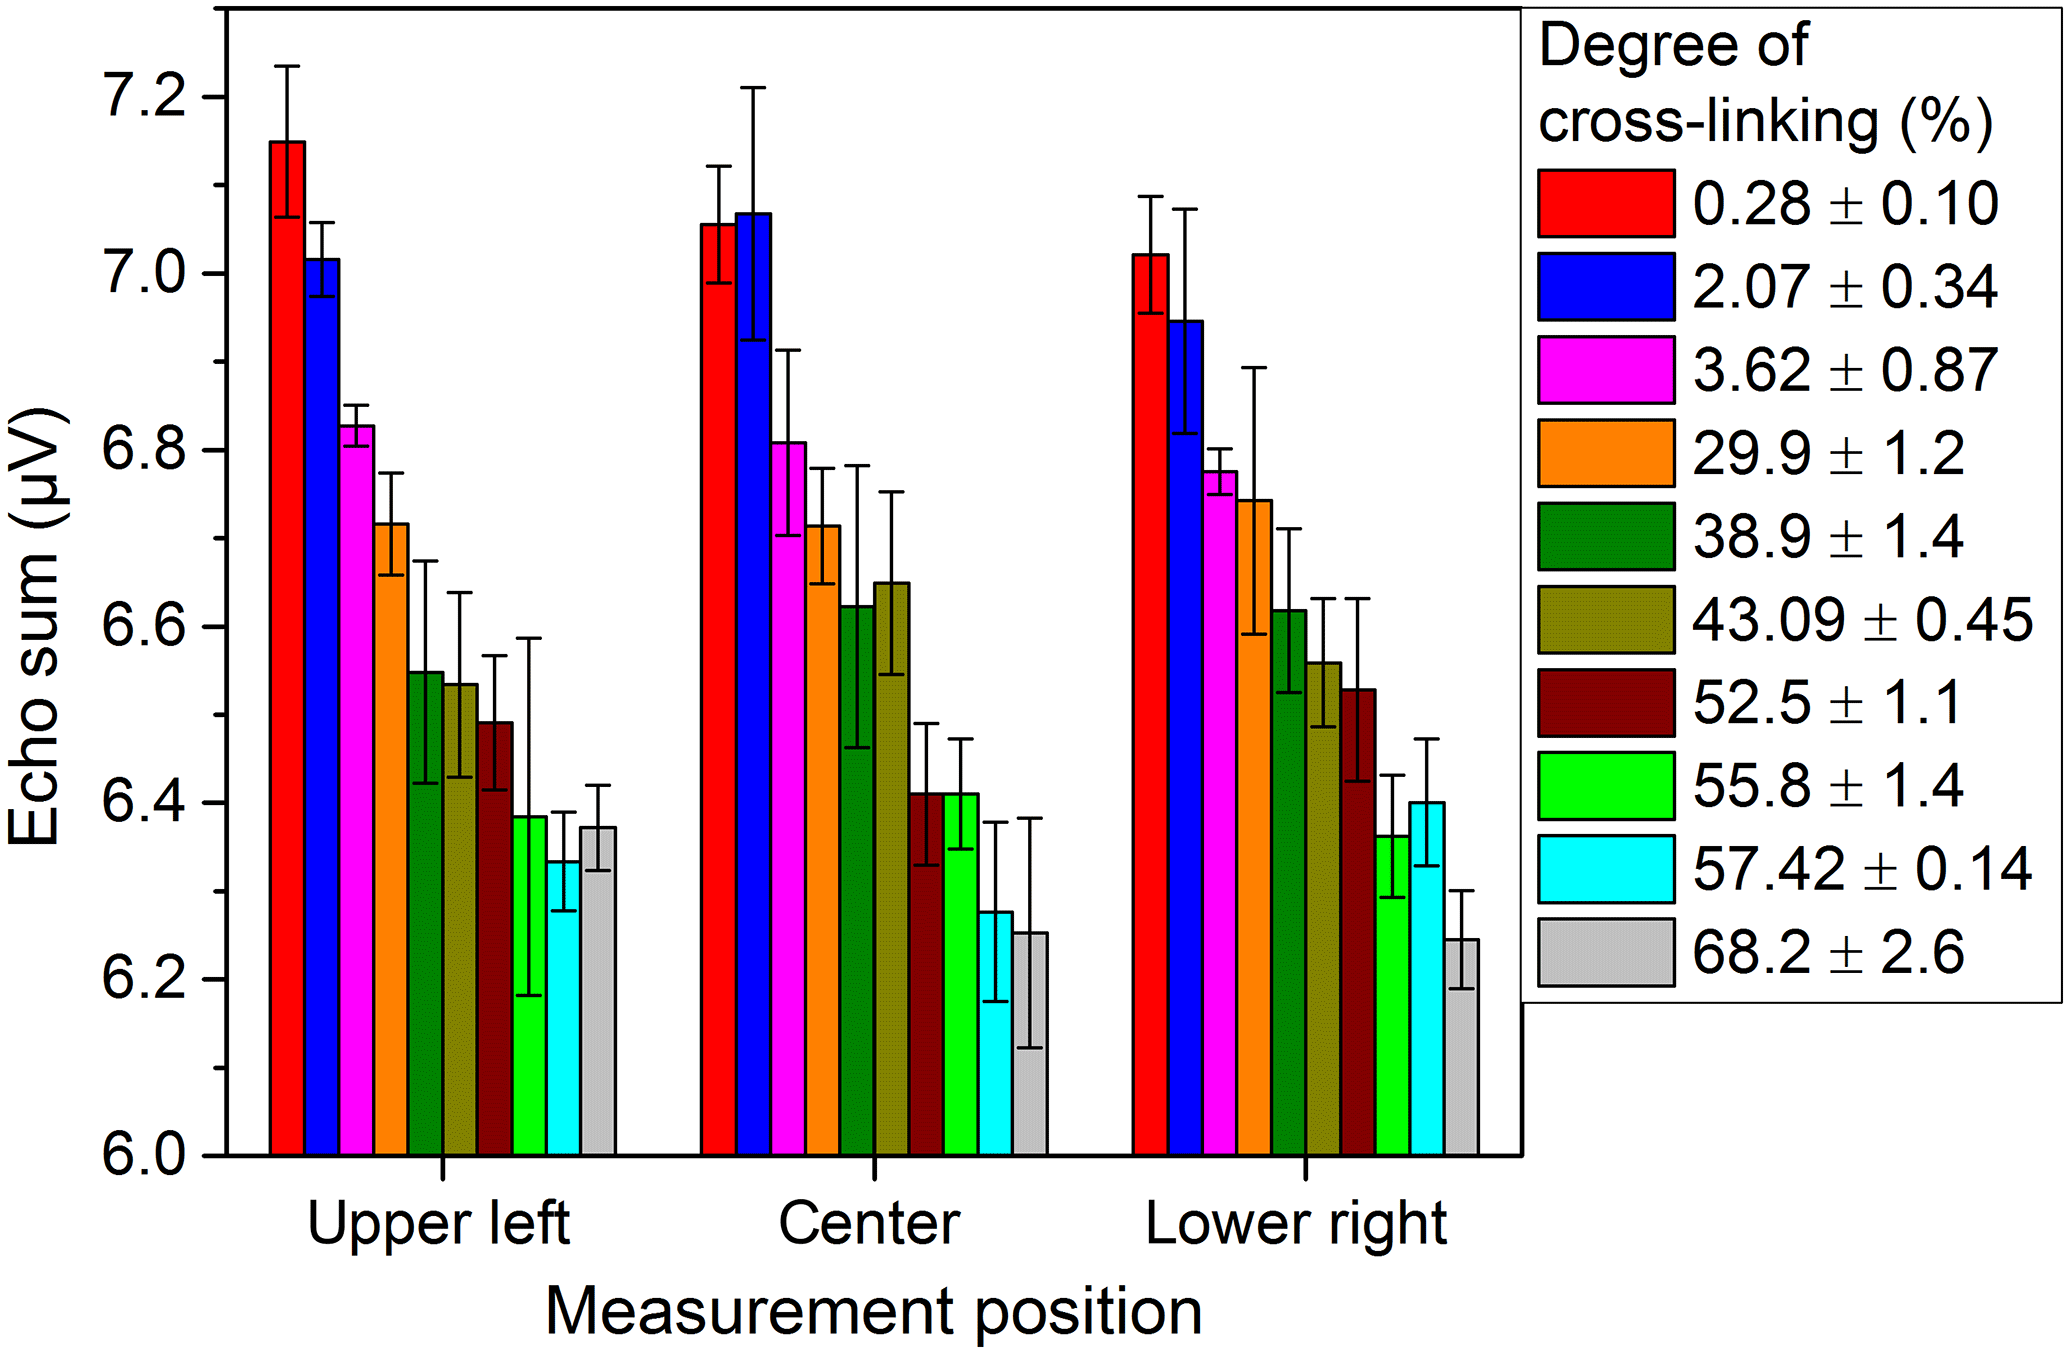
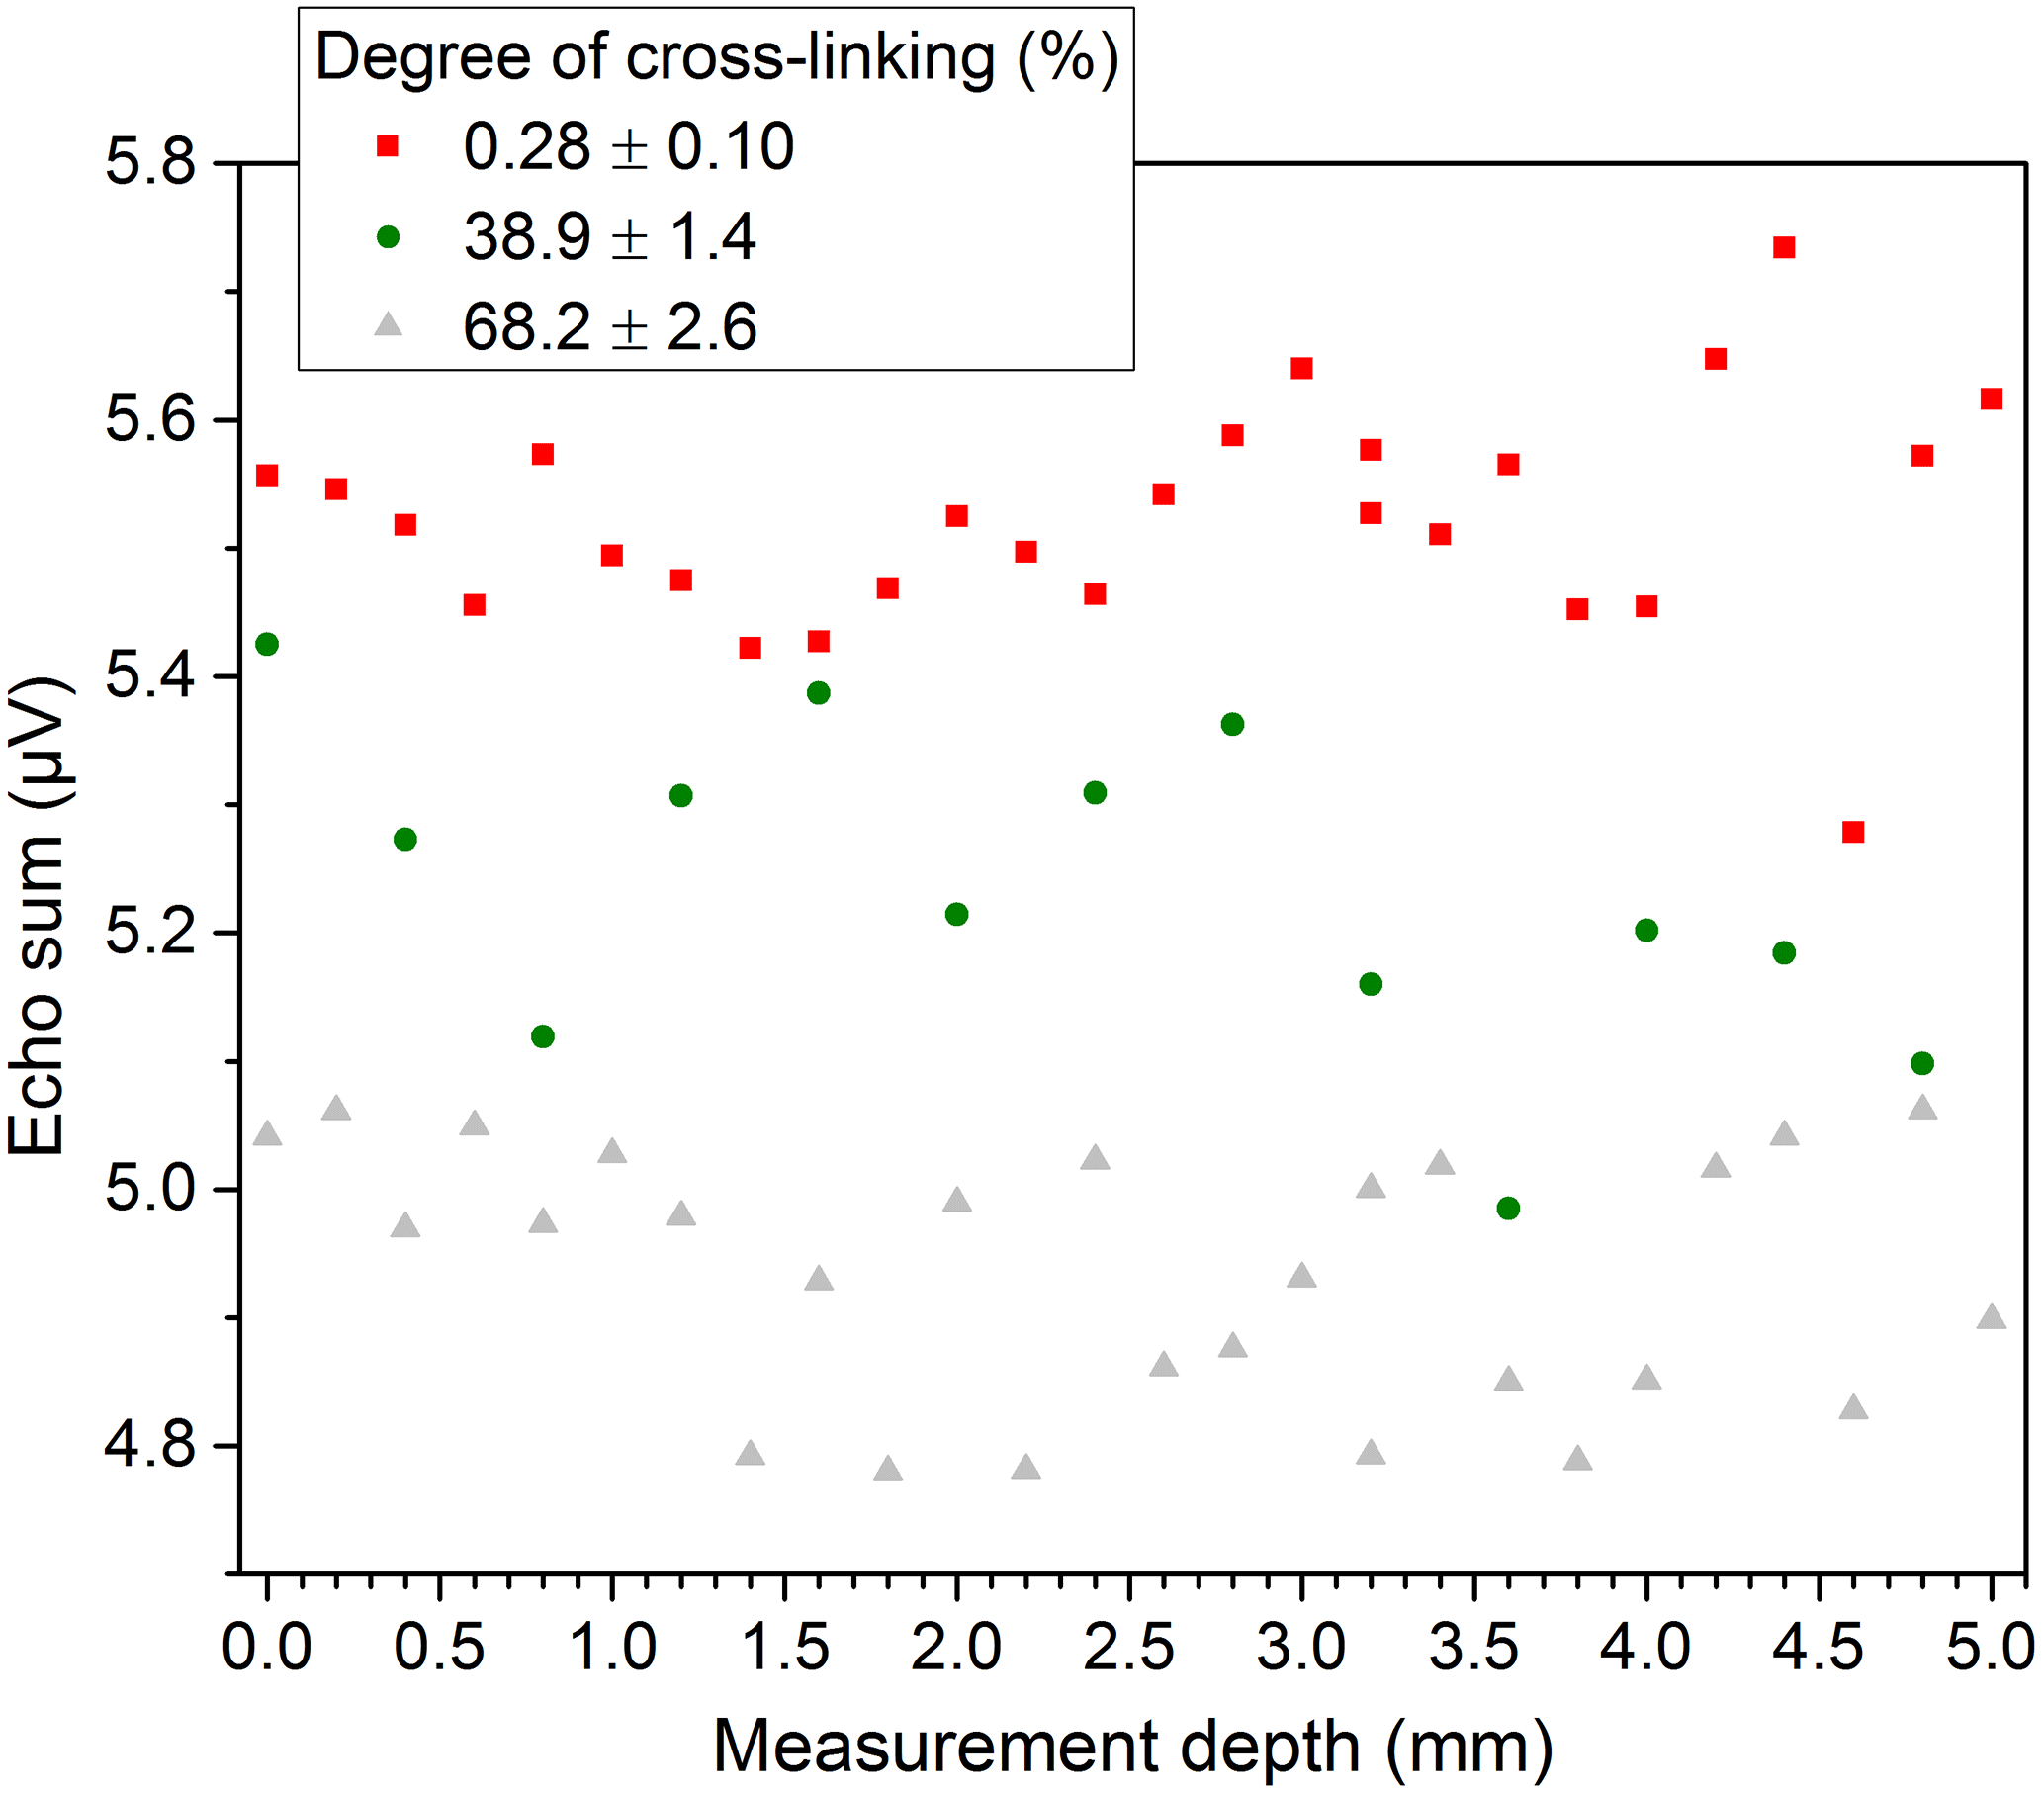
Figure 11Depth profiles of PE-Xc samples with different degrees of cross-linking measured in the center.
In theory, in DEA measurements the ion viscosity reaches a plateau when the sample is completely cured. However, the time for reaching the plateau depends on the amount of material covering the IDEX sensor, the temperature as well as the used frequency. Therefore the curing times given by the material manufacturer are merely vague guide values. In Fig. 13 the ion viscosity measurements of the used 2C adhesive cured at 80 ∘C are illustrated, and Fig. 14 shows the corresponding loss factor.
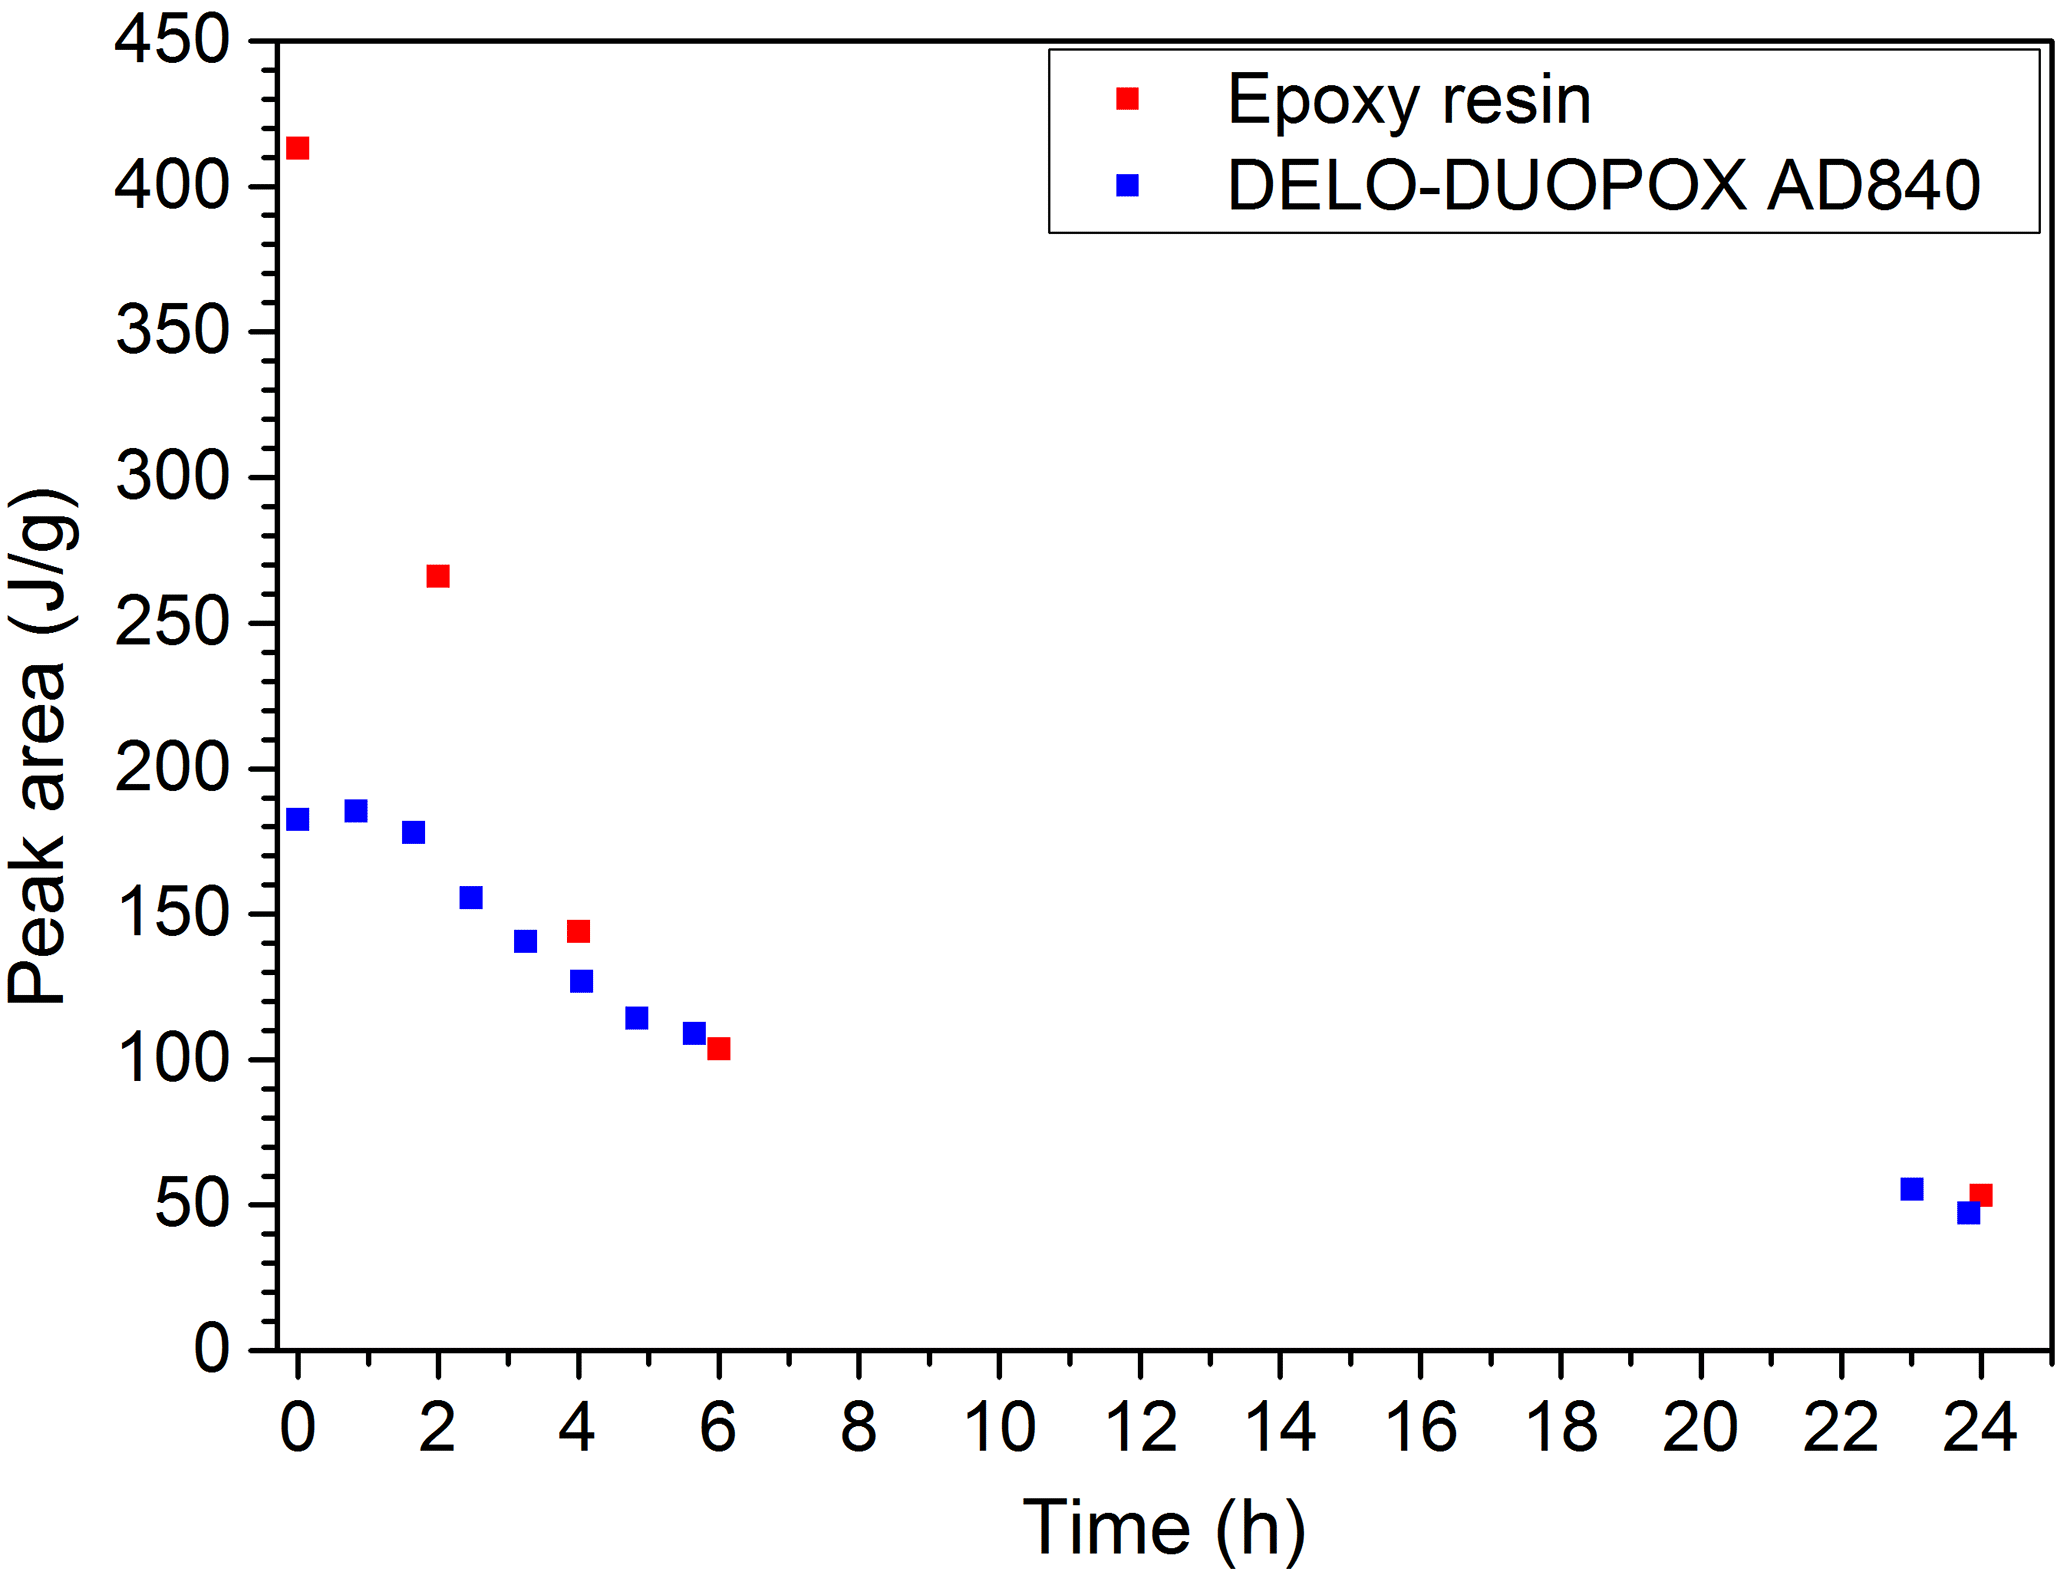
Figure 12DSC measurement of EP resin and the 2C adhesive (DELO-DUOPOX AD840) cured for different times at room temperature.
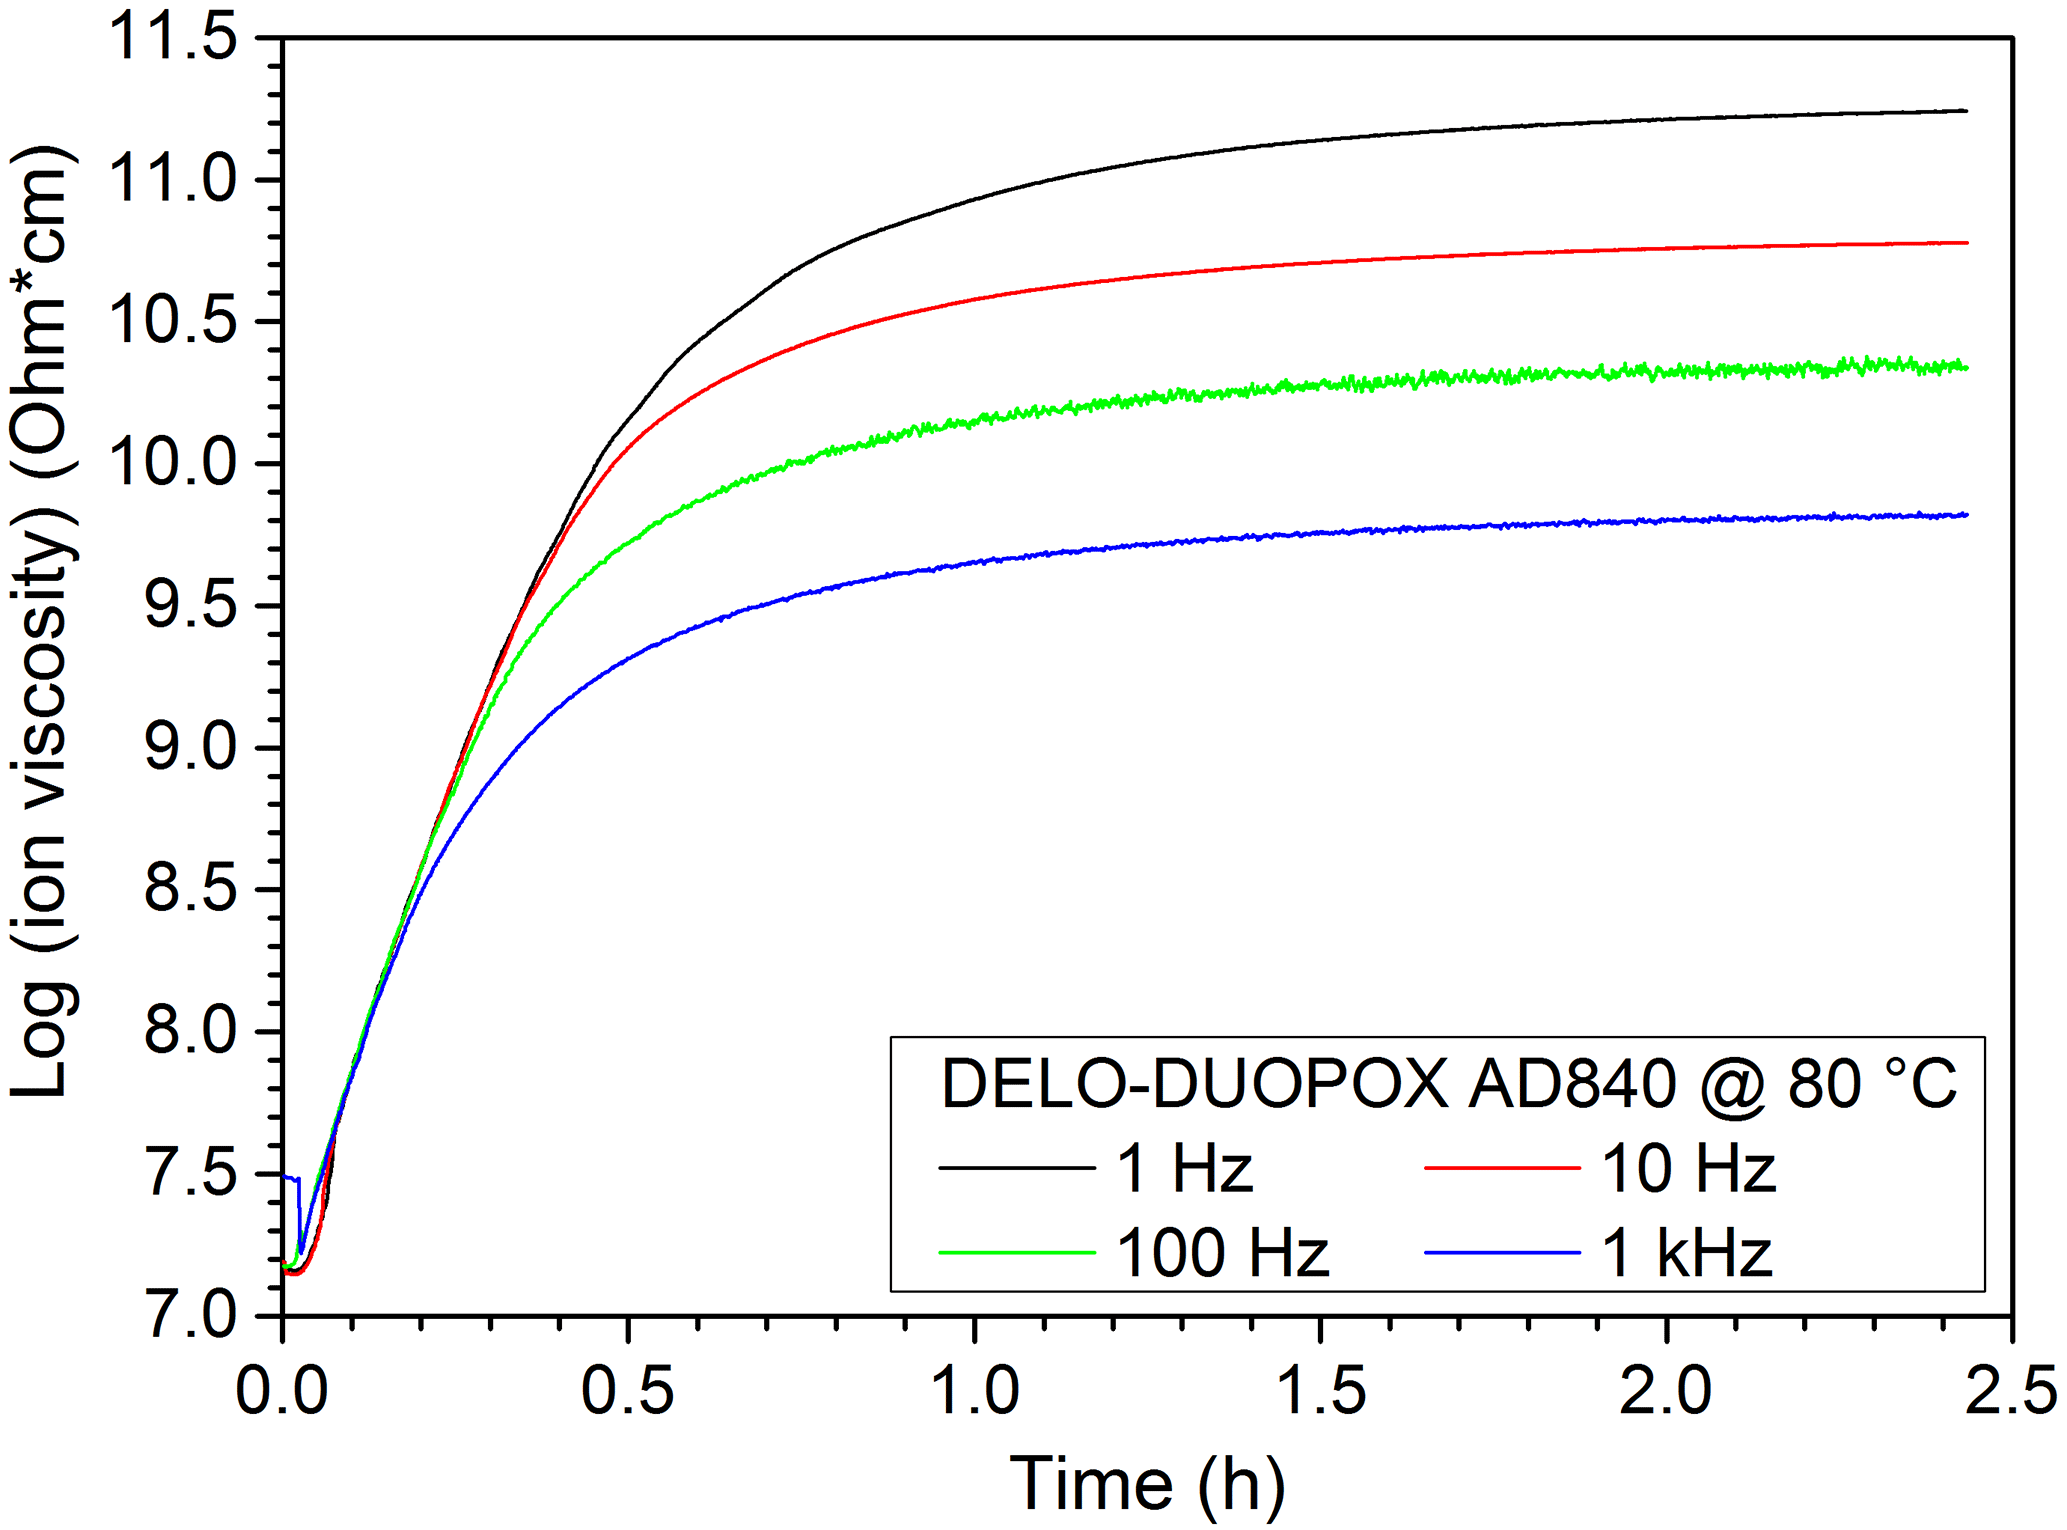
Figure 13Ion viscosity of the DEA measurement of the 2C adhesive (DELO-DUOPOX AD840) at 80 ∘C.
For the NMR measurements, the resin samples, especially in the uncured state, exhibited much higher signals than the PE-X samples. Therefore much better bi-exponential fits for the T2 times were possible. Nonetheless, the graphs received when using echo sums are still smoother. The curing of the 2C epoxy adhesive at room temperature, normalized to the maximum value, is illustrated in Fig. 15. The curing times given in Sect. 2.2 depend on the amount of material used. A higher amount of material leads to a higher reaction temperature, which in turn accelerates the reaction. Since the volume in the cup was higher than for the reference curing times, the different curing states were probably reached earlier. The examined EP and UP resins showed similar trends with different curing times. The curing of UP resin at room temperature is exemplarily shown in Fig. 16, where the expected bi-exponential decay analogous to Eq. (4) has been verified with measurements.
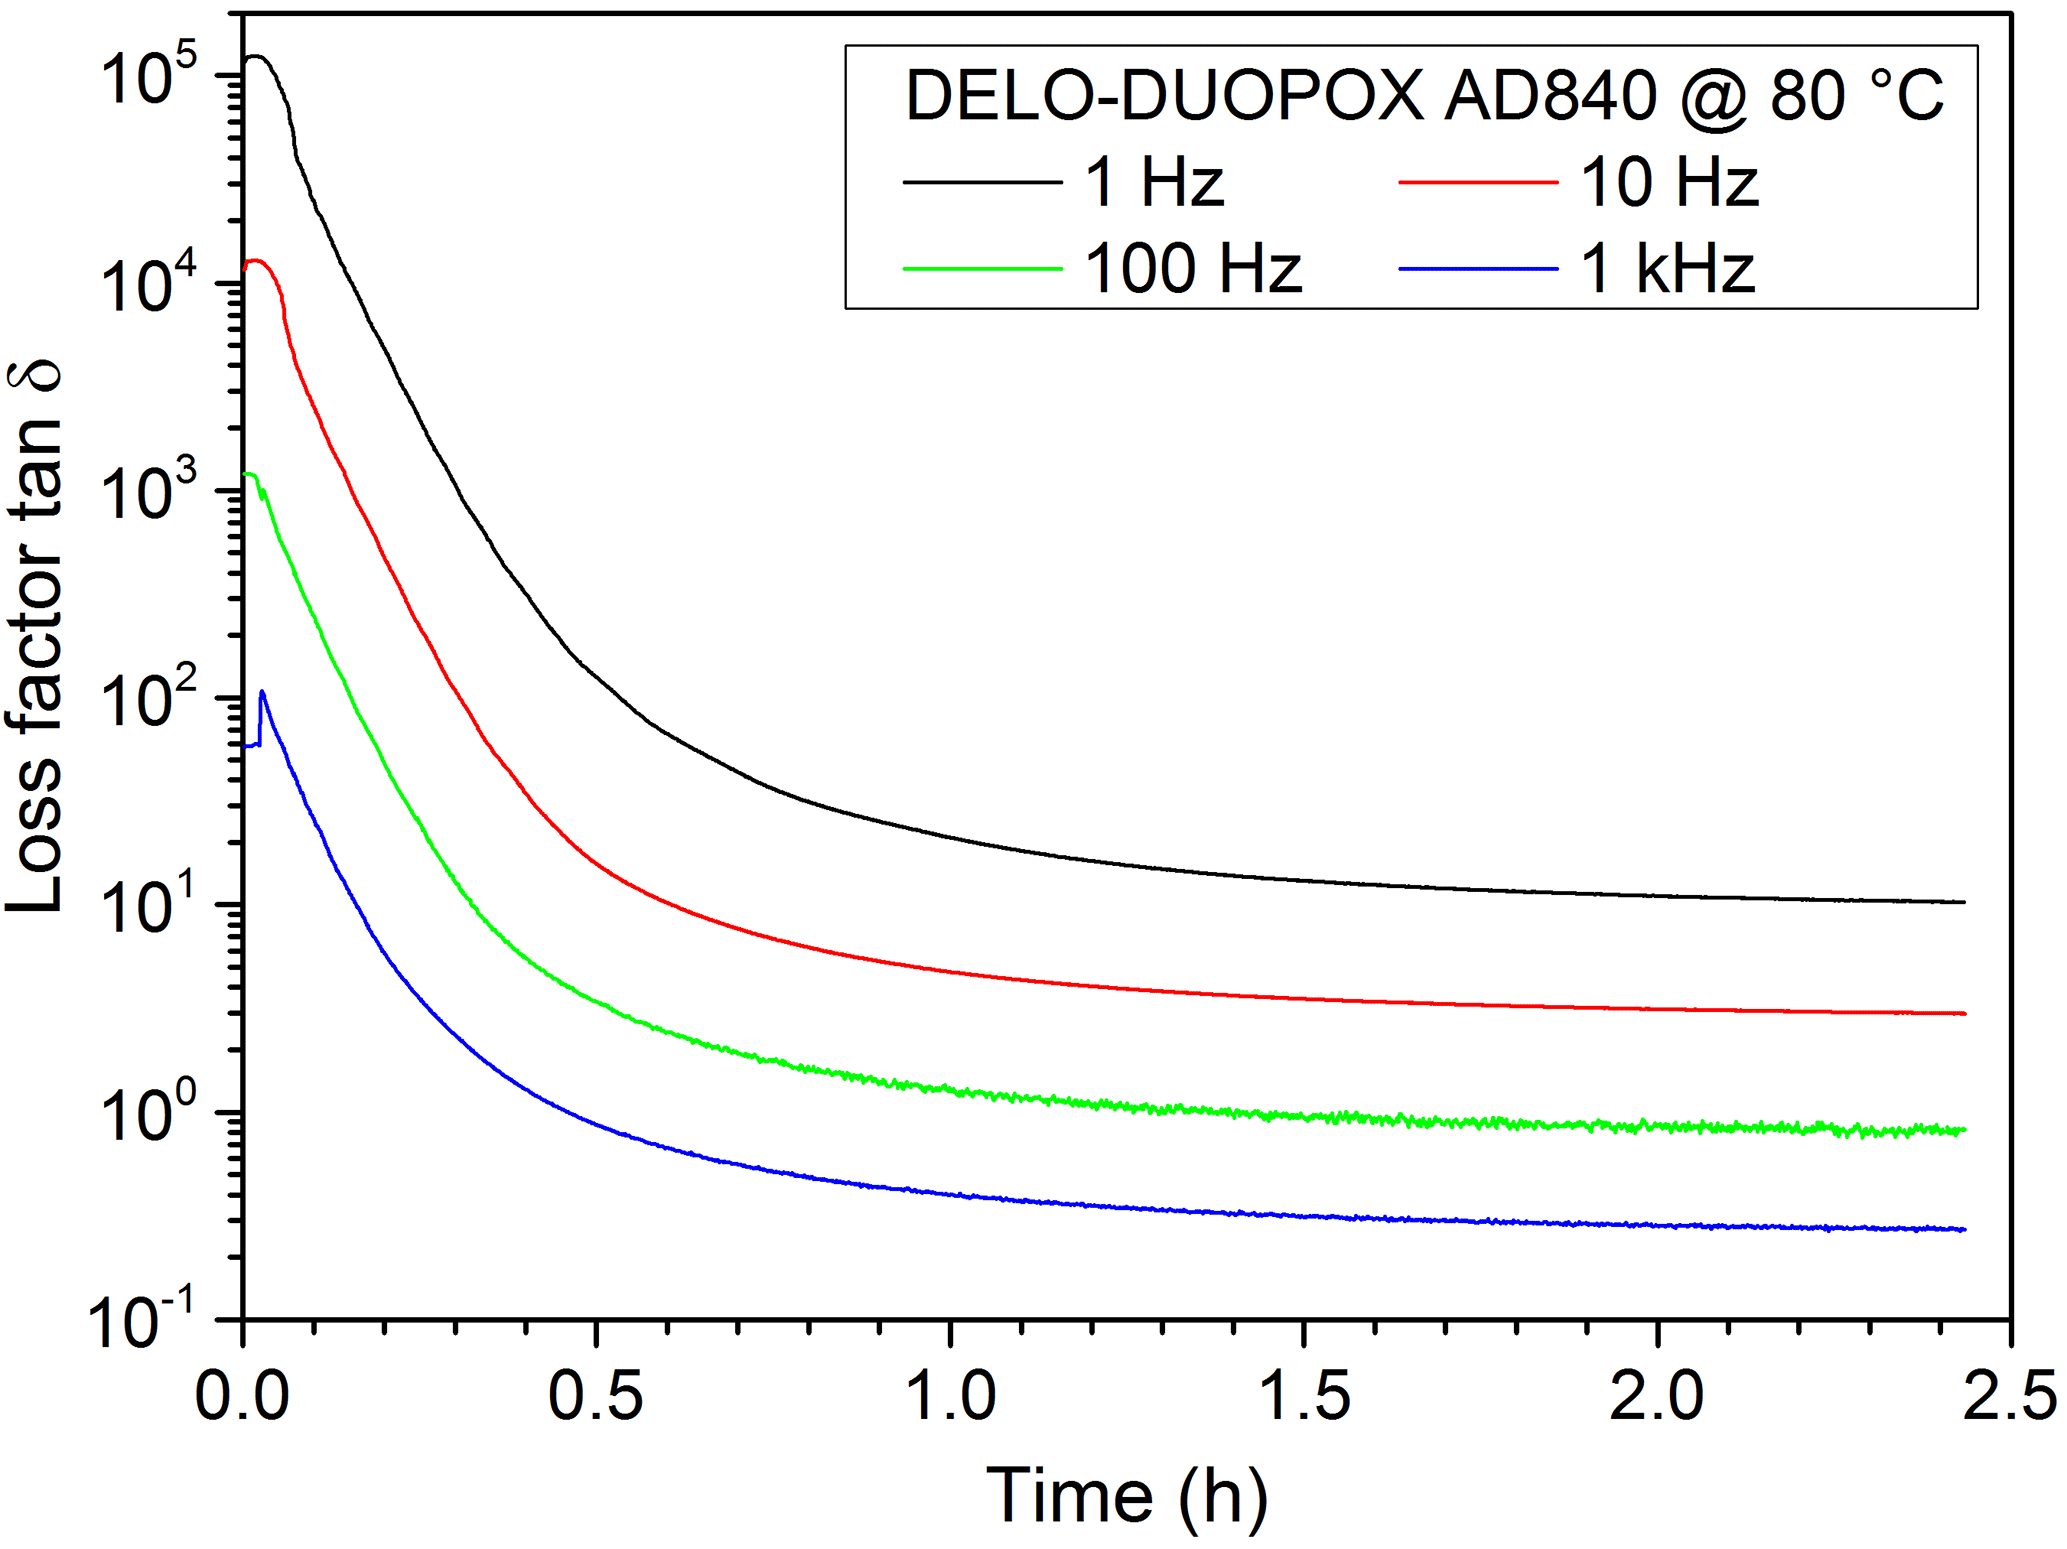
Figure 14Loss factor of the DEA measurement of the 2C adhesive (DELO-DUOPOX AD840) at 80 ∘C.
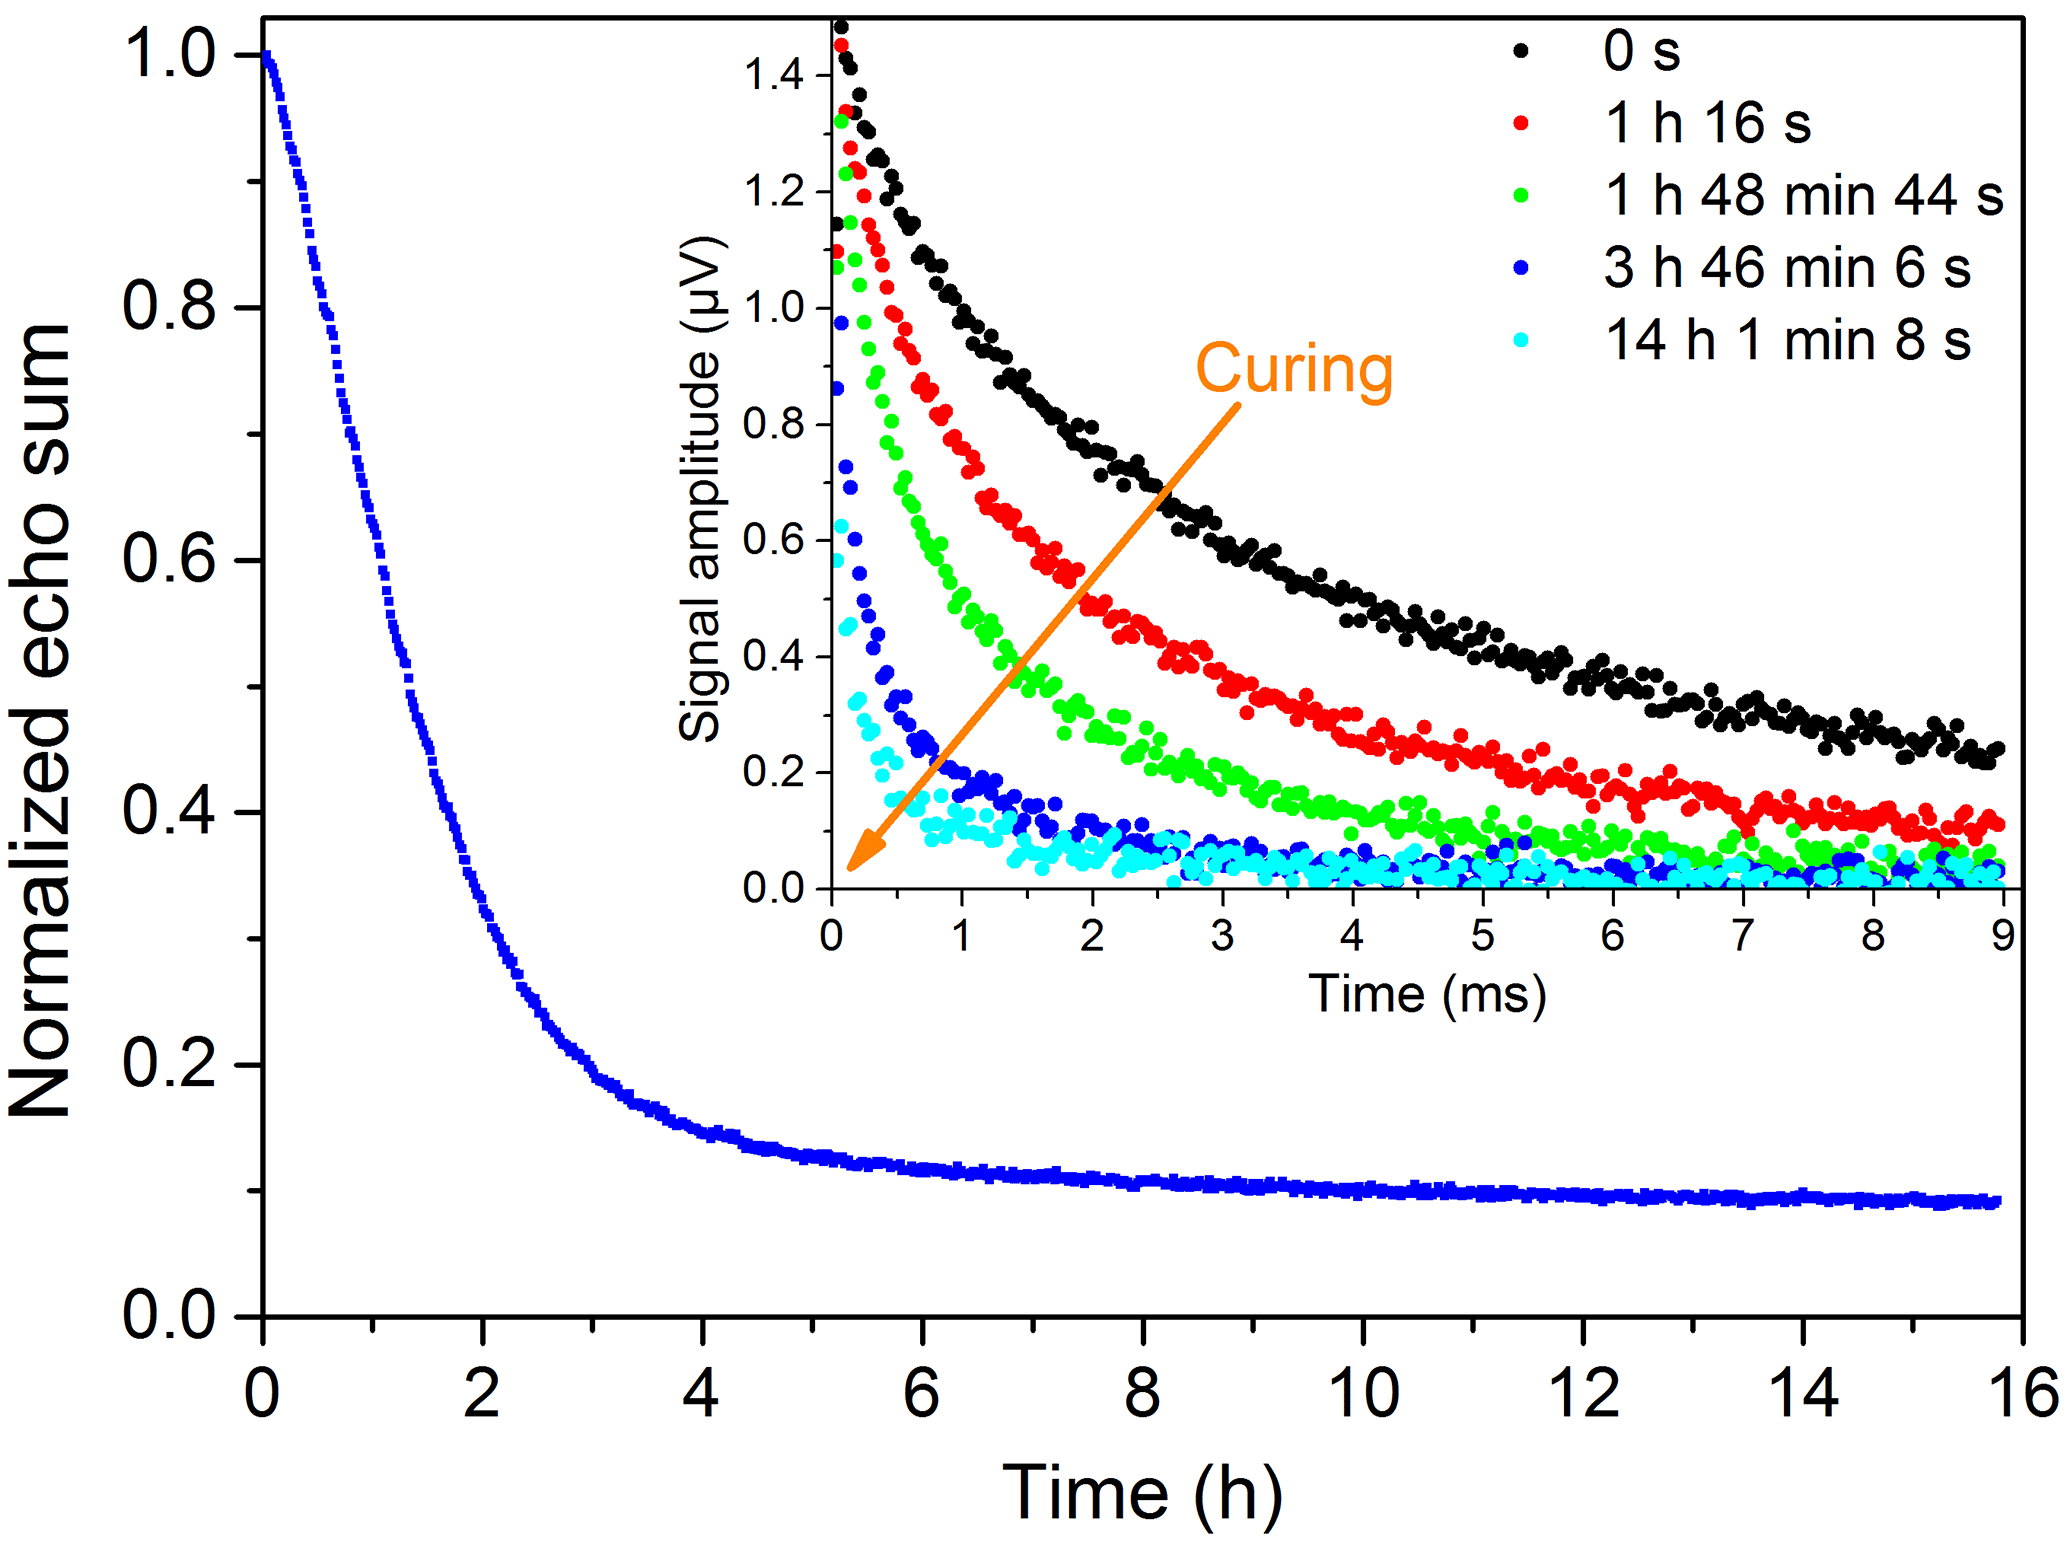
Figure 15Curing of a 2C epoxy adhesive (DELO-DUOPOX AD840) at room temperature: the inset shows single measurements at certain times.
In addition, the comparison of the measurements of two batches of the same EP resin from different years, which is shown in Fig. 17, provided a first impression of the good reproducibility of the measurement method. The slight shifts are explained by the uncertainty in the exact determination of the time between the start of the mixing process and the start of the measurement.
During the experiments where the resin samples were pre-treated at elevated temperatures to activate and speed up the reaction, an additional effect could be seen, which was expressed by an unexpected signal raise at the beginning of the measurement, while the hot sample cups cooled down on the rf coil. This was probably caused by a temperature-based shift of T1 times along with too short repetition times between measurements and hence lower maximum signals. The time between measurements has to be long enough to allow the magnetization to fully recover (about 5 times T1 is recommended). Moreover, the position of the sensitive volume can shift, since it is dependent on the temperature of the magnets. The results for pre-treatment of UP resin for different times at 60 ∘C are shown in Fig. 18.
For a quantification of the degree of curing, a user-defined 100 % value is necessary. Currently, normalization allows the comparison of different measurements providing the same starting time. Also, the slope of the decaying signal curve seems to be a good criterion for the reactivity of the resins.
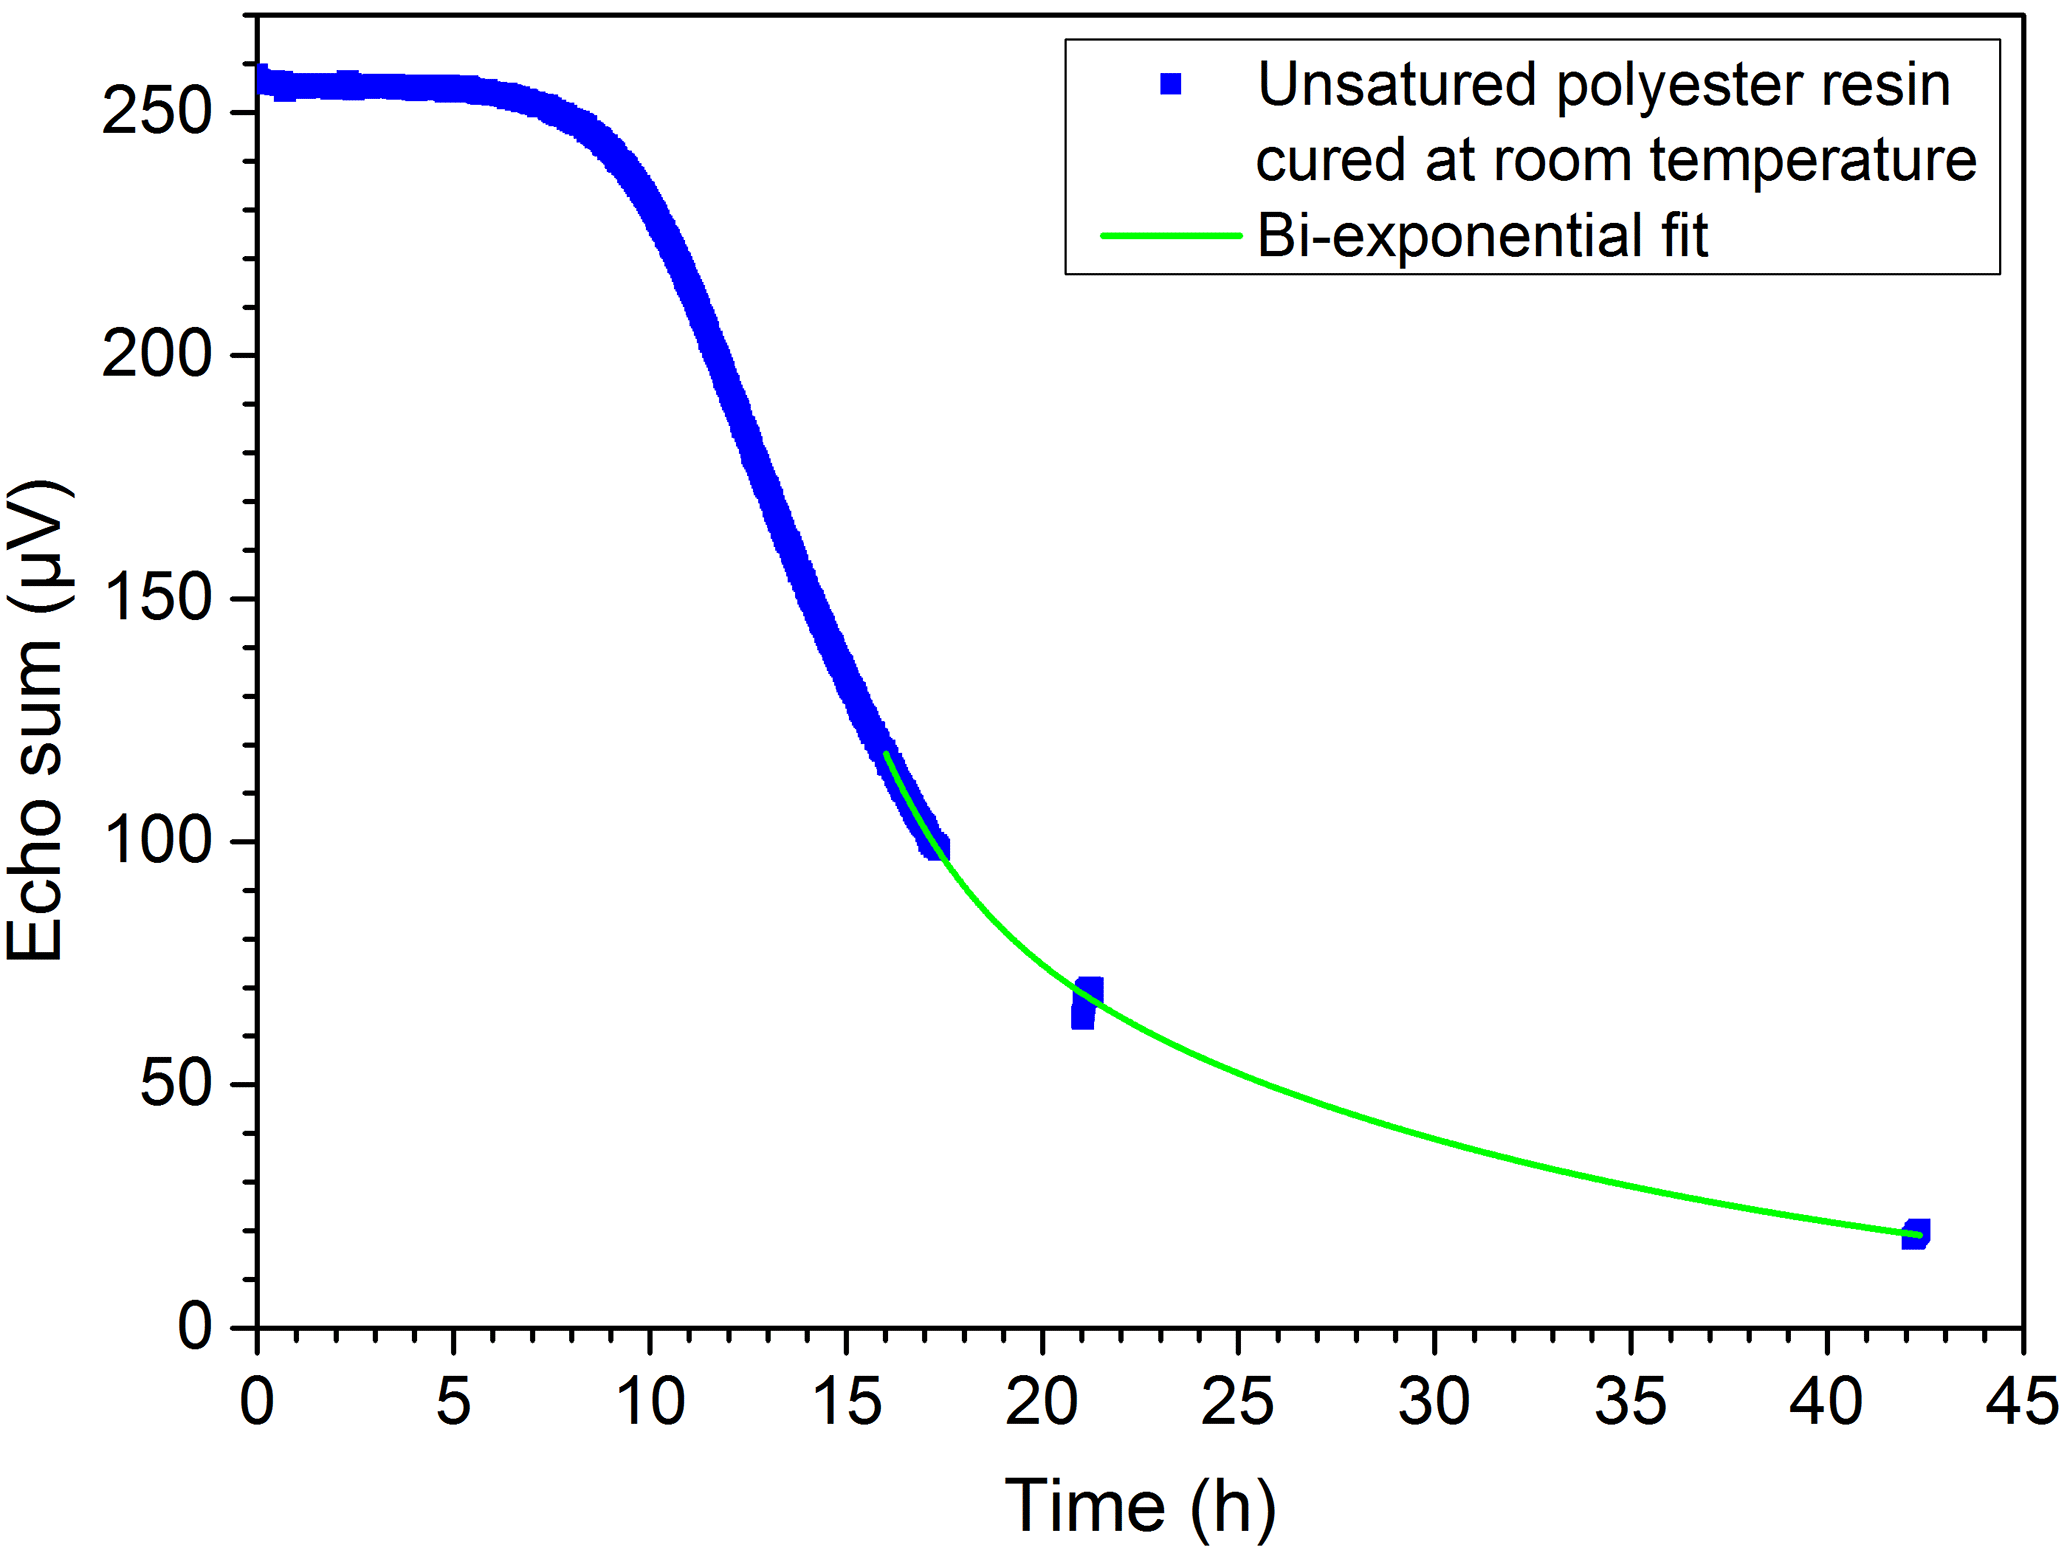
Figure 16Curing of UP resin at room temperature: the expected bi-exponential decay has been verified by measurements.
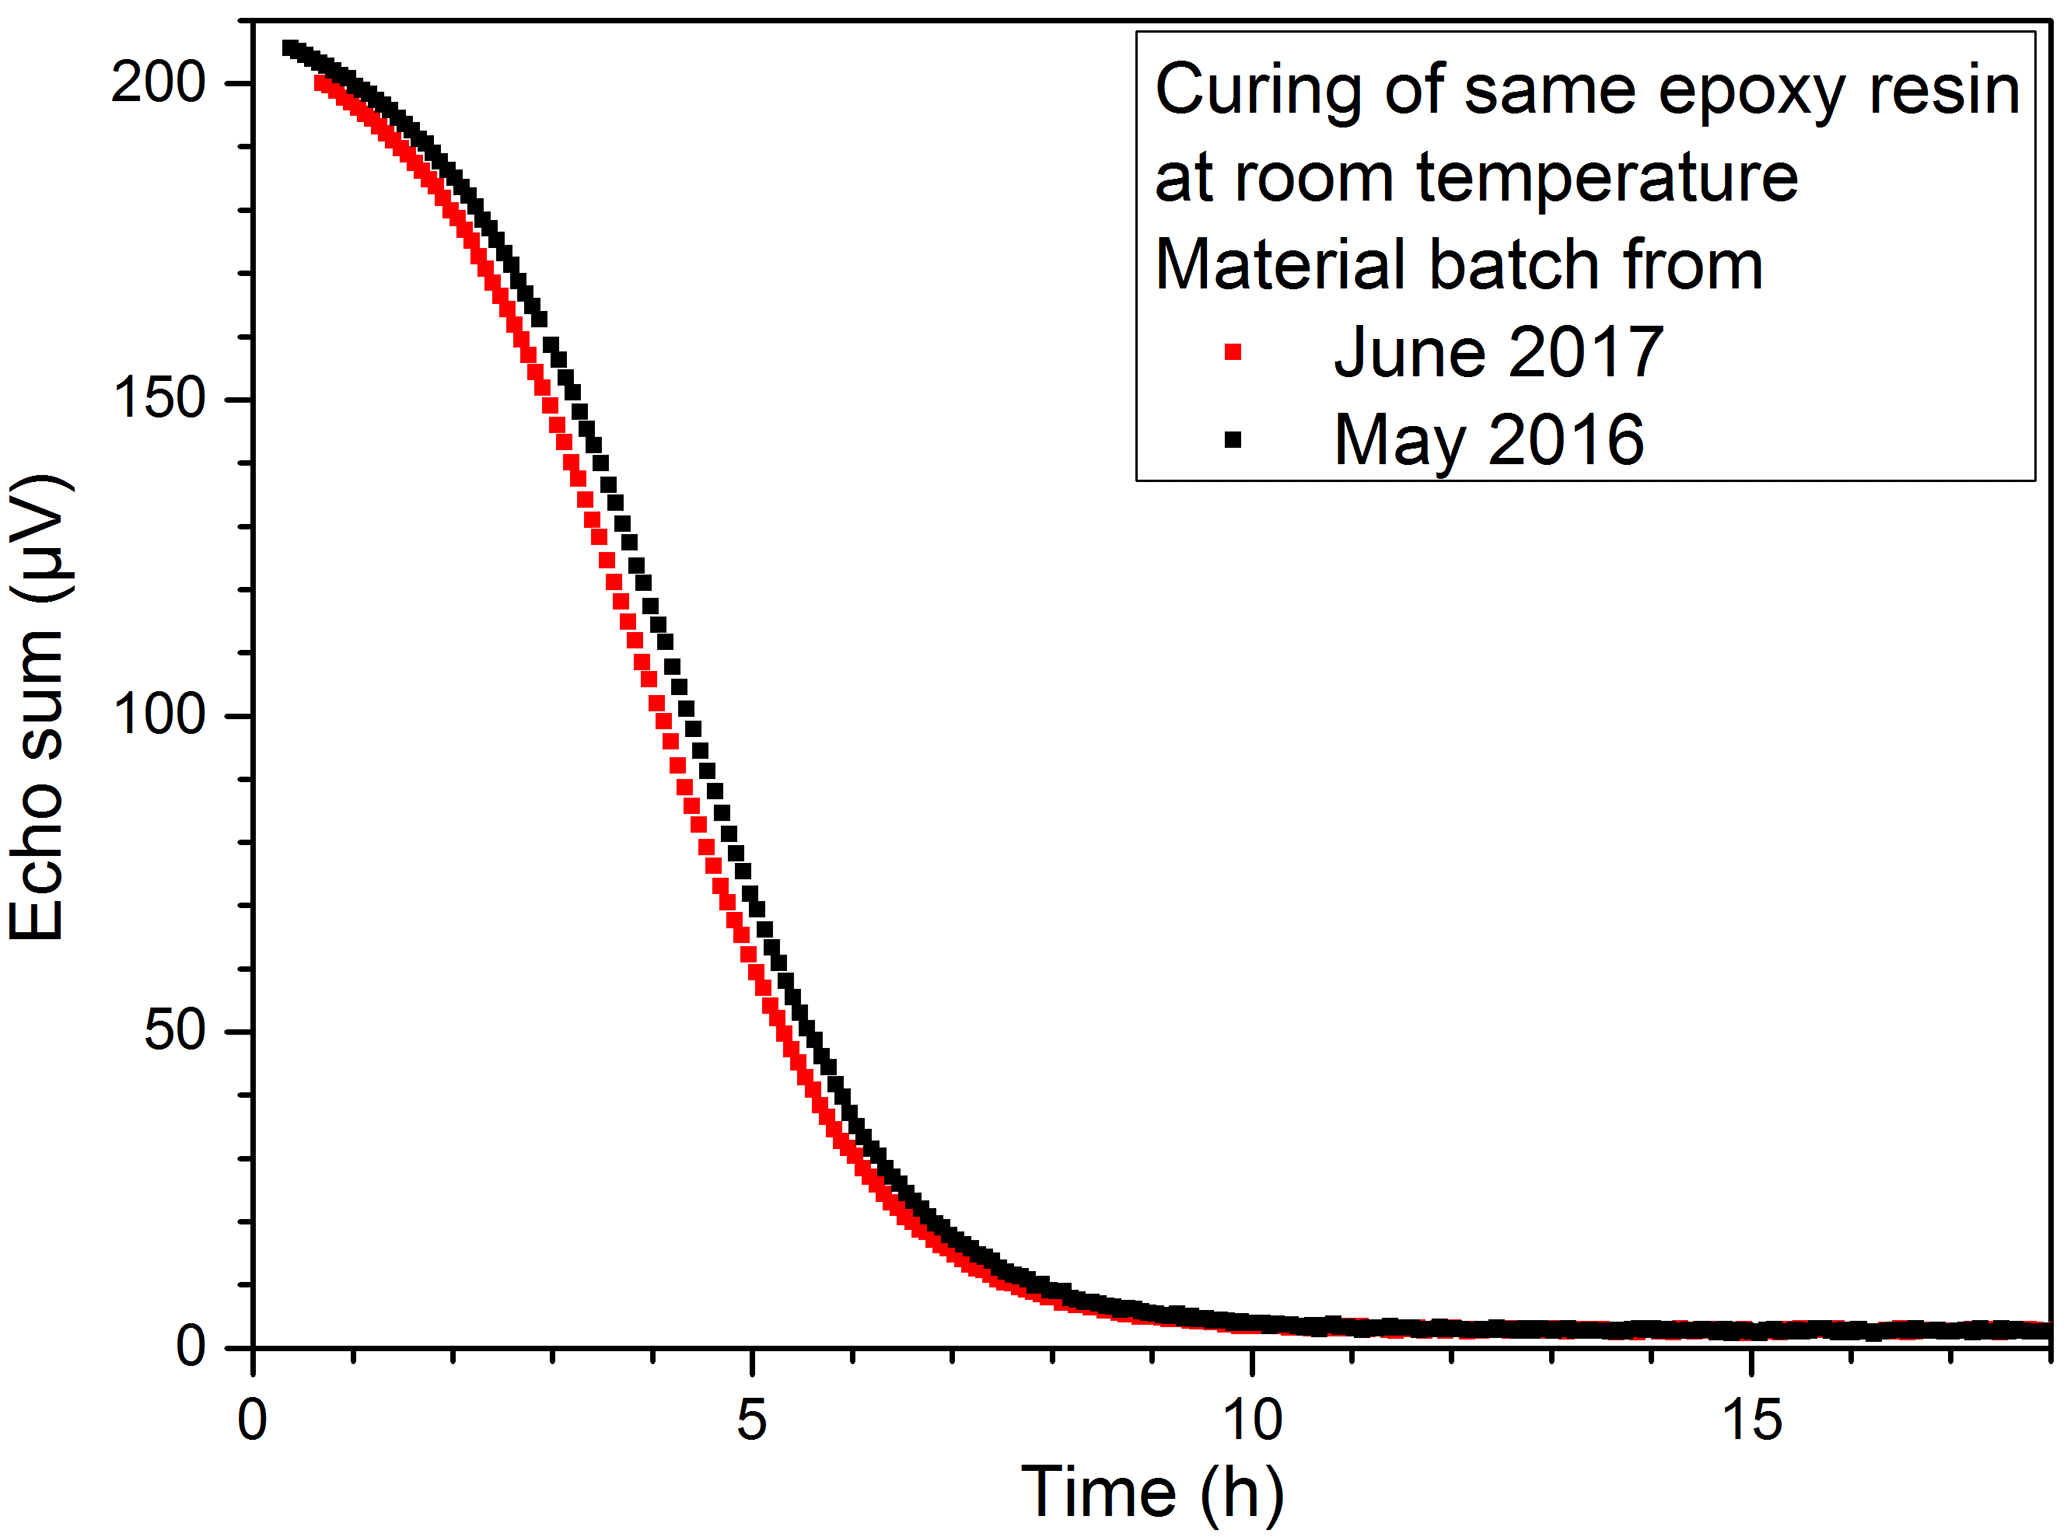

Figure 18Curing of UP resin at room temperature: the samples were pre-treated at 60 ∘C in a furnace for different times before measurement.
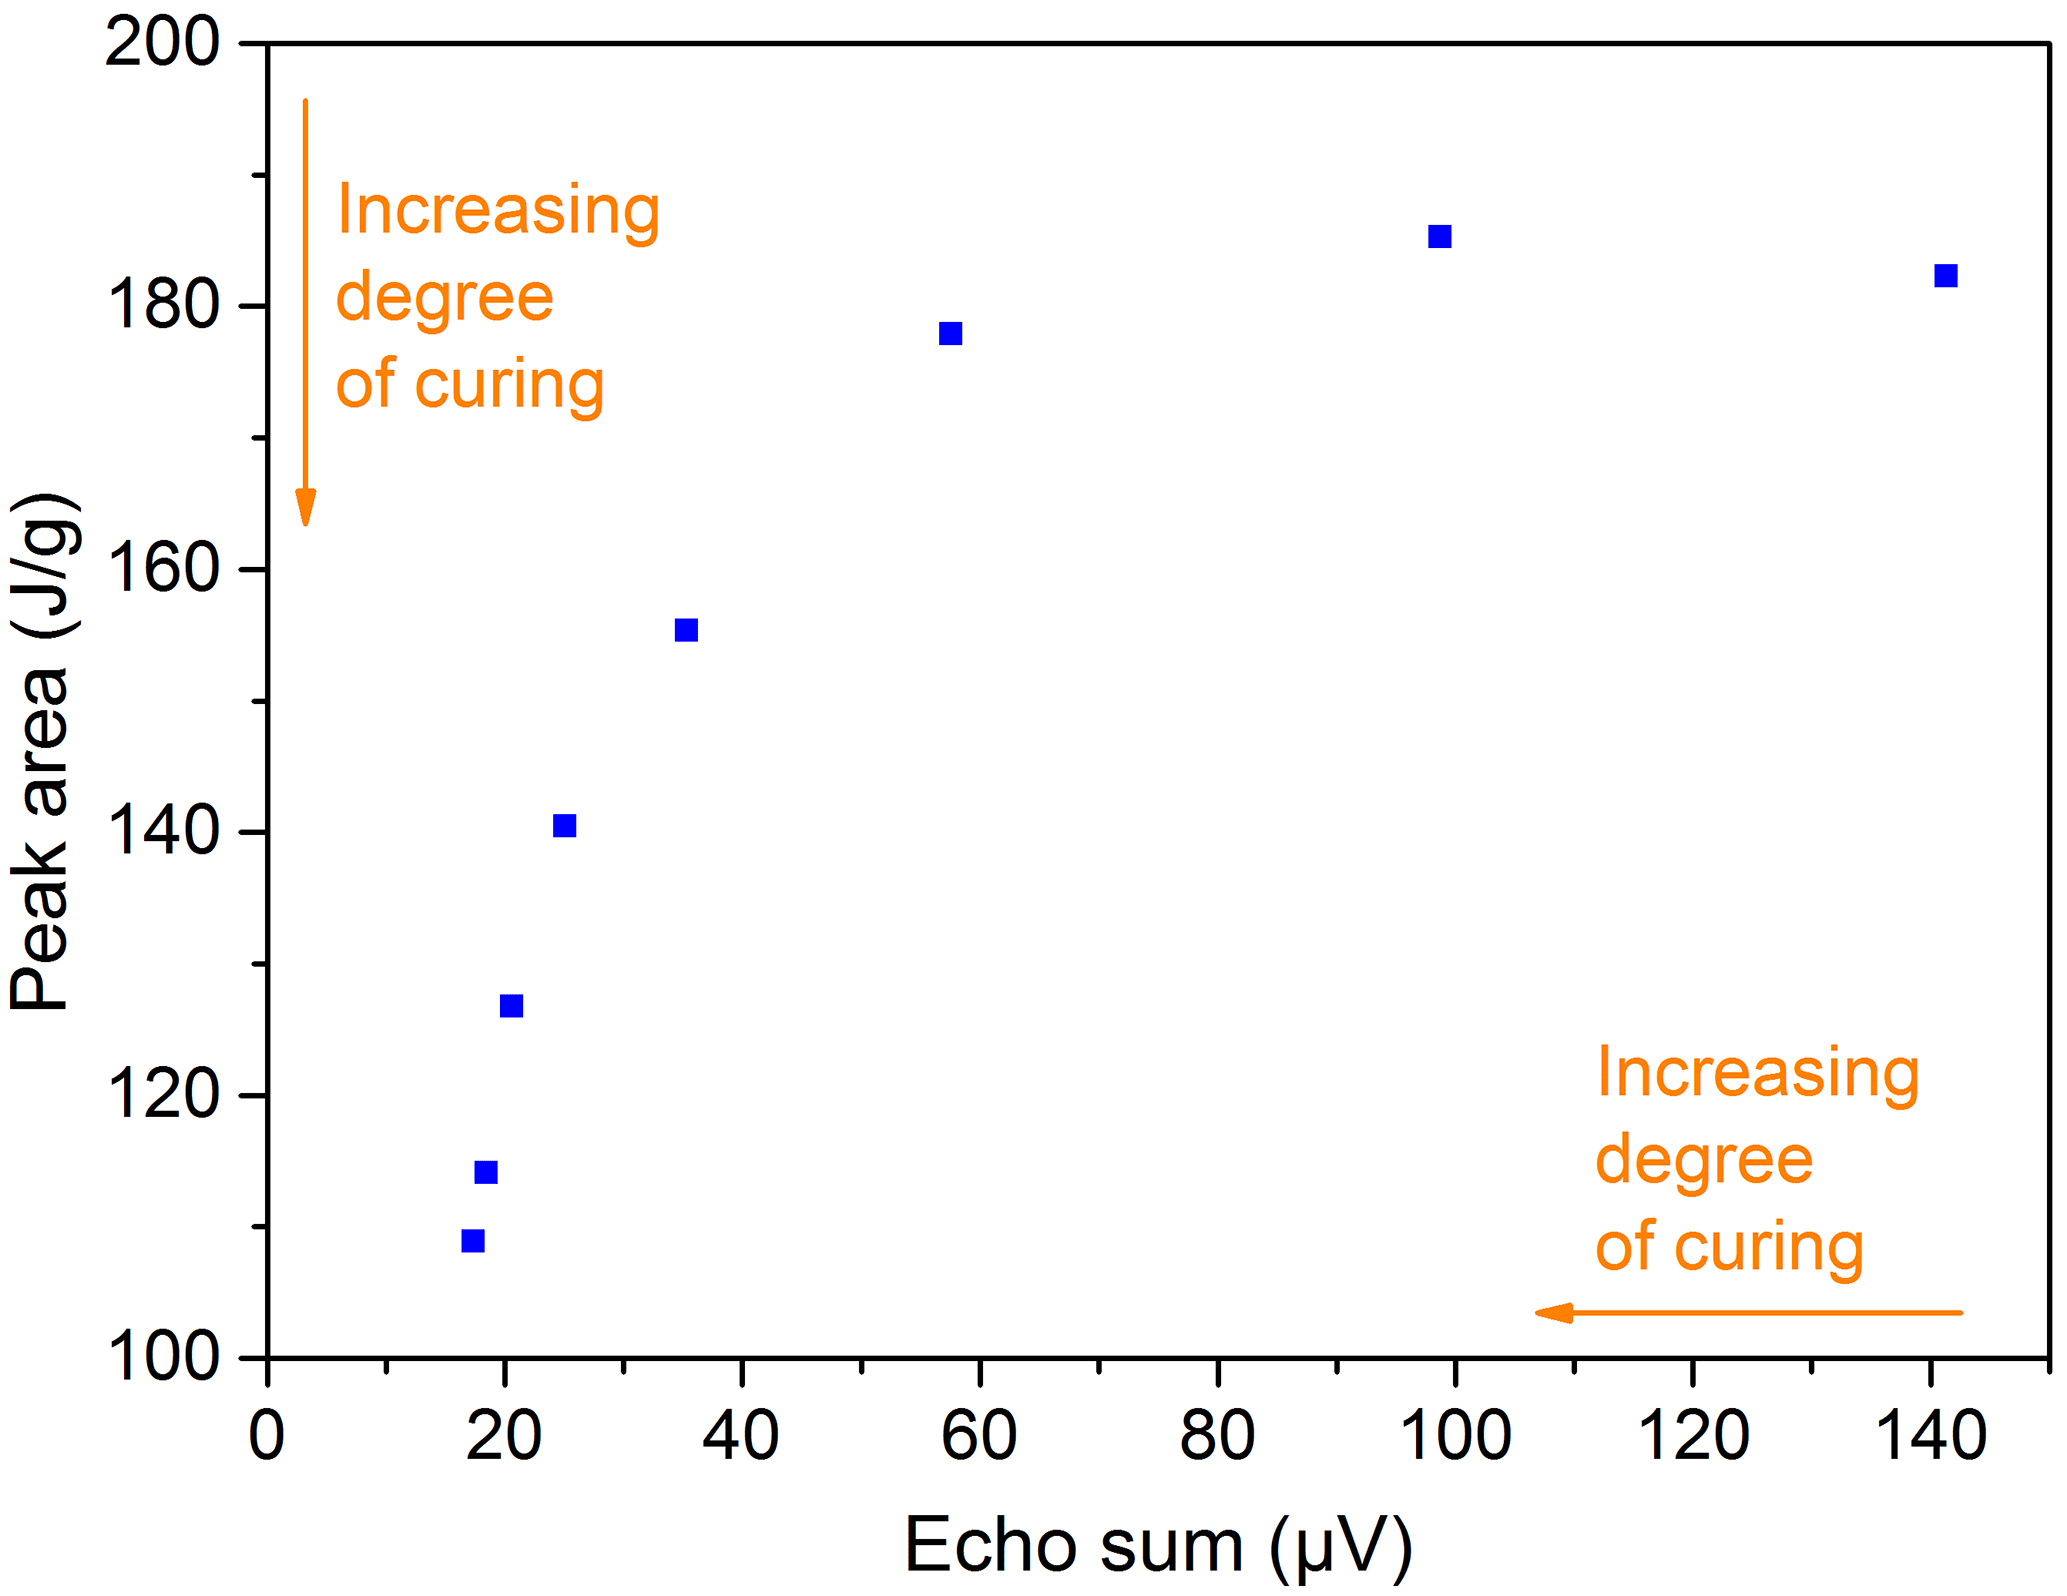
Figure 19Comparison of peak areas from DSC measurements and echo sums from NMR experiments at the same times for the 2C adhesive (DELO-DUOPOX AD840) cured at room temperature.
All materials examined with the NMR-Mouse showed signal trends that can be used for a correlation with the degree of cross-linking and curing. The similarity to the signal trends received from DSC (peak area) and DEA (loss factor) can be clearly seen. Another way of comparison is to plot the peak area from the DSC measurements over the echo sum generated with NMR experiments at the same times, as shown in Fig. 19. The same way of illustration can also be done for the ion viscosity (Fig. 20) and the loss factor (Fig. 21) received from DEA. The three graphs show an exponential trend, but it has to be kept in mind that all values are single measurements. For verification of these trends and to evaluate a general correlation between the different measurement methods, especially with the aim of quantifying the degree of cross-linking or curing, more measurements have to be performed. Further research works on this field are already planned.
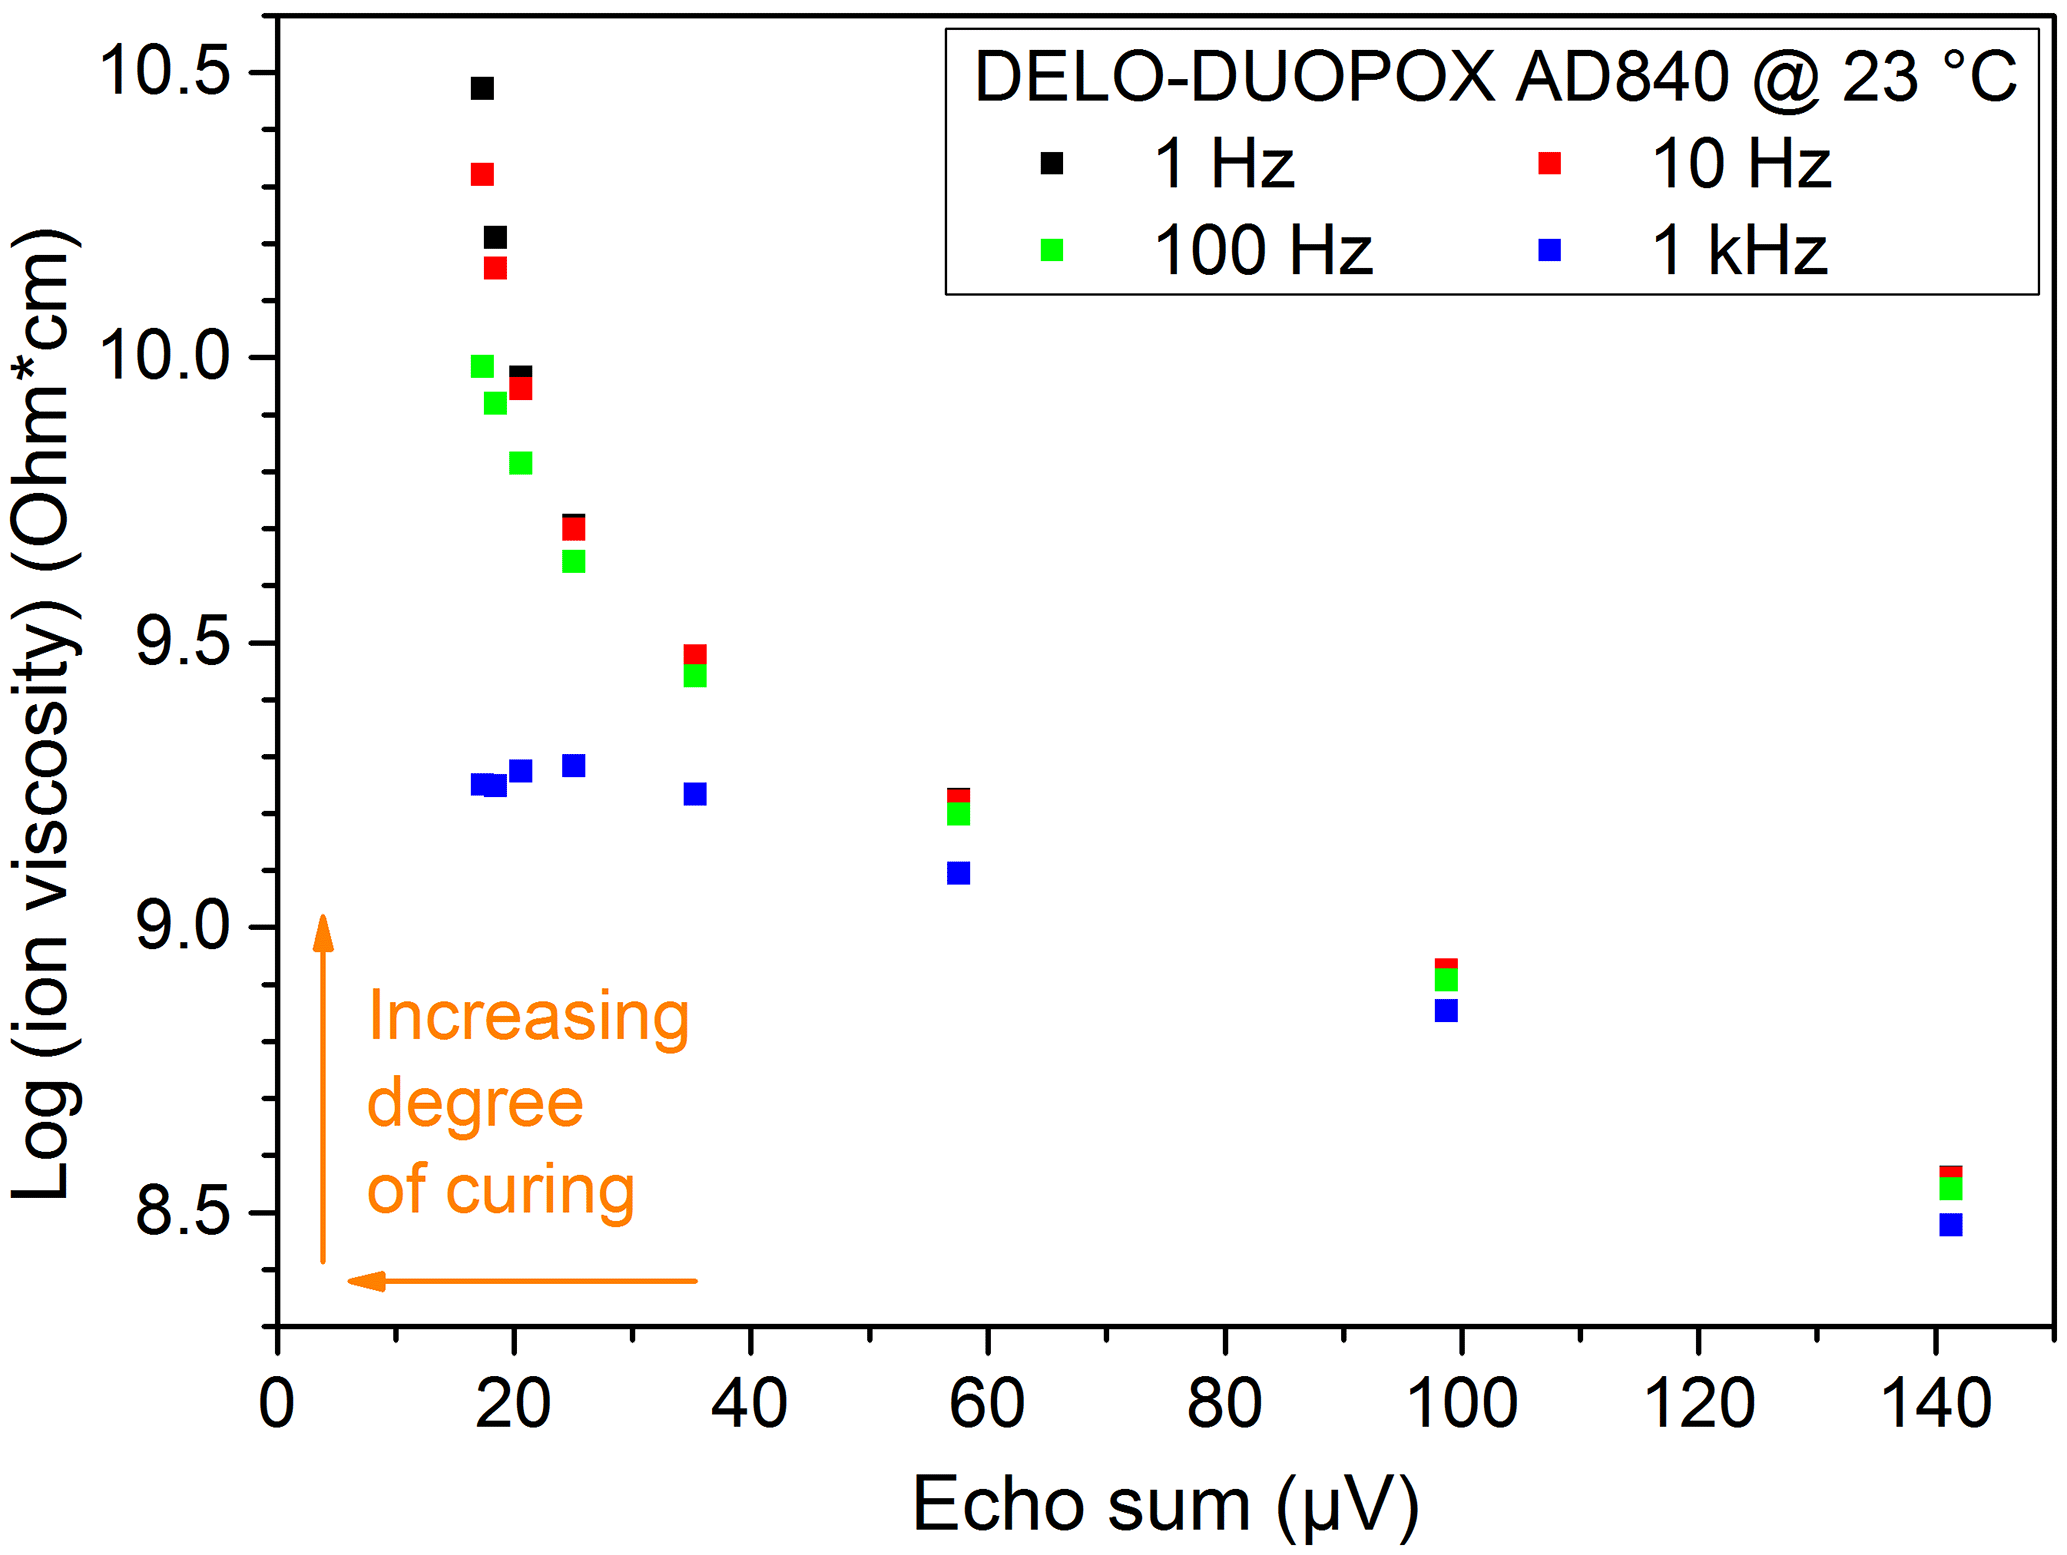
Figure 20Comparison of ion viscosity from DEA measurements and echo sums from NMR experiments at the same times for the 2C adhesive (DELO-DUOPOX AD840) cured at room temperature.
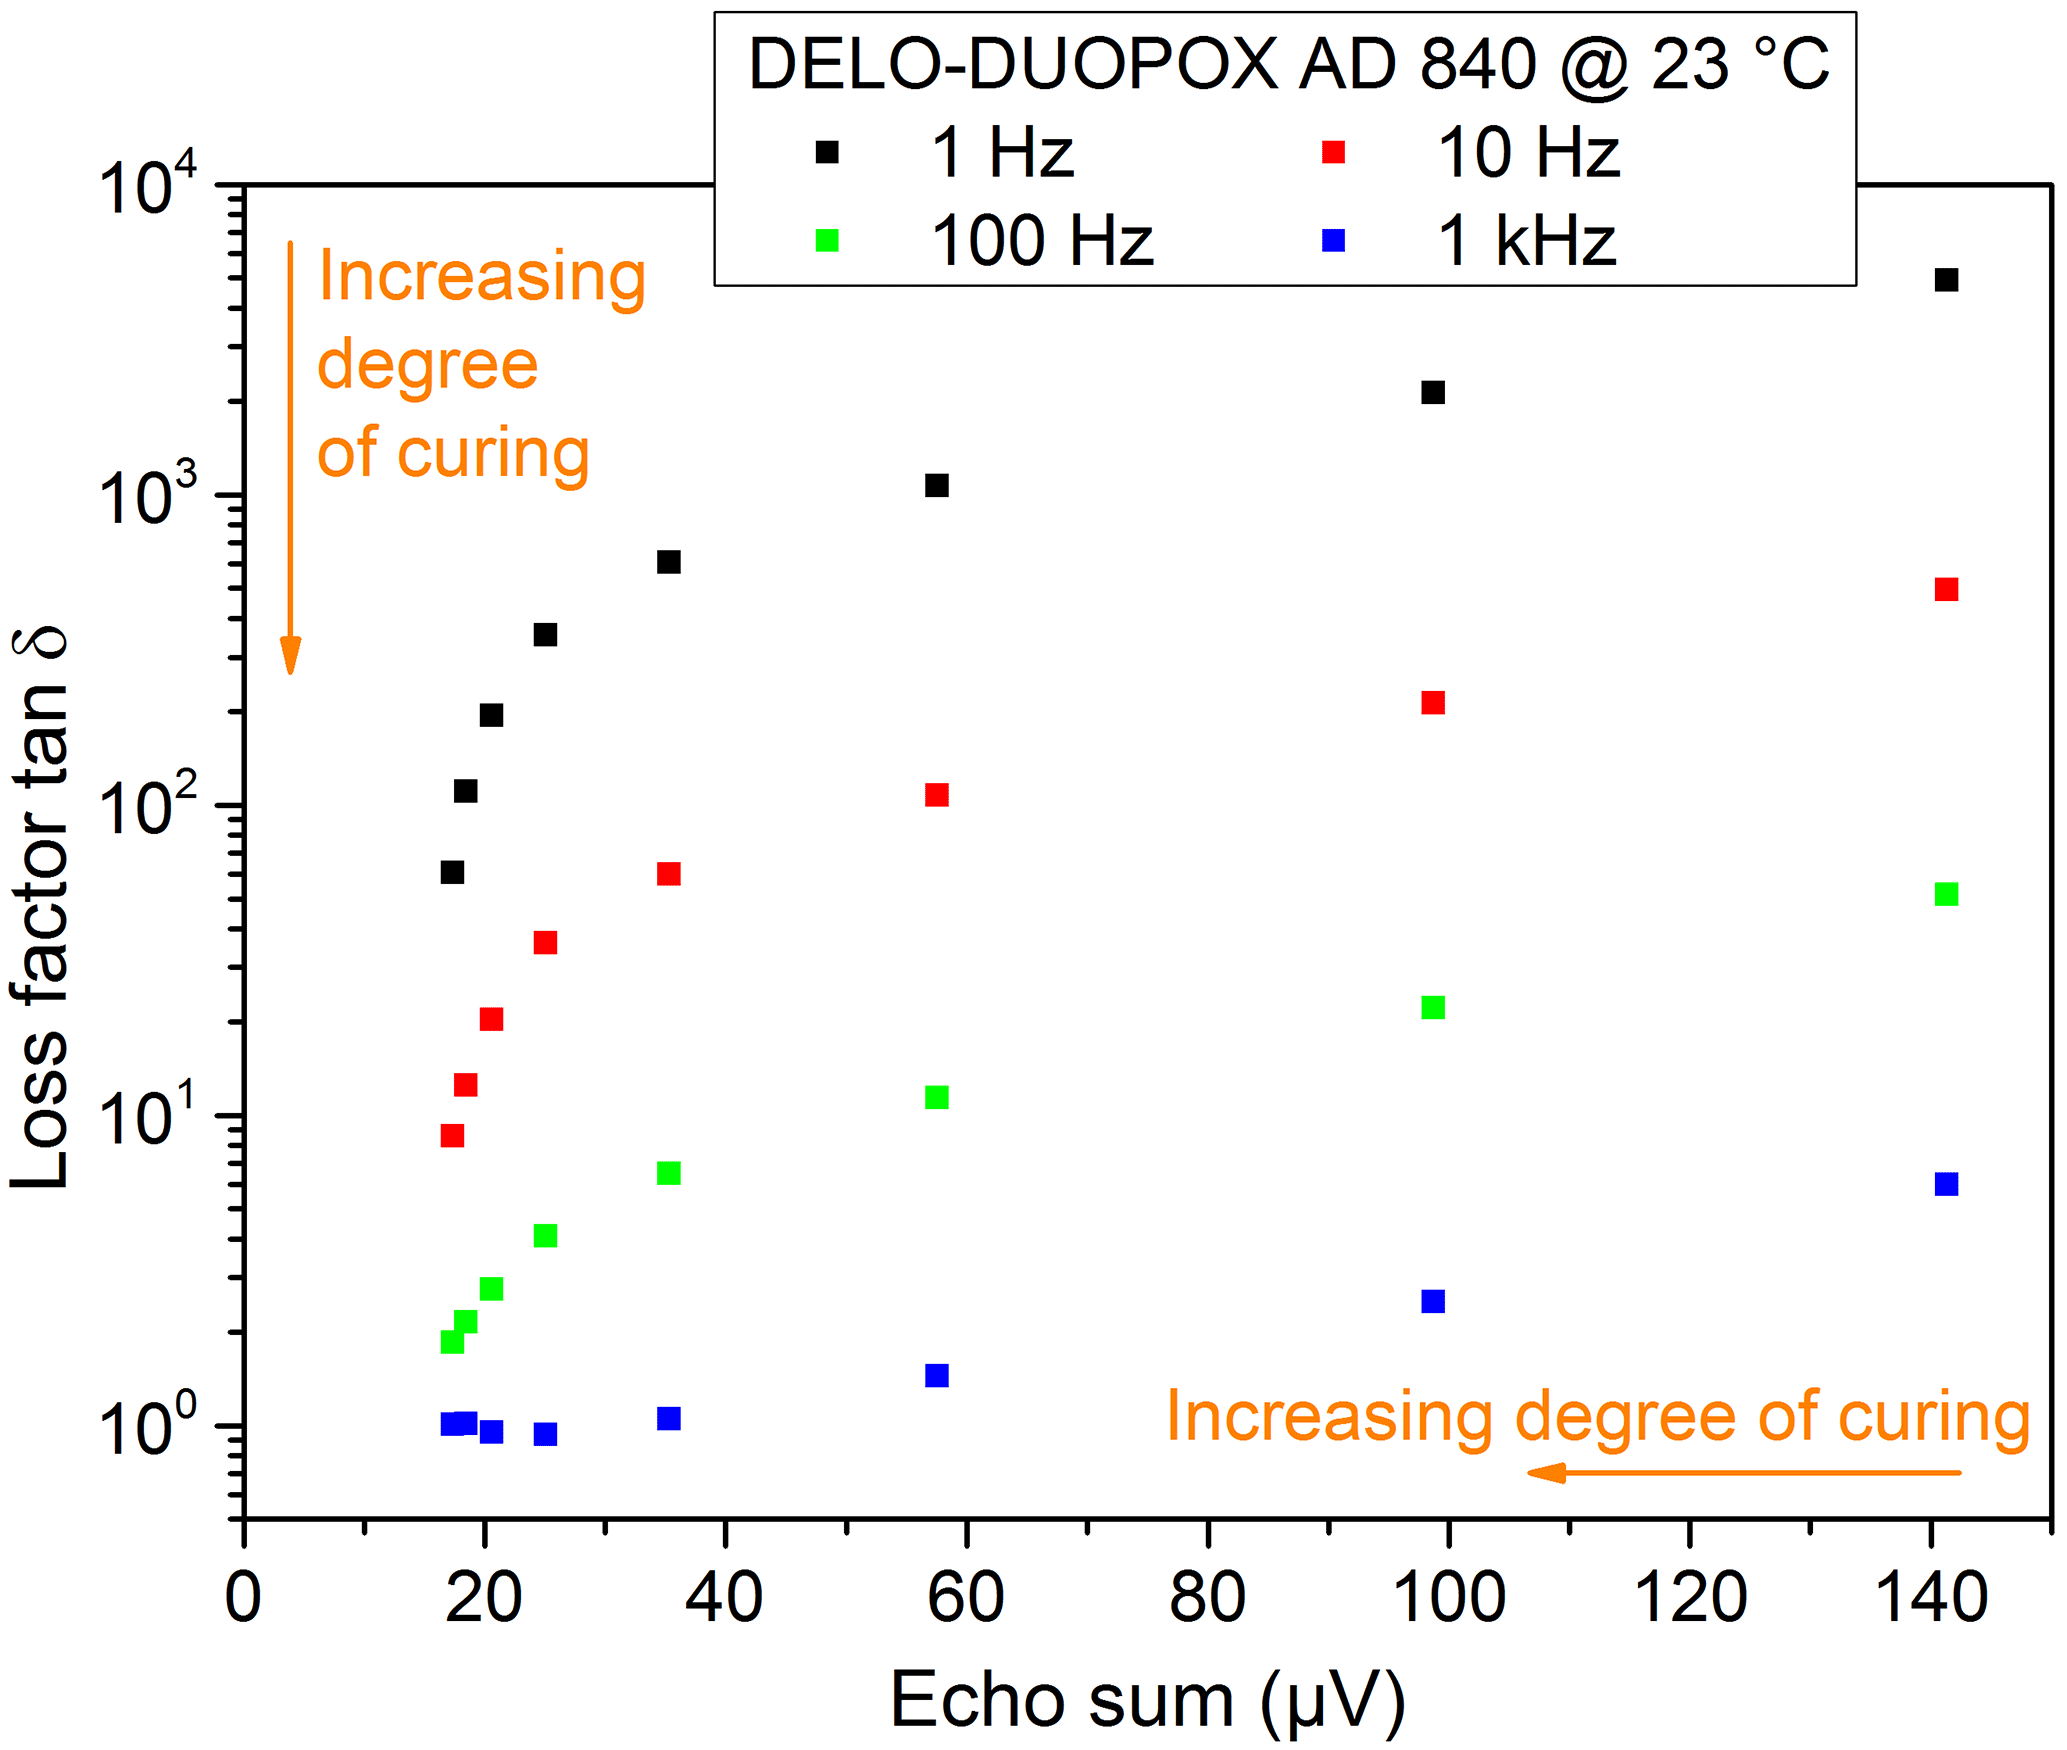
Figure 21Comparison of the loss factor from DEA measurements and echo sums from NMR experiments at the same times for the 2C adhesive (DELO-DUOPOX AD840) cured at room temperature.
The different trends for PE-Xa and PE-Xc, probably based on different crystallinity levels, require further investigations. A first step could be the tempering of the samples at temperatures above crystallite melting temperature. This should have the same influence as the second heating in the DSC measurements and result in lower crystallinity of the PE-Xc samples. Consequently, the same signal trends in the NMR are expected after this treatment. Furthermore, the loss in crystallinity caused by cross-linking during the manufacturing process (and maybe after tempering) can be correlated with the degree of cross-linking. Locally varying crystallinity levels could also be a reason for obtaining different results when measuring on different sample positions and depths.
Moreover, the effects of sample and magnet temperature have to be taken into account. In general, a higher sample temperature will lead to a higher signal caused by increased molecular mobility. However, the T1 times are influenced by the temperature and may yield differing results. On the other hand, a constant magnet temperature is crucial, since shifts in the position of the sensitive volume and the resonance frequency can occur. For the experiments with resins and adhesives the amount of sample material was rather high. Testing with thin films could reduce the reaction temperature development and would, in the case of adhesives, be closer to the real application. Besides, active cooling of the magnets or shock cooling of the heated samples might be a possibility to freeze the actual curing state.
For resins and adhesives a good quantification of the degree of curing should be possible. Although the reproducibility of these materials is already good, the various influences such as sample quantity and temperature must also be examined in detail.
As shown for the PE-X samples, the measurement uncertainty is rather big and disallows a quantification of the degree of cross-linking in steps of (sub-)percent. The main reason for this is the inhomogeneous magnetic field. To achieve a higher signal-to-noise ratio and probably smaller measurement errors, longer measurement times and stable environmental conditions during the measurement are necessary. Furthermore, the resolution of the depth profiles can be improved when using a high-precision lift instead of glass spacers. Also, for detailed observations, the use of systems with a homogeneous magnetic field, like benchtop NMR, or even standard NMR, might deliver valuable additional information. However, the use of the single-sided system is still preferred, as non-destructive and non-contact testing is favorable for production monitoring.
The experiments shown in this article, using single-sided NMR on PE-X, demonstrate the possibility of quantifying the degree of cross-linking in PE-X. Some points like the different trends of PE-Xa and PE-Xc and the possible resolution for quantification still have to be examined in detail. Adhesives and resins exhibited more signal than PE-X. Cure monitoring for these materials proved to be possible, when the starting point and final cure are defined and comparable measurement conditions are provided. For further experiments, thin adhesive films with a thickness between 50 and 200 µm should be used to reduce reaction temperature caused by the amount of material and feature more industrial practice.
Another interesting topic is the examination of effects caused by higher sample and magnet temperature. Therefore the integration of a temperature monitoring system into the NMR-Mouse is planned to check for how long the system can be exposed to higher temperatures before the magnets reach the critical Curie temperature.
The relatively short measurement times of only a few seconds have the potential to realize inline-monitoring systems for the degree of cross-linking during the production of semi-finished products or the curing of resins (e.g., in composites) and adhesives on lightweight construction. For upcoming activities a focus on adhesives and the correlation of results from NMR measurements with parameters relevant for the user, e.g., hardness, seems interesting.
DEA, DSC and NMR data are presented in the Supplement to this paper.
The supplement related to this article is available online at: https://doi.org/10.5194/jsss-7-21-2018-supplement.
The authors declare that they have no conflict of interest.
This article is part of the special issue “Sensor/IRS2 2017”. It is a result of the AMA Conferences, Nuremberg, Germany, 30 May–1 June 2017.
IGF project 18258 N by the research association “Foerdergemeinschaft fuer
das SKZ” was funded through the AiF within the scope of the program for the
promotion of cooperative industrial research and development (IGF) by the
Federal Ministry for Economic Affairs and Energy due to a decree by the
German Bundestag. We would like to thank them for the financial support.
Furthermore, we would like to thank the members of the project-related
committee for the discussions, DELO Industrie Klebstoffe GmbH & Co. KGaA
and LAMILUX Heinrich Strunz Holding GmbH & Co. KG for the supply of
samples, and BGS Beta-Gamma-Service GmbH & Co. KG for the cross-linking of
samples.
Edited by: Stefan
Zimmermann
Reviewed by: two anonymous referees
Bloch, F.: Nuclear induction, Phys. Rev., 70, 460–474, https://doi.org/10.1103/PhysRev.70.460, 1946.
Bloembergen, N., Purcell, E. M., and Pound, R. V.: Relaxation effects in nuclear magnetic resonance absorption, Phys. Rev., 73, 679–712, https://doi.org/10.1103/PhysRev.73.679, 1948.
Blümich, B., Blümler, P., Eidmann, G., Guthausen, A., Haken, R., Schmitz, U., Saito, K., and Zimmer, G.: The NMR-mouse: construction, excitation, and applications, Magn. Reson. Imaging, 16, 479–484, https://doi.org/10.1016/S0730-725X(98)00069-1, 1998.
Blümich, B., Casanova, F., Buda, A., Kremer, K., and Wegener, T.: Mobile NMR for Analysis of Polyethylene Pipes, Acta Phys. Pol. A, 108, 13–23, https://doi.org/10.12693/APhysPolA.108.13, 2005.
Blümich, B., Perlo, J., and Casanova, F.: Mobile single-sided NMR, Prog. Nucl. Mag. Res. Sp., 52, 197–269, https://doi.org/10.1016/j.pnmrs.2007.10.002, 2008.
Carr, H. Y. and Purcell, E. M.: Effects of diffusion on free precession in nuclear magnetic resonance experiments, Phys. Rev., 94, 630–638, https://doi.org/10.1103/PhysRev.94.630, 1954.
DIN: DIN EN ISO 10147, Pipes and fittings made of crosslinked polyethylene (PE-X) – Estimation of the degree of crosslinking by determination of the gel content, Deutsches lnstitut für Normung e.V., Beuth publication house, Berlin, 2013.
Dole, M.: Cross-Linking and Crystallinity in Irradiated Polyethylene, Polym.-Plast. Technol., 13, 41–64, https://doi.org/10.1080/03602557908067674, 1979.
Fry, C. G. and Lind, A. C.: Determination of crosslink density in thermoset polymers by use of solid-state proton NMR techniques, Macromolecules, 21, 1292–1297, https://doi.org/10.1021/ma00183a019, 1988.
Hahn, E. L.: Spin echoes, Phys. Rev., 80, 580–594, https://doi.org/10.1103/PhysRev.80.580, 1950.
Hirabayashi, H., Iguchi, A., Yamada, K., Nishimura, H., Ikawa, K., and Honma, H.: Study on the Structure of Peroxide Cross-Linked Polyethylene Pipes with Several Stabilizers, Mater. Sci. Appl., 4, 497–503, https://doi.org/10.4236/msa.2013.49060, 2013.
Heiduk, I., Falk, M., Schubert, D. W., and Kaschta, J.: Quality Monitoring of PE-X Semi-finished Products, Kunstst. Int., 4, 49–53, 2015.
Markley, J. L., Horsley, W. J., and Klein, M. P.: Spin-Lattice Relaxation Measurements in Slowly Relaxing Complex Spectra, J. Chem. Phys., 55, 3604–3605; https://doi.org/10.1063/1.1676626, 1971.
Meiboom, S. and Gill, D.: Modified spin–echo method for measuring nuclear relaxation times, Rev. Sci. Instrum., 29, 688–691, https://doi.org/10.1063/1.1716296, 1958.
Netto, A. M.: Advances in Single-Sided NMR of Polymer and Cultural Heritage Science, PhD Thesis, Shaker publishing house, Aachen, 2014.
Osswald, T. A., Baur, E., Brinkmann, S., Oberbach, K., and Schmachtenberg, E.: International Plastics Handbook, Carl Hanser publishing house, Munich, 919 pp., https://doi.org/10.3139/9783446407923, 2006.