the Creative Commons Attribution 4.0 License.
the Creative Commons Attribution 4.0 License.
 | 27 Mar 2018
Isolated sensor networks for high-voltage environments using a single polymer optical fiber and LEDs for remote powering as well as data transmission
Jakob Fischer
Timo Schuster
Christian Wächter
Michael Luber
Juri Vinogradov
Olaf Ziemann
Rainer Engelbrecht
Many applications in high voltage or explosive environments require sensors which are electrically isolated from other components of a system. These sensors need remote powering as well as wireless or isolated data transmission links. A possible solution can be based on optically powered optical sensor links. These typically employ four different photonic components: for the data communication a fast LED as a transmitter and a photo diode as a receiver, furthermore for sensor powering a high-power light source and a photonic power converter. Additionally, two optical fibers are required for optical remote powering and the optical data link. In this paper we demonstrate an optically powered optical sensor link using only low-cost high-brightness LEDs and a single polymer optical fiber (POF) for all of these tasks. Coupling efficiencies, power transmission and modulation bandwidths are analyzed for LEDs with different colors. Potentials for many mW of electrical remote powering and Mbit s−1 sensor data links are demonstrated over 10 m of POF. This approach can be used for almost any electronic sensor with moderate power requirements.


Electronic sensors are the most versatile, mature and in most cases the most cost-effective solutions for the vast majority of applications. Examples include sensors for temperature, strain, pressure, position, humidity, magnetic fields, acceleration, and proximity, to name a few. Electronic sensors can be mass-produced and packaged by technologies used in the semiconductor industry. However, for many applications it is mandatory to electrically isolate any sensor from other parts of a larger system. This is typically required in high-voltage environments or in order to reduce electromagnetic interference (EMI) in the vicinity of strong electromagnetic fields. Application examples are voltage and temperature monitoring for high-power semiconductors like insulated-gate bipolar transistors (IGBTs) which are widely used in converters for power electronics and future energy grids, or patient monitoring systems in magnetic-resonance imaging (MRI). These and other applications could benefit greatly from a simple and cost-effective method to galvanically isolate almost any electronic sensor by using a simplex polymer optical fiber as presented in this paper.
There are two challenges to be solved for electrically isolated sensors: supply with electrical power and transmission of the sensor data. Power supply can be achieved by various methods: batteries, energy harvesting with thermoelectric generators and piezoelectric crystals, or photodetectors to generate power from an external light source. These solutions have distinct disadvantages like regular battery replacement or providing external energy from the ambience in a reliable manner. The transmission of sensor data can also be done in different ways like wireless radio links, electromagnetic near-field coupling or free-space optical links.
Our solution is to provide energy and transmission of sensor data over the same optical fiber. By applying simple mass-produced LEDs as light sources as well as optical detectors, a very cost-efficient solution is provided, enabling very compact sensor units. Finally, the use of polymer optical fibers (POFs) enables a low-cost and flexible installation in the field without tedious pre-planning of every single cable, which is nevertheless possible for large-volume applications. After a brief introduction to the principles, important results of the LED characteristics for this particular application are shown. Finally, we demonstrate a galvanically isolated sensor network using this technology. Compared to Fischer et al. (2017), we present extended calculations of the coupling efficiency as well as bandwidth measurements, for the first time.
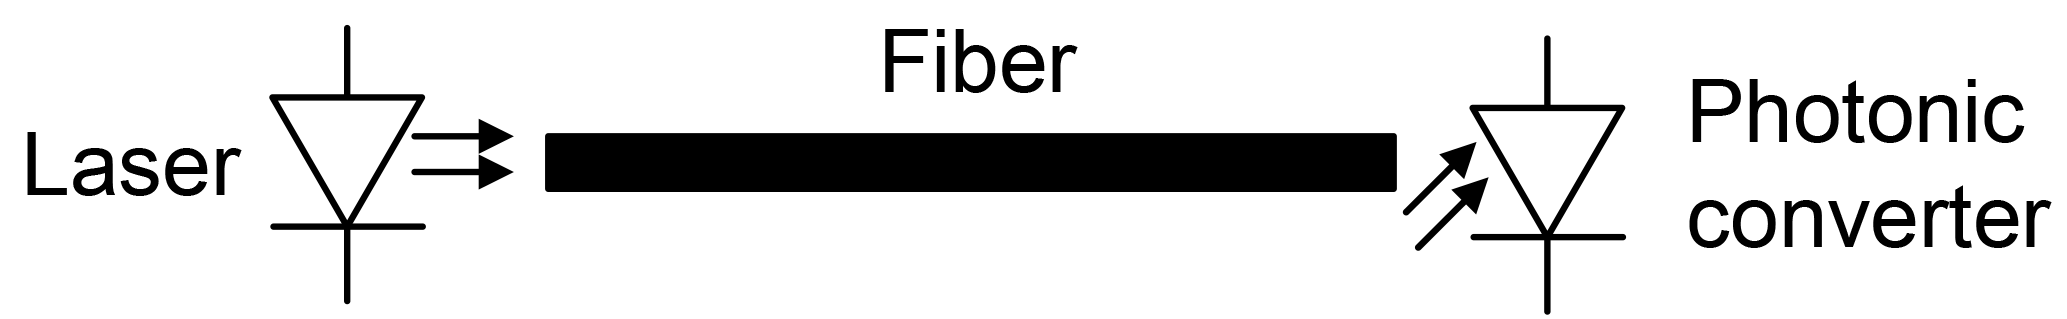
The idea of using an optical fiber to transmit power in the form of light and converting it back into electrical energy is a well-known technology called power over fiber. Already in the late 70s a method for remote-powering a sound alerter with an optical fiber was presented by DeLoach et al. (1978). The basic principle is shown in Fig. 1. A light source, usually a highly efficient near-infrared laser diode (LD), generates optical power. This power is transmitted by an optical fiber to a photonic power converter (PPC), converting it back into electrical power. A PPC can be thought of as a mini solar cell, which is essentially one or more semiconductor photo diodes on a single substrate, optimized for efficient current generation. For these conventional systems operating in the near infrared at typical wavelengths of 830, 940 and 1480 nm (Werthen, 2006), optical fibers made of silica glass are used mostly because of their low attenuation on the order of a few dB km−1. Such infrared high-end systems can provide an electrical power of a few hundred milliwatt (Peña et al., 1999) up to several watt (Werthen, 2008). However, the attenuation of silica fibers is larger by an order of magnitude in the visible range of light as used in this paper and as shown later in Table 1.
To save costs and especially for devices with lower energy consumption by using low-power microelectronics, several approaches using an LED as a light source and POFs for power transmission have been shown recently (Klüher et al., 2015; Poisel et al., 2013). POF-based optical links are limited in the achievable range to several tens of meters by their relatively high optical attenuation on the order of 100 dB km−1. When using a standard POF made of polymethylmethacrylate (PMMA), the lowest attenuation is provided at visible wavelengths. With their large diameter of 1 mm and high numerical aperture, efficient light coupling of POF with low-cost high-brightness visible-light LEDs is possible as discussed in Sect. 3.1, which would not be feasible with glass fibers. The flexibility, ease of handling and robustness of a POF together with the low cost and high meantime to failure (MTF) of an LED, compared to a high-power laser diode, outweighs the range limitations of the LED/POF system compared to a laser/glass fiber system for lower-power requirements.
To realize an electrically isolated electronic sensor system, an additional optical link for transmission of the sensor data is required as shown in Fig. 2. This could be realized by a separate optical fiber in a duplex or two-fiber concept offering the best performance. Alternatively, optical couplers in a bidirectional simplex or splitter concept with one fiber can be employed, losing some power in the splitters either for power supply or data transmission. These state-of-the-art systems require not only two fibers or optical splitters, but also four distinct and specialized photonic components like a highly efficient light source (LED, LD), an optimized photonic-converter (PD), an optical data transmitter (LED, LD) and an optical receiver (PD), finally.

Figure 2Current concepts for remotely powered sensor systems with four distinct photonic components.
In our concept, cost is saved by using a standard LED not only as a light source, but also as a photo diode, too. Even if an LED is optimized to emit light, it is still a semiconductor with a p-n junction like any other photo diode. Therefore, an LED can be used as a photo diode, i.e., as a receiver for data transmission as well as a converter for remote powering (Katsande et al., 1998; Lange et al., 2015; Mims, 1973). By temporal multiplexing between these two operational modes of an LED, only a single optical fiber between two identical LEDs can be used for remoting almost any electronic sensor circuit with a moderate power consumption, as shown in Fig. 3. This concept requires only one fiber from a central unit to a distant sensor node, without optical splitters, which saves additional costs and makes star topology sensor networks easy to implement as demonstrated in Sect. 4.

Figure 3New concept using identical LEDs as power source and data receiver as well as power converter and data transmitter.
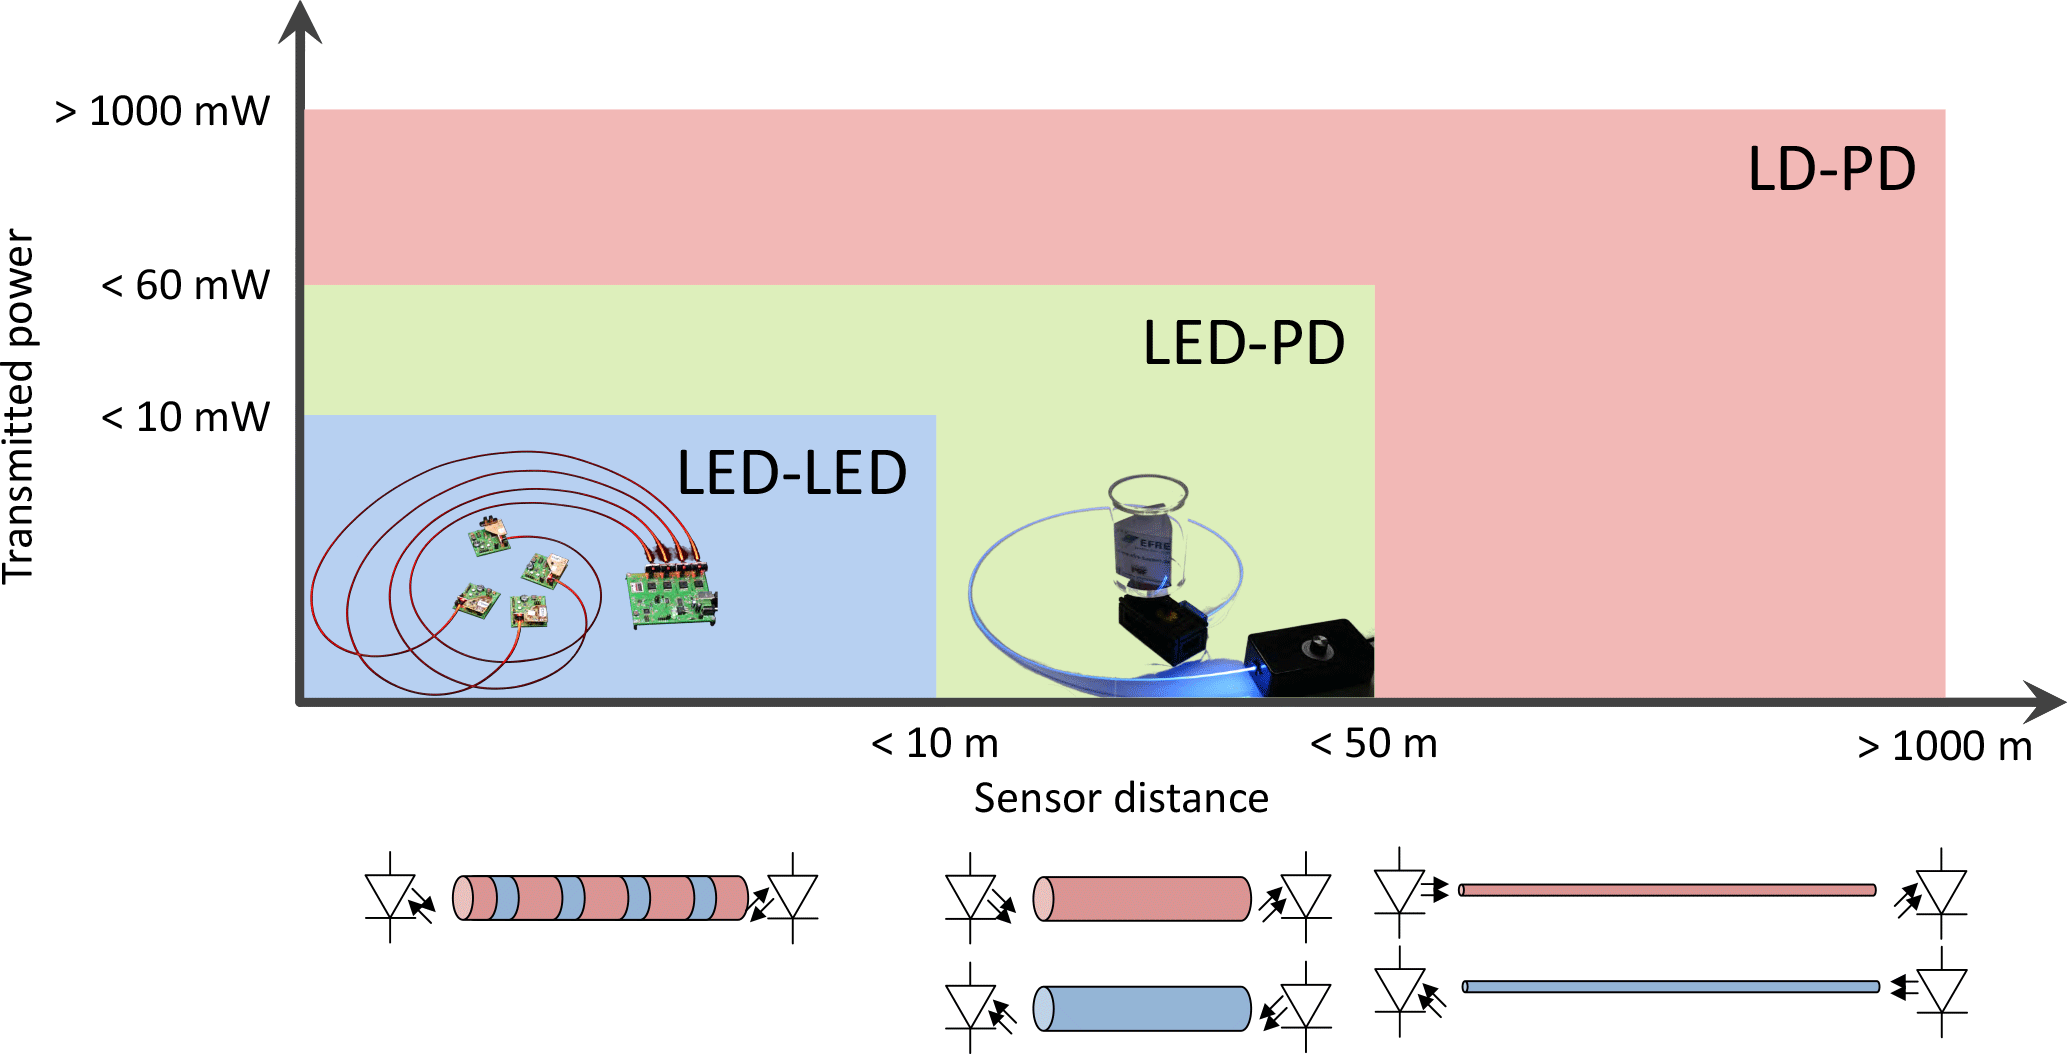
One limitation of a system using LEDs only is their low efficiency when used as a photo detector. Figure 4 shows a coarse comparison of the distance and power ranges of systems using a combination of laser diode and photo diode with silica glass fibers (LD-PD; Werthen, 2006), of systems using a combination of an LED and a dedicated photo diode with polymer fibers (LED-PD) based on results from their own measurements, and of systems using an LED as a transmitter as well as a receiver (LED-LED) as presented in this paper. Clearly, the system described here is best for applications with low power requirements (< 10 mW) and short lengths (< 10 m). Even if this solution does not provide a very high efficiency, it can offer easy mass production and the use of a lower number of components.
To realize an efficient system at reasonable costs, characterization and comparison of different LEDs are required. Depending on the operation mode (as power source, as power converter, as data transmitter or as data receiver) it is necessary to know various characteristics of these LEDs. Parameters for the unusual operation as a photo detector are not provided by LED manufacturers. For five different LEDs (royal blue, blue, green, red-orange and red) these characteristics have been determined and are shown in the next subsections. These different LEDs are all produced by Cree and are of the same series. The central emitting wavelengths are in the visible range between 450 (royal blue) and 650 nm (red). The royal blue, blue and green LEDs are gallium nitride based LEDs, while the red-orange and red LEDs are gallium phosphide based LEDs. The color is determined by semiconductor alloy composition and additional dopants; no color-converting fluorescent dyes are used on top of these LED chips.
3.1 Coupling efficiency between LEDs and fibers
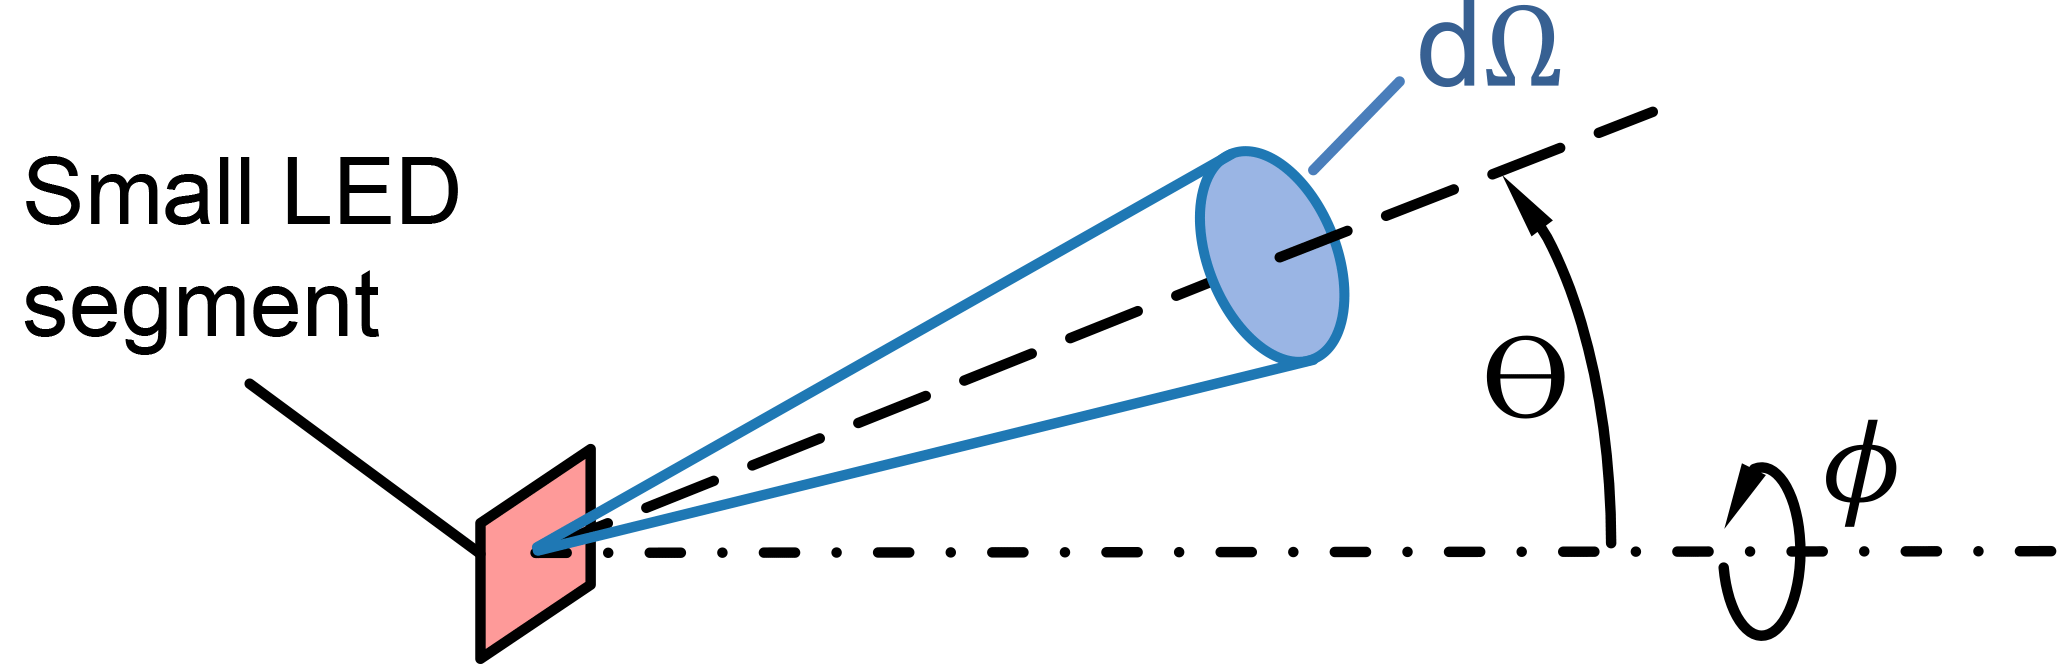
Figure 5Definitions of the azimuthal angle Θ, polar angle ϕ and differential solid angle dΩ for the light emission of a small LED segment.
To provide as much light as possible to the sensor node, an efficient coupling into the fiber is required. An LED has generally a Lambertian radiation pattern of its radiant intensity I (power per unit solid angle) as given by
with the azimuthal angle Θ as defined in Fig. 5. The maximum radiant intensity I0 is determined by the total emitted power P0. For efficient fiber coupling an optical fiber with a high acceptance angle Θmax and a large core diameter is required. Θmax is the maximum angle subtended to the fiber axis of light coupled into the fiber to be guided. Above this angle there is no longer a total reflection inside the fiber anymore, resulting in very high propagation losses. The acceptance angle of a fiber is usually characterized by its numerical aperture NA from basic fiber principles as defined in Eq. (2):
where nco and ncl are the refractive index of the fiber core and cladding, respectively. na is the refractive index of the surrounding air which is readily neglected in all further calculations by using the common approximation na≈1.
There are different types of optical fibers, like single-mode silica glass fibers (SMFs), multi-mode glass fibers (MMFs), hybrid polymer/glass fibers (plastic-clad silica, PCS) and multi-mode polymer optical fibers (POFs; Ziemann et al., 2009). The polymer optical fiber used in the prototype system has a large outer diameter of 1 mm, a core diameter of 980 µm and a high NA of 0.5 (referred to as a 1 mm standard POF). These properties outweigh the disadvantages of this fiber type, like a higher attenuation compared to silica multi-mode and single-mode fibers, if typical sensor link lengths of up to 10 m are taken into account. Due to the low bandwidth of the LEDs themselves (see Sect. 3.5), the limited bandwidth of the POF does not play a significant role for this application as well.
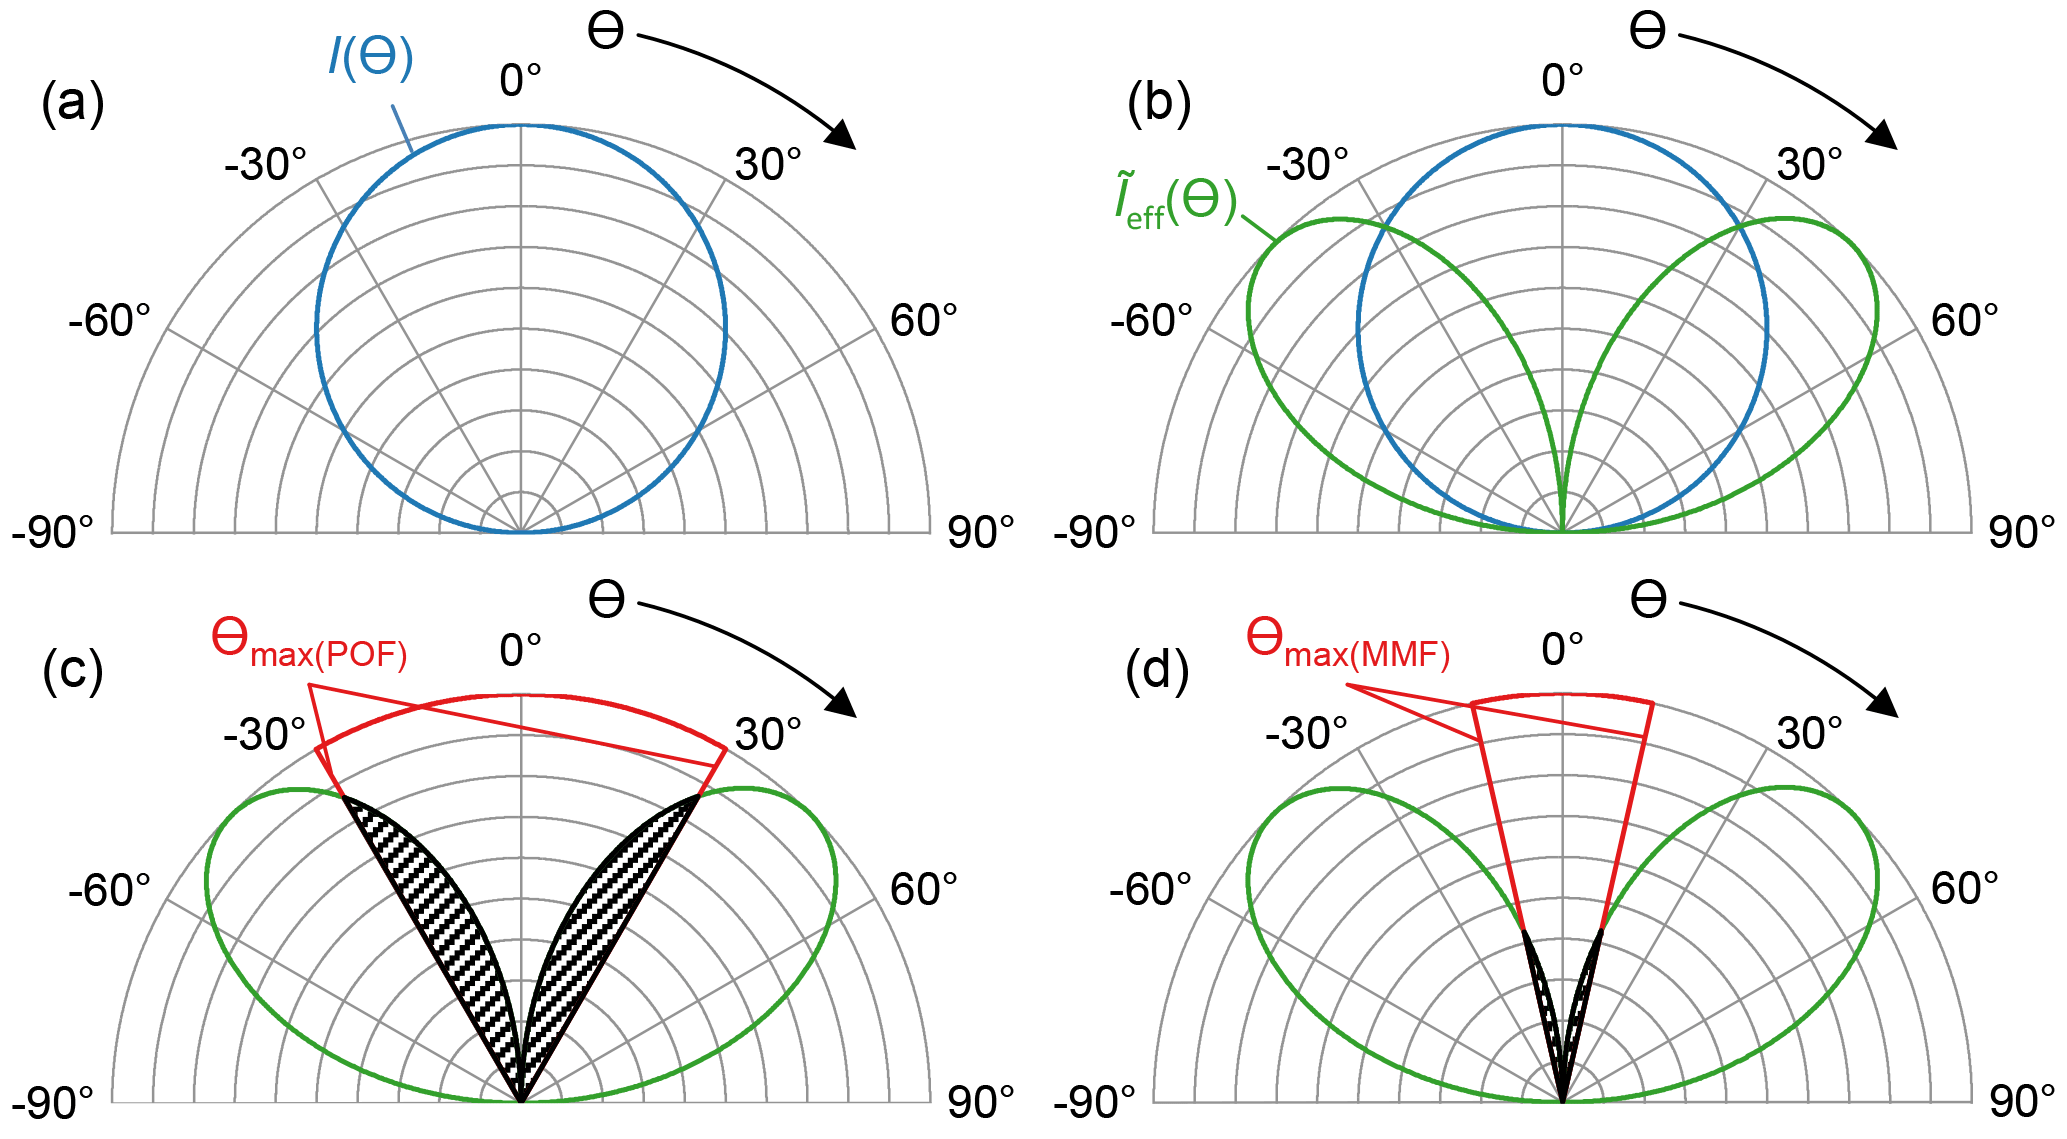
Figure 6Graphic representation of the coupling efficiency regarding the acceptance angle: (a) blue line: Lambertian radiation pattern of the LED I(Θ); (b) green line: normalized effective radiant intensity (Θ) of the LED; (c) hatched area: fiber-coupled power PF for a POF with NA = 0.5 limited by the corresponding acceptance angle (red line); (d) hatched area: fiber-coupled power for a silica multi-mode fiber (MMF) with NA = 0.22 (red line).
Figure 6 illustrates the impact of the acceptance angle on the angular coupling efficiency ηangle which is defined as the ratio of the fiber-coupled power PF to the emitted power P0 of a small LED segment. To calculate PF the radiant intensity pattern given in Eq. (1) has to be integrated over a solid angle Ωmax of a cone with the acceptance angle of the fiber Θmax as apex angle:
where Θ is the azimuthal angle and ϕ is the polar angle as shown in Fig. 5. The expression I0 cosΘ sinΘ represents a polar angle integrated or effective radiant intensity shown in Fig. 6b normalized to its maximum, there. From this quantity only those parts within the acceptance angle Θmax contribute to the fiber-coupled power PF. For a 1 mm standard POF with a typical NA =0.5 or Θmax= 30∘, and a representative silica MMF with NA =0.22 or Θmax= 12.7∘, the fiber-coupled power PF is represented by the hatched areas in Fig. 6c and d. The integration in Eq. (3) can be solved analytically, yielding
Finally, the angular coupling efficiency ηangle is now simply given by
resulting in ηangle= 25 % for the POF and ηangle= 4.8 % for the silica MMF.
Additionally, the total coupling efficiency depends on the areal overlap of the LED with the fiber core. Figure 7 illustrates this for an LED with a chip size of 0.92 × 0.92 mm2 as used in this work and a 1 mm standard POF with a core diameter of 980 µm, as well as a silica MMF with a core diameter of 200 µm for comparable structural flexibility. Assuming close-distance butt coupling, this yields an areal coupling efficiency of ηarea= 83 % for a POF and ηarea= 3.7 % for the MMF, respectively. Finally, the theoretical maximum coupling efficiency is given by the product of angular and areal efficiency. With ηtotal= 21%, the maximum coupling efficiency to a POF is 2 magnitudes larger as compared to a silica MMF with ηtotal= 0.18 %. Interestingly, these maximum values given by the LED size and the fiber parameters can not be improved further by any optical system because of the preservation of the etendue of a light beam, which is the product of its cross section and its solid angle of divergence or convergence. Clearly, the use of a POF gives significantly more transmitted light power from LED sources for fiber lengths of up to at least a few tens of meters, before the advantage of less attenuation prefers silica fibers. The break-even length l up to which the POF has its benefits compared to silica fibers depends on the spectral attenuation coefficient α of the fibers and, thus, on the wavelength of the LEDs as shown in Eq. (6):
For the measured LEDs these break-even lengths between a representative silica multi-mode fiber (core diameter: 200 µm; NA=0.22) and a standard polymer fiber (core diameter: 980 µm; NA=0.5) are shown in Table 1.
Table 1Maximum lengths for which the POF benefits over silica fibers. Attenuation data POF: Toray PFU-CD1001-22E (αPOF); attenuation data MMF: Thorlabs FG200LEA (αMMF).
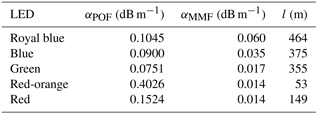
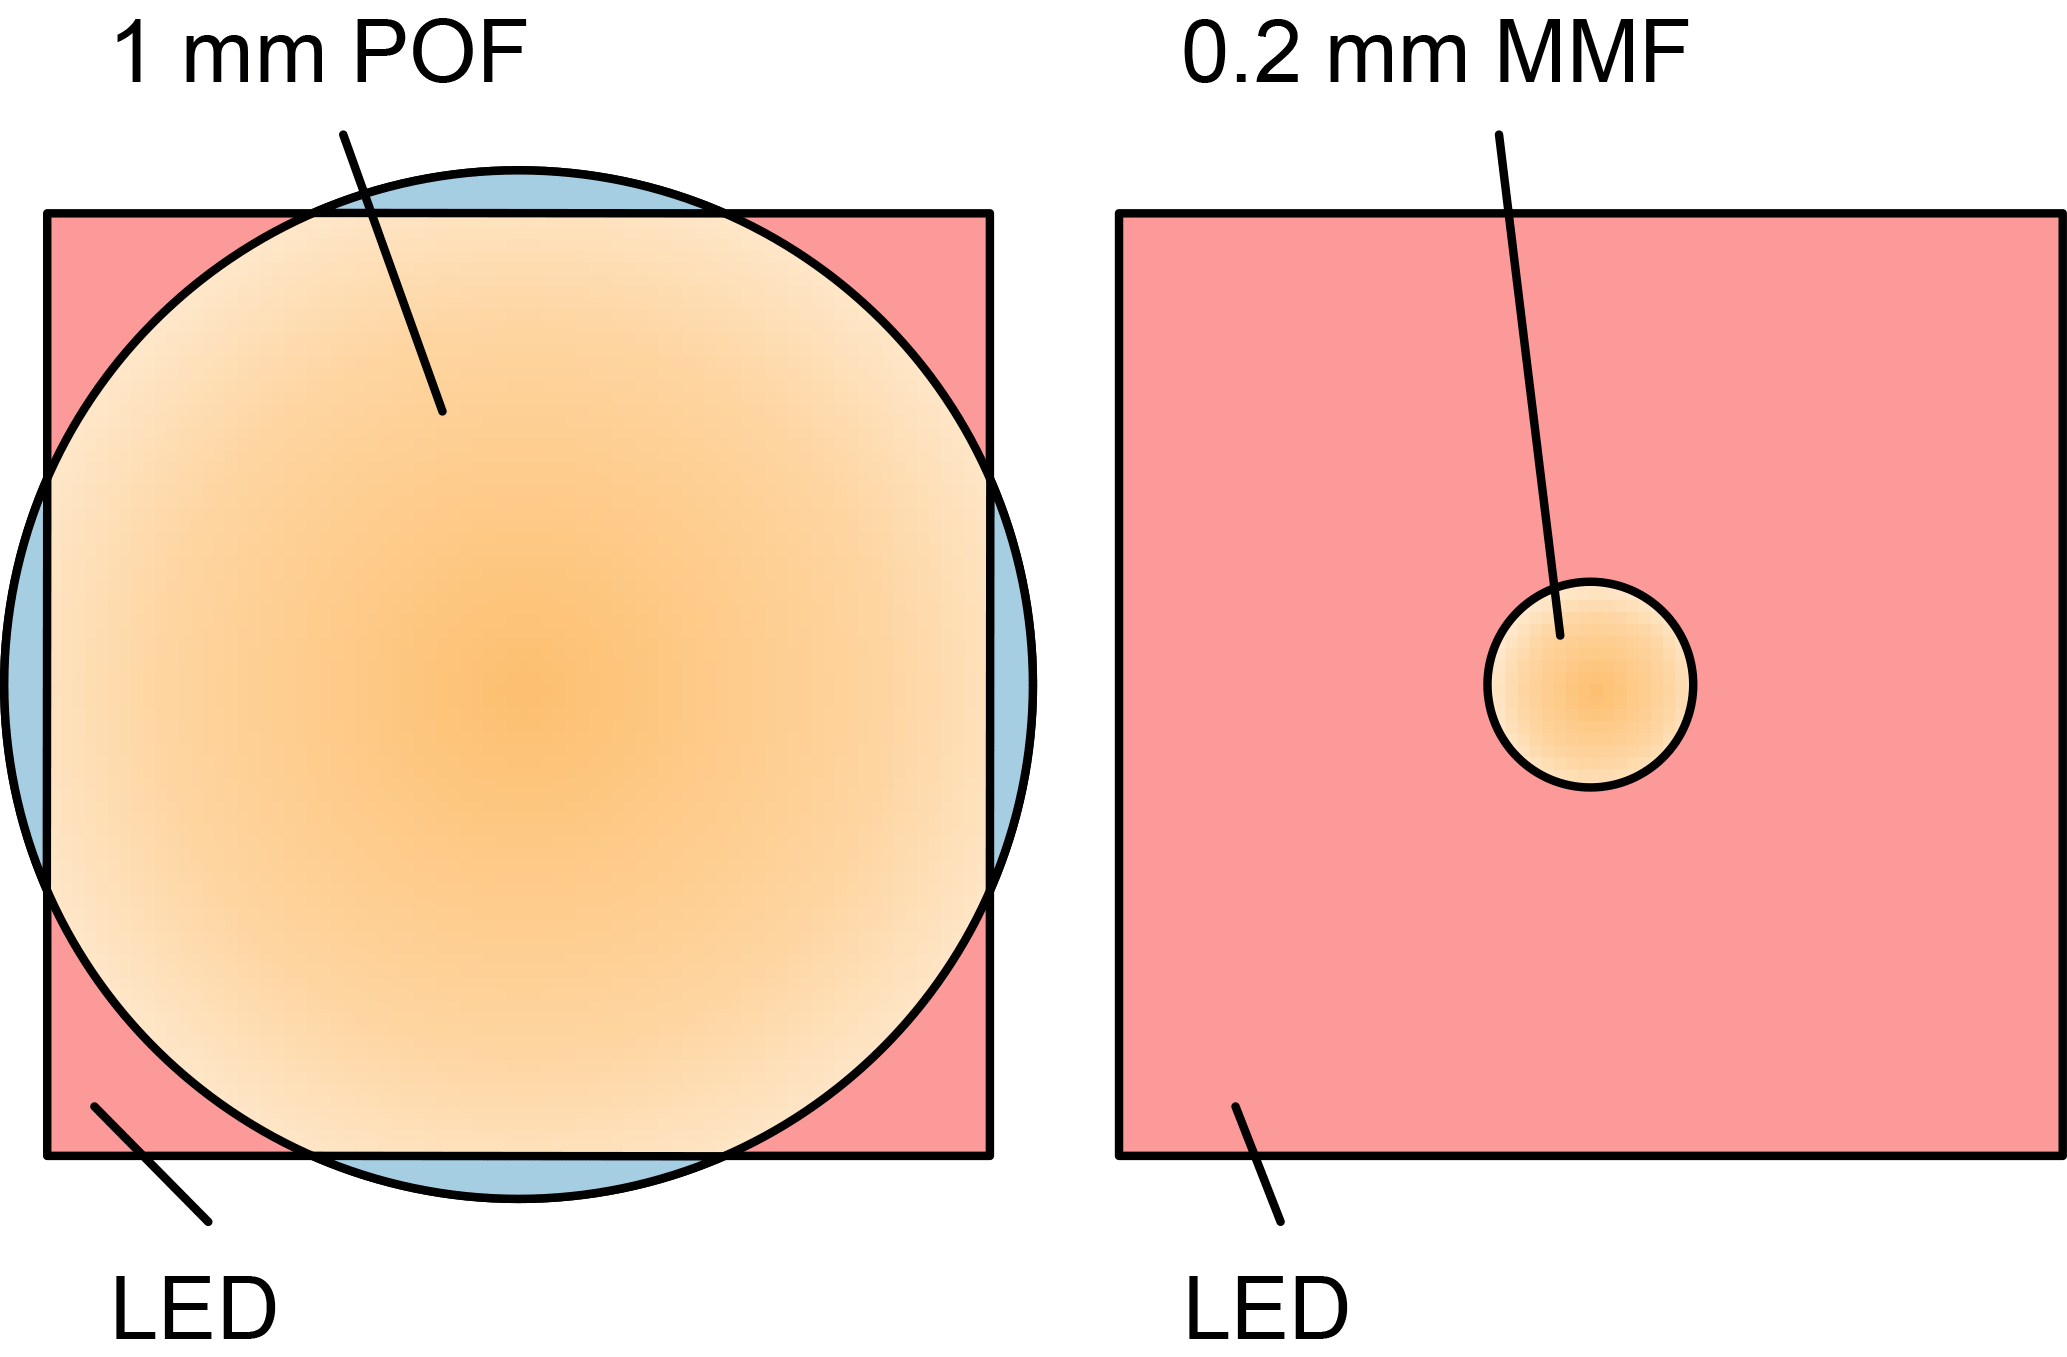
Figure 7Graphic representation of the coupling efficiency of a 0.92 × 0.92 mm2 LED to a fiber regarding the core diameter. Left: core ∅=980 µm. Right: core ∅= 200 µm.
Table 2LED total power, fiber-coupled power into a standard 1 mm POF (NA = 0.5) and coupling efficiency of the measured LEDs (Wächter, 2017).
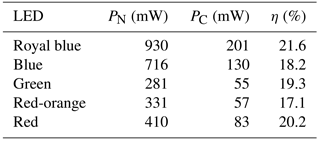
Since these calculations do not include losses due to limited fiber end-face preparation quality, attenuation of the fiber, Fresnel reflections on the fiber's end-faces, and a non-zero distance between LED and coupled fiber, an experimental verification is required. To calculate the coupling efficiency η, the optical power PN of the LED at a typical current was measured and compared with the measured fiber-coupled optical power PC after a reference length of 1 m of a POF. Results for five LEDs from the same series made by Cree with different emission wavelengths are shown in Table 2. The measured coupling efficiency is close to the theoretical limit of 21 % calculated above, with even higher measured values which might come from a more directed radiation pattern and from tunneling modes inside the fiber, which are still present after a short fiber length as well, even if they are non-guided rays (Snyder and Love, 2000). The coupling efficiency is almost the same for all LEDs, but due to the higher optical power of the royal blue LED it provides up to 4 times higher fiber-coupled power compared to the other LEDs.
3.2 Mutual responsivity
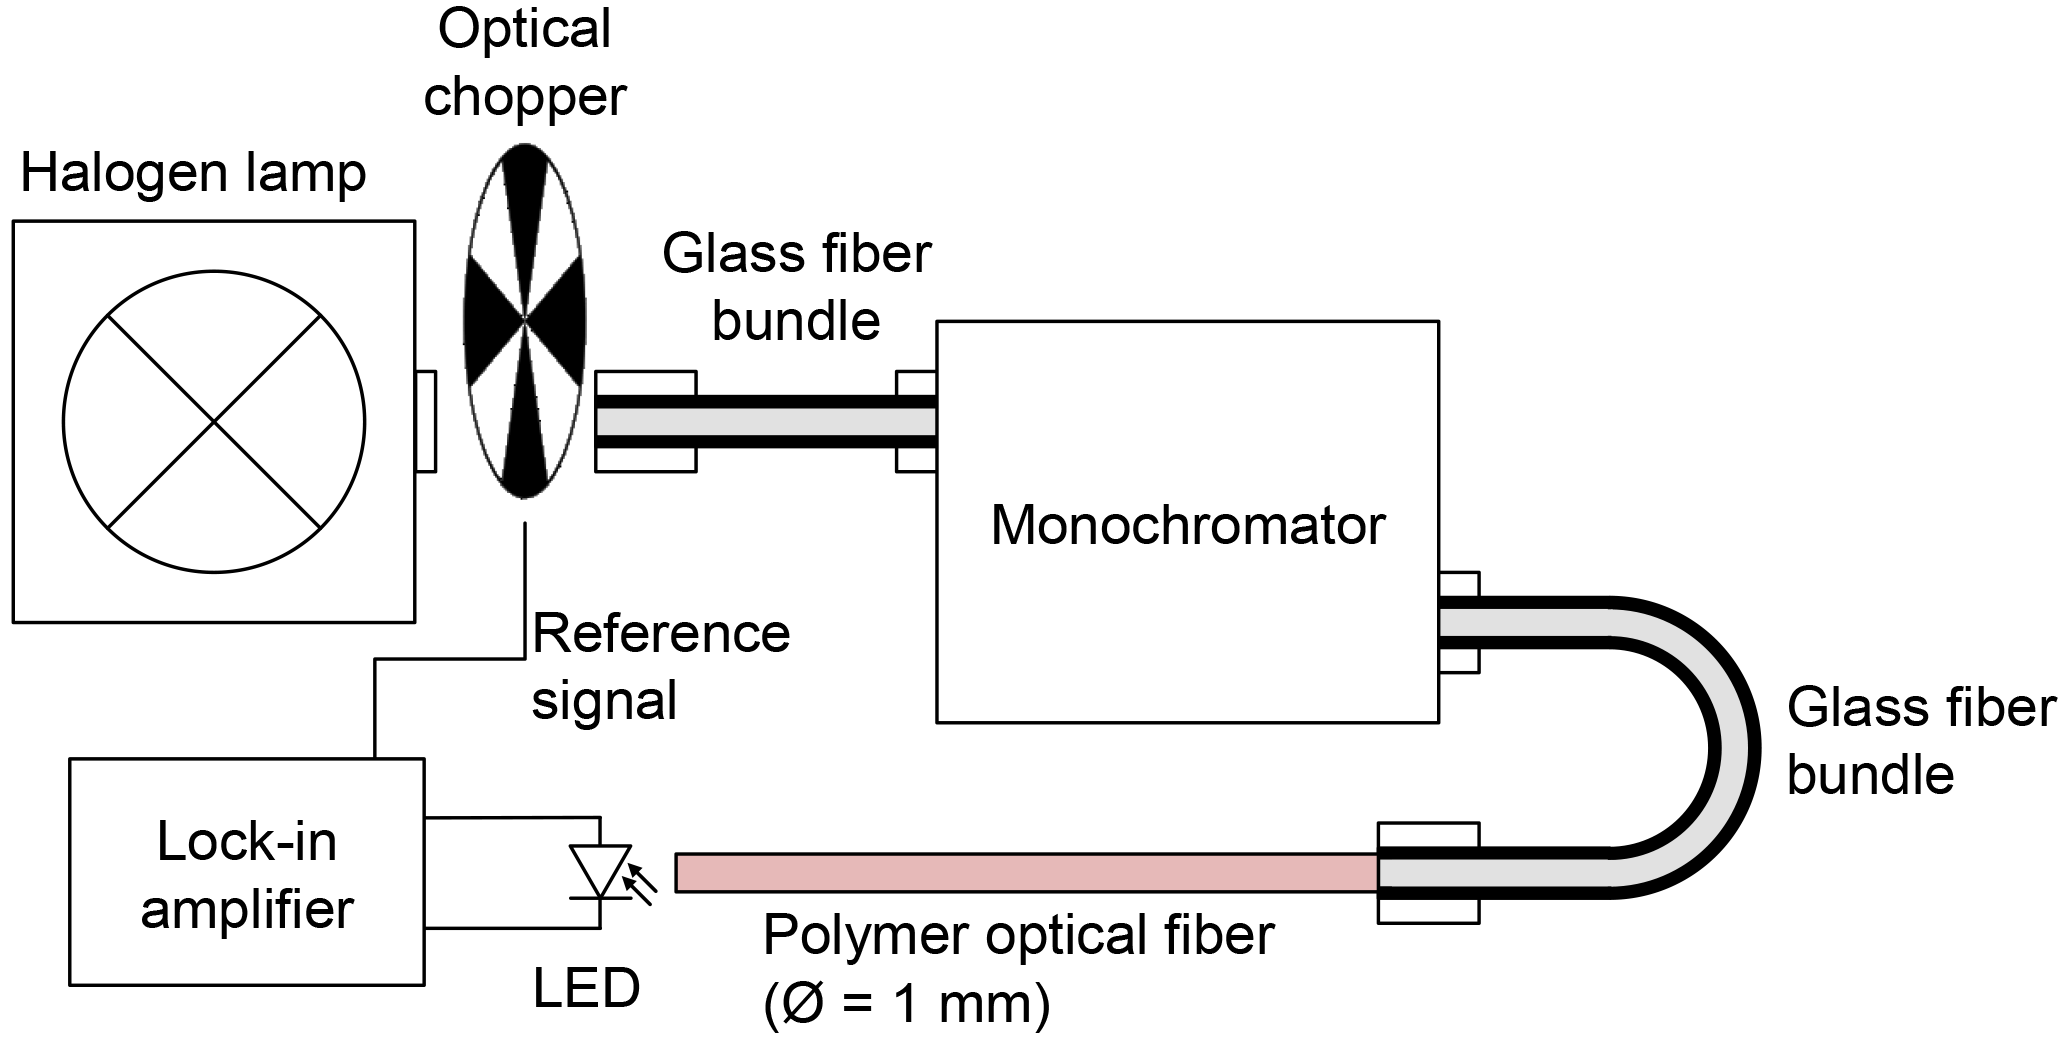
Another important parameter for powering the sensor nodes is the sensitivity of the LEDs to their own emitted light spectrum when operated as photo detectors. This so-called mutual responsivity of the LEDs gives an indication of the maximum current available for any connected sensor electronics. To determine the mutual responsivity, the spectrally resolved radiant power Φ(λ) of the LED has to be measured at first, using a broadband spectroradiometer. This is compared with the spectral responsivity R(λ) of the LED as photo detector. This is measured by using a halogen lamp and a monochromator for narrow-band illumination with adjustable wavelengths. Then the light is guided to the receiving LED using a POF. To enhance the signal-to-noise ratio, an optical chopper was used to modulate the light and a lock-in amplifier is used to detect the LED photo current as shown in Fig. 8. The photo current for different wavelengths can be compared with a calibrated detector in the same setup as a reference, yielding the spectral responsivity of the LED. The results for the spectral responsivity R(λ) and the spectrally resolved radiant power Φ(λ) for the different LEDs are shown in Fig. 9. These two traces give a range of mutual absorption of the LED as depicted by the hatched areas, where photons generated from one LED are converted to charge carriers and, thus, a photo current in another LED of the same type.

Figure 9Spectral responsivity and spectrally resolved radiant power of the different LEDs compared to a quantum efficiency of 60, 80 and 100 %. The hatched area gives a visual indication of the range of mutual absorption calculated by Eq. (7). (a) Royal blue LED; (b) blue LED; (c) green LED; (d) red-orange LED; (e) red LED.
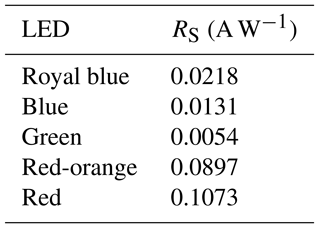
This measurements indicates two important conclusions. First, the peak responsivity of an LED, designed only for light emission, can be surprisingly high. For the red LED, the maximum value for the responsivity is about 0.36 A W−1 at 580 nm. This corresponds to a quantum efficiency (QE) of 77 %. This is not much worse than the best commercially available dedicated converter components (HAMAMATSU PHOTONICS K. K., 2012). Second, a reasonable amount of one LED's emission can be converted back into electrical energy using another LED of the same type. The hatched ares in Fig. 9 give a visual comparison for the different LEDs, and calculated numbers are shown in Table 3. As a figure of merit we calculate the mutual responsivity RS defined as the ratio between this mutual absorption and the integrated radiant power as described in Eq. (7):
where R(λ) is the spectral responsivity of the LED as photodetector and Φ(λ) is the spectrally resolved radiant power of the LED as a transmitter.
The results for the mutual responsivity of the different LEDs are shown in Table 3. The mutual responsivity is highest for the red and red-orange LED, being larger by an order of magnitude compared to the green-blue types. In principle, this was to be expected, as for the same quantum efficiency and the same spectral overlap more current is generated at longer wavelengths with lower photon energies and, thus, more photons at a given optical power to produce electron/hole pairs. As shown later in Sect. 3.4 this advantage of red or orange LEDs is not strictly valid if the maximum achievable electrical power is discussed due to the higher voltage generated and the higher optical power available from blue LEDs.
3.3 Short circuit current and open-circuit voltage
For the electrical design of the electronics of the sensor nodes as well as for the calculation of their maximum possible power consumption, the LED's maximum short circuit current ISC and open-circuit voltage UOC give a good indication of the maximum transmitted electrical power. A rough estimation of the short circuit current ISCe is given by the product of the mutual responsivity RS and the fiber-coupled power PC of the LEDs (Table 4). For a measurement two LEDs of the same type are connected by a POF of 1 m in length, aligned for maximum coupling. The sending LEDs are operated at their nominal currents. The measured currents are noticeable lower than the theoretically estimated values, as the estimation does not take into account the limited coupling efficiency at the receiving LED.
Table 4Estimated and measured short circuit current and open-circuit voltage.
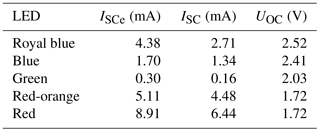
Even though the royal blue LED provides the highest fiber-coupled power, the red LED system has a much higher short circuit current, caused by the higher mutual responsivity, mainly because of the larger number of photons per unit time and area at longer wavelengths at a given optical power. Even if it is not possible to determine the exact available electrical power by this simple measurement, it gives a good indication, since our own measurements have shown, that this power corresponds very well to the product of 90 % of the short circuit current and 90 % of the open-circuit voltage. The higher open-circuit voltage of the royal blue LED does not fully compensate for its lower generated current when discussing the maximum available power in the next section.
3.4 Maximum power point
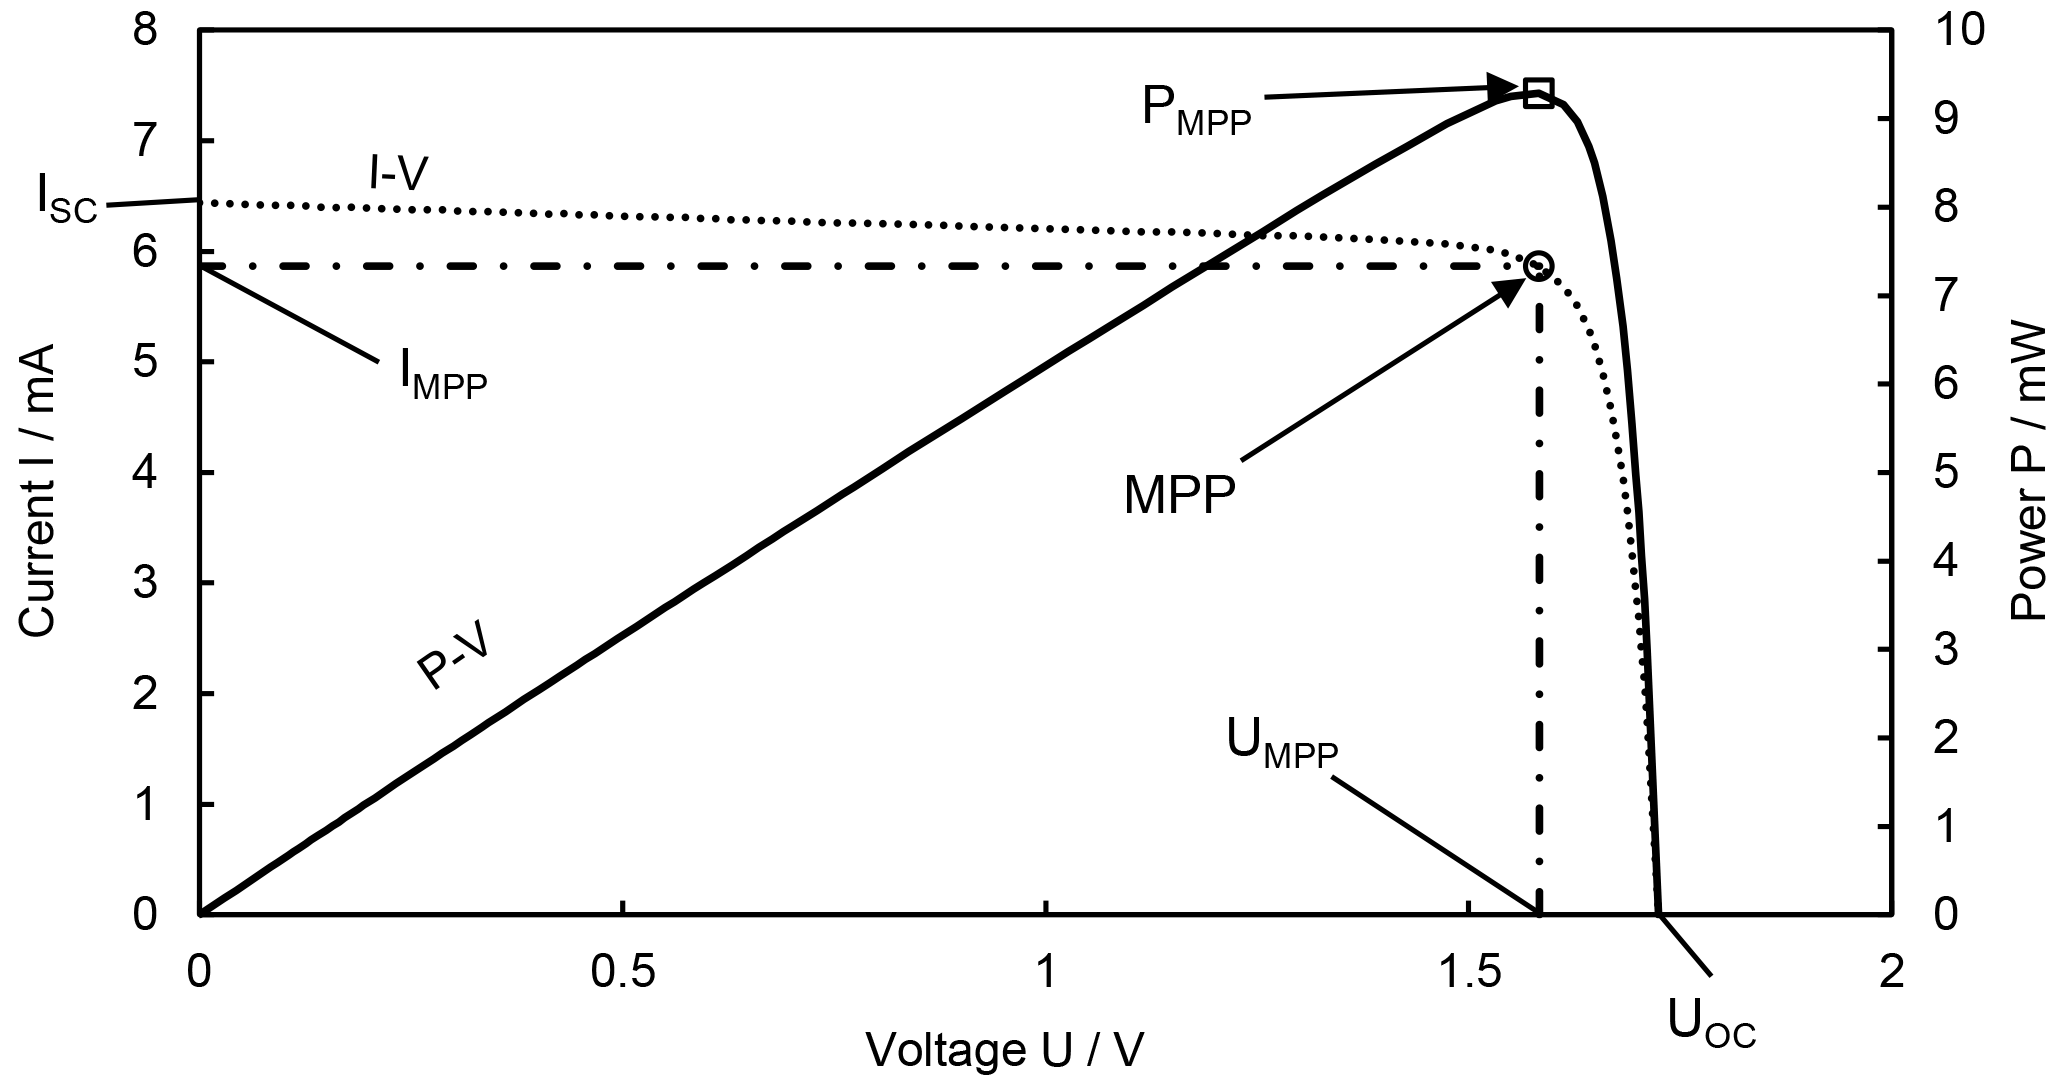
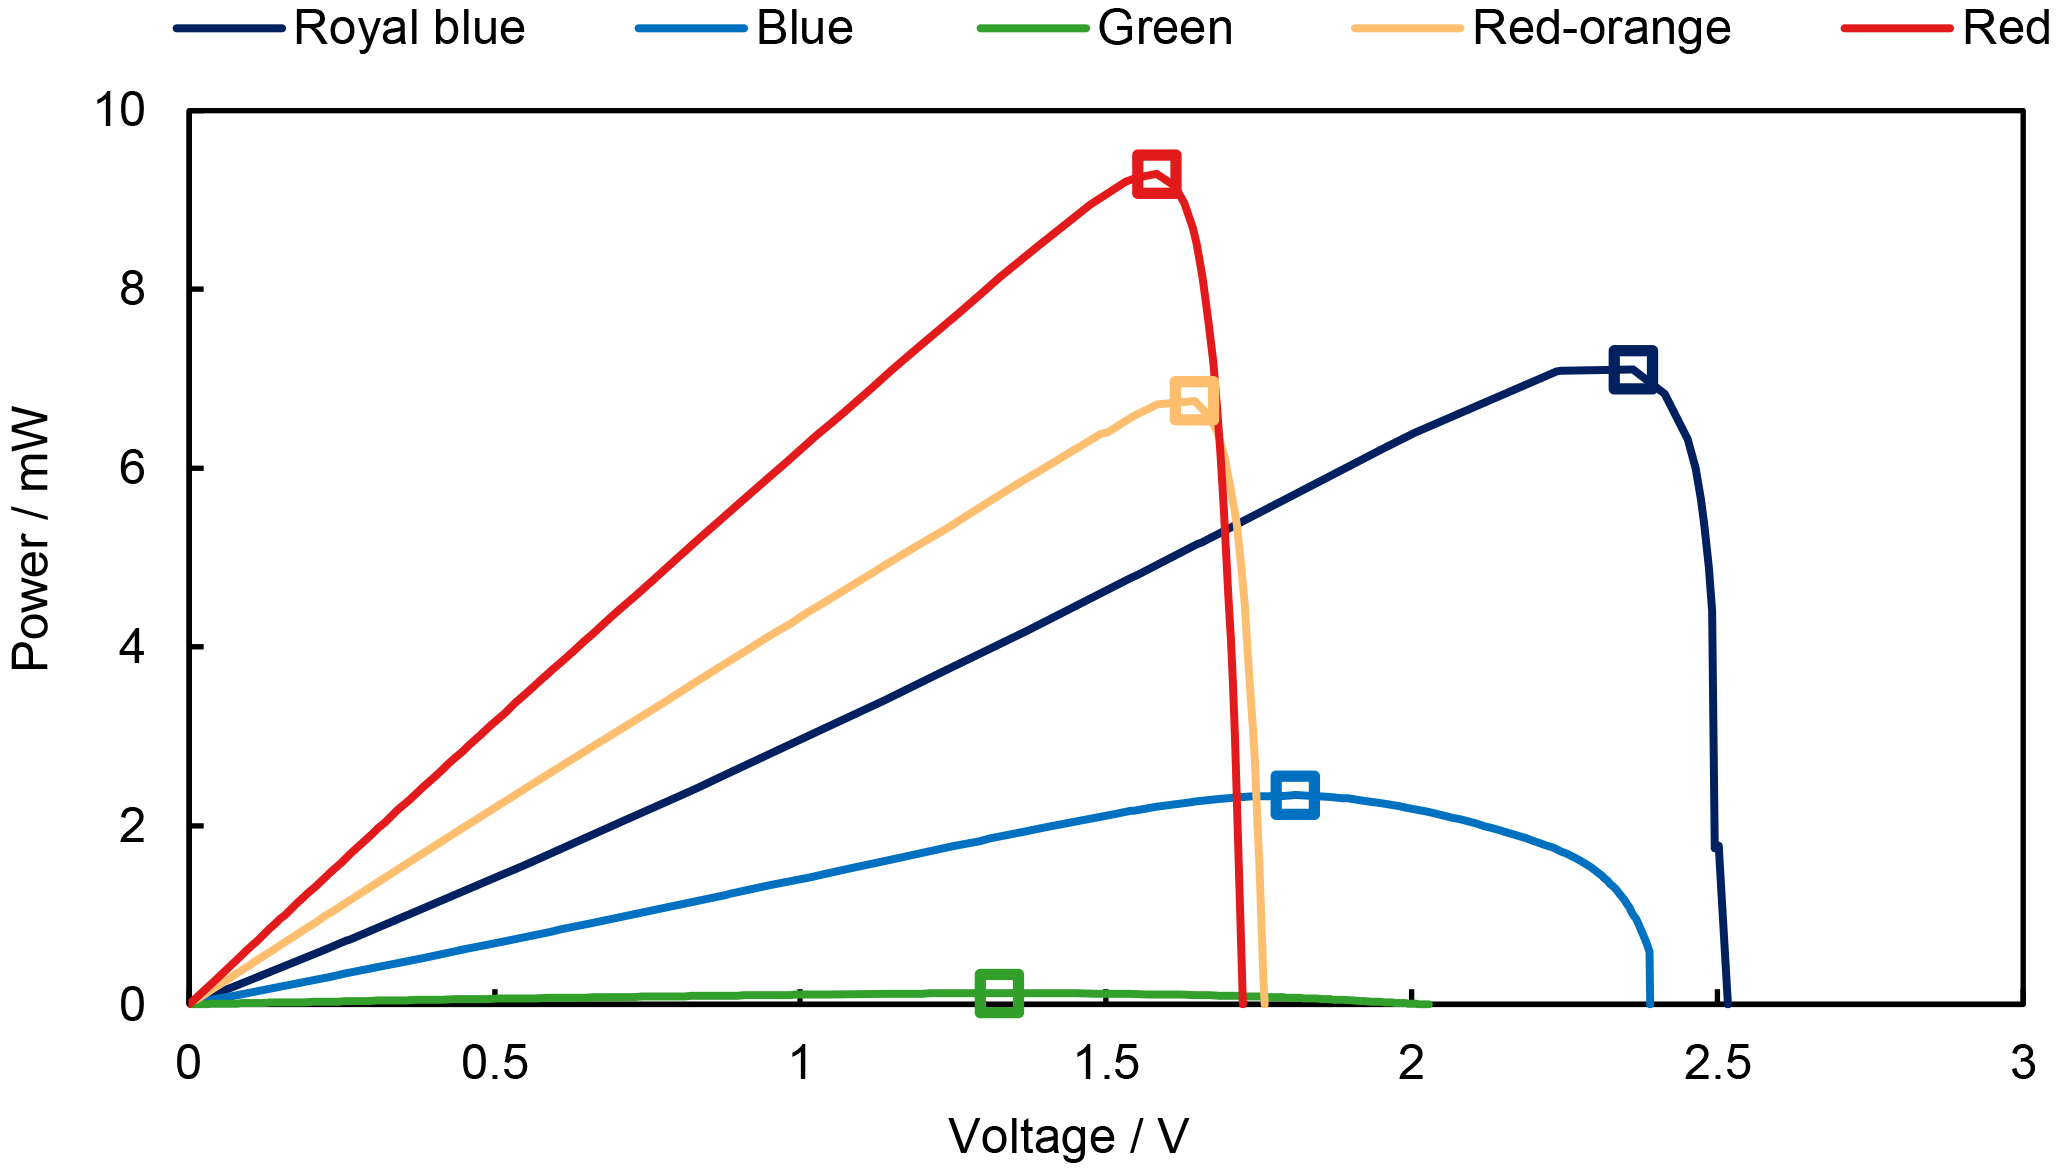
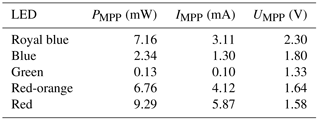
The available electrical power provided by the LED depends on the load. Principally in a linear circuit, if the load resistance is high, the current will drop, while the voltage will not exceed the open-circuit voltage. If the load resistance is too low, the voltage will drop, while the current will not exceed the short circuit current. Deviations are possible for strongly nonlinear devices like an LED operated as a photo diode. The ideal balance between open and short circuit in terms of power is in the maximum power point (MPP). It defines the maximum available power PMPP and is determined by measuring the current-voltage characteristics and therefore the power-voltage characteristics as well. Figure 10 shows for example the measured characteristics of the red LED when illuminated by the same LED in our POF coupled test system. By comparing the power-voltage characteristics in Fig. 11 for different LEDs, it can be seen that even if the maximum current of the royal blue LED is noticeably lower than the current of the red one, the maximum power is only slightly lower. Results for the current IMPP and the voltage UMPP of the maximum power point as well as the maximum power PMPP are summarized in Table 5. With the red LEDs and 1 m of POF in our system, a maximum of 9.29 mW of electrical power can be supplied to an electrical sensor node. This is sufficient for many applications.
3.5 Electro-optical modulation bandwidth
The electro-optical modulation bandwidth of the LEDs gives an indication of the maximum achievable data rate. This is very important for our application. Even if the transmission of the sensor data requires only modest data rates, it affects the time needed for data transfer, during which the sensor node can not be optically powered and has to be operated from previously accumulated energy. For example, using 1 Mbit s−1 instead of 10 kbit s−1 results in roughly a hundredth of the energy that has to be stored at the sensor node. This is important because at present, the effort for remote powering the sensor unit is the main limiting factor for the fiber length and the system performance, and not the signal-to-noise ratio of the data transmission, which in principle is more critical at higher data rates.
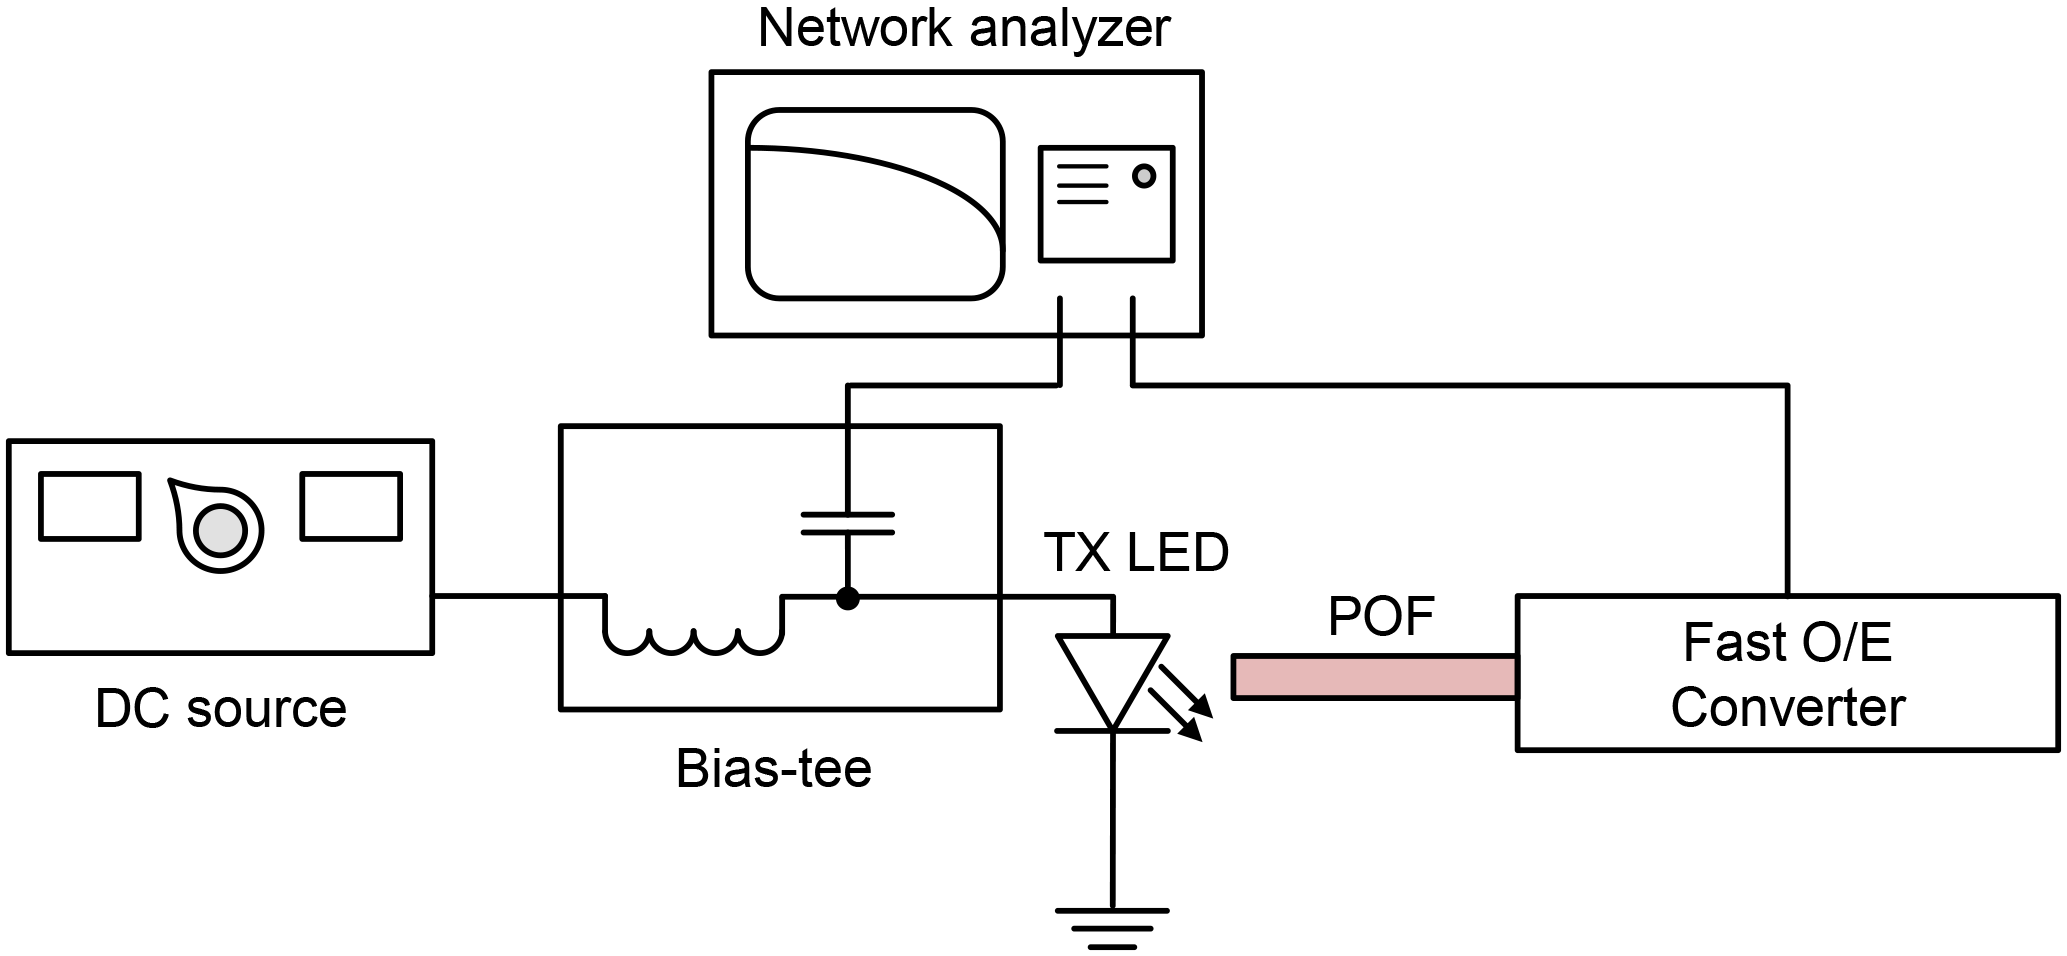
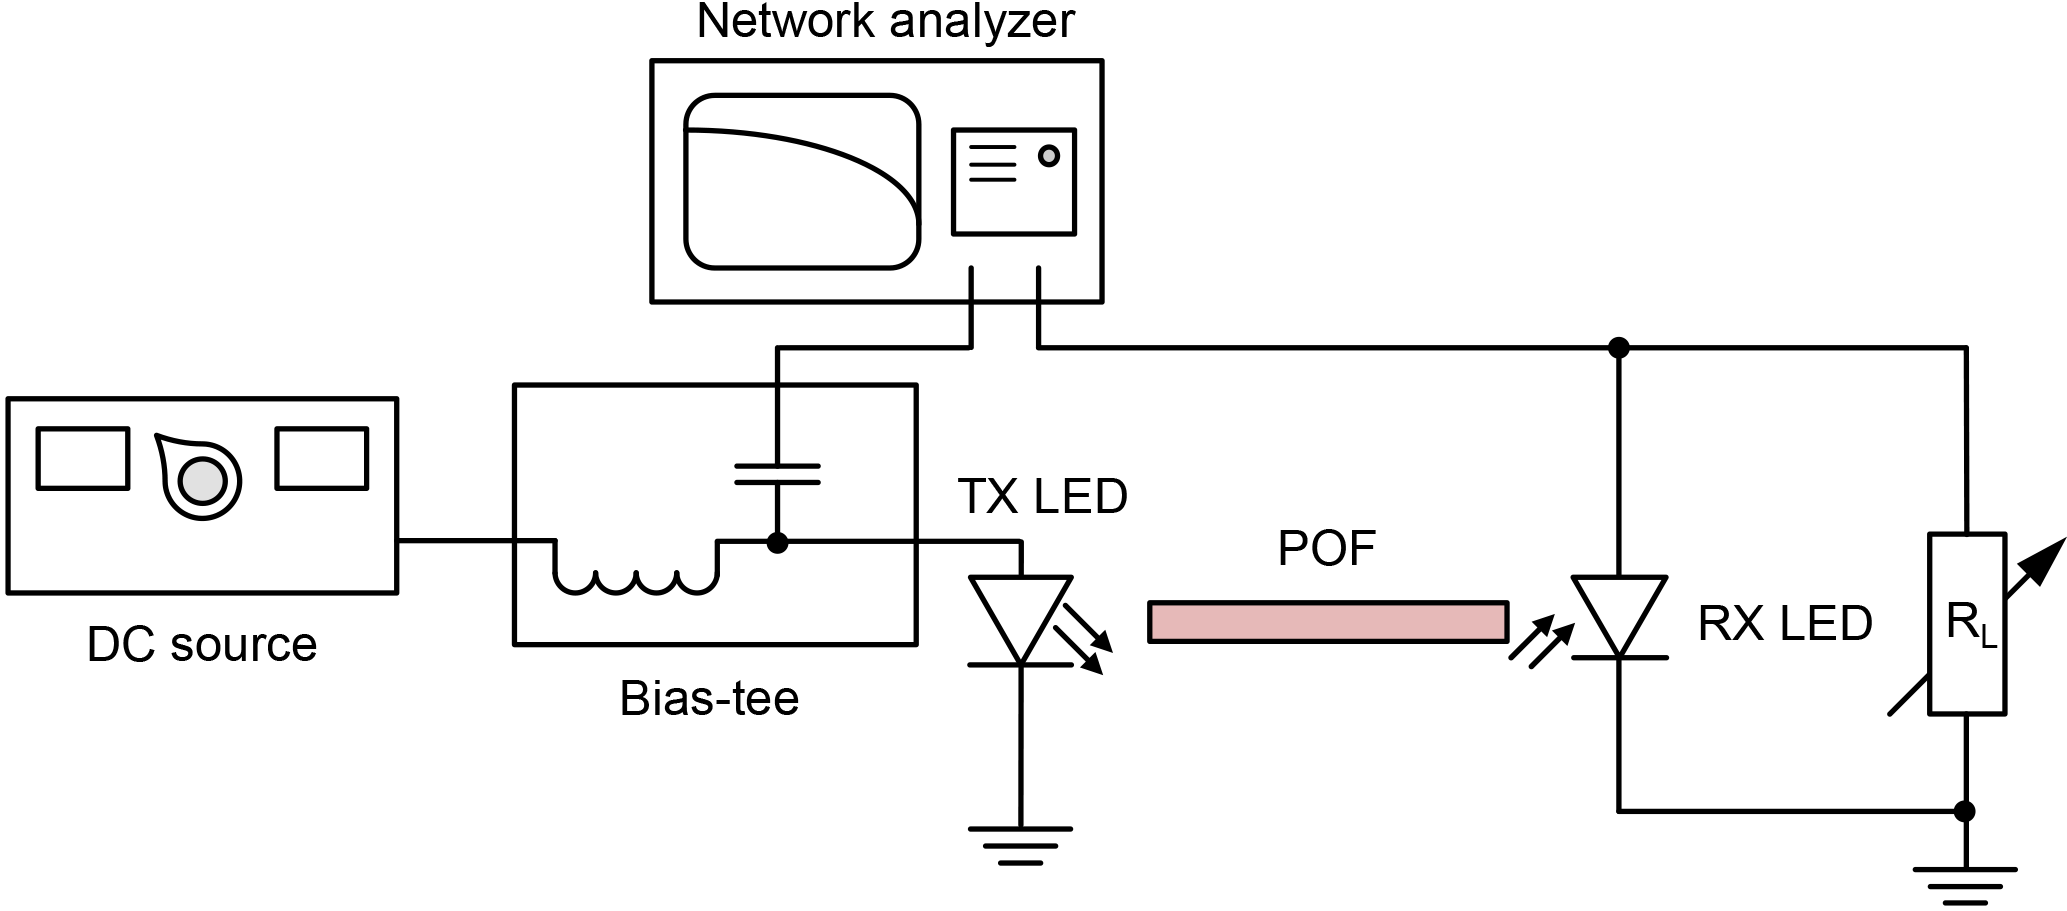
Therefore the bandwidths of the different LEDs were measured as a transmitter at first, using LED bias currents from 10 to 200 mA. The measurement setup consists of a DC source to provide the bias current of the LED using a bias tee. The LED is connected to a fast optical to electrical converter (O/E converter) by a short piece of POF. A network analyzer with a frequency range from 5 Hz up to 3 GHz and a dynamic range of up to 130 dB is used to measure the frequency response in this setup shown in Fig. 12. Since the transmission bandwidth of the used fiber (3 dB bandwidth typically > 1 GHz for 1 m of standard POF) and of the used O/E converter (3 dB bandwidth = 500 MHz) is much higher than the expected bandwidths of the LEDs, the measured frequency responses are determined by the LEDs only. Additionally, the transmission bandwidth of a system consisting of two LEDs of the same type was measured, which is expected to represent the bandwidth of the LEDs as receiver, since the LEDs transmission bandwidth should be much higher than the receiver bandwidth. Therefore the measurement system was modified by using a second LED as a receiver instead of the O/E converter (Fig. 13). The frequency response was measured using different resistors in parallel as a load and the high-Z feature of the network analyzer with 1 MΩ input impedance. This load resistance is expected to influence strongly the bandwidth because of the capacitance of the LED p-n junction in parallel. For these system measurements, a constant DC bias current for the transmitting LEDs (ITx) of 20 mA was used.
The results for three representative LED types (royal blue, green, red) are shown in Fig. 14 with 3 dB bandwidths listed in Table 6. All traces have been normalized to data at the lowest measured frequency (25 kHz for the Tx bandwidth and 500 Hz for the Rx bandwidth). These frequencies are limited by the network analyzer for the Rx bandwidth measurement and by the bias tee for the TX bandwidth measurement. However, the low-pass character of the O/E converter used for only the TX measurements somewhat limits the direct comparison of TX and system bandwidths without compromising the general conclusions. As can be seen, the bandwidths of these LEDs as transmitters alone should be sufficient for data rates of at least 1 Mbit s−1, even at low bias currents of 5 mA. The system bandwidth on the other hand depends strongly on the impedance of the receiver circuit. The LED operated as a receiver is typically the limiting element, since the system bandwidth LED to LED is typically lower than the transmitter bandwidth of one LED alone. This is true especially for the green LED showing a very low bandwidth when operated as a receiver, indicating that internal effects like carrier diffusion might influence the bandwidth additionally to the junction capacitance. The fact that the frequency response of the green LED consists of two low-pass functions supports this assumption. With low-impedance receiver circuits like a transimpedance amplifier, a data rate of up to a few Mbit s−1 should be achievable with the royal blue as well as with red LED systems. Furthermore, the bandwidth could be enhanced by using reverse bias voltage. This has not been tested so far, since the LEDs are not specified for reverse voltage.
Data rates of 1 Mbit s−1 have been shown in preliminary experiments, although the realized demonstrator in the next section requires only much lower data rates. For example, transmission experiments with the two red LEDs as TX as well as RX and a standard 1 mm POF have been made. Therefore a 1 Mbit s−1 pseudorandom binary sequence (PRBS) signal was transmitted and the eye pattern was recorded using a digital oscilloscope with 50Ω input impedance and 500 MHz bandwidth directly connected to the receiving LED (see Fig. 15). As can be seen, there is still potential for improvement in reach and bit rate. It is worth noting that these LEDs have not been designed as fast transmitters and even less as fast photo receivers, but to be cheap and efficient light sources in the first place.
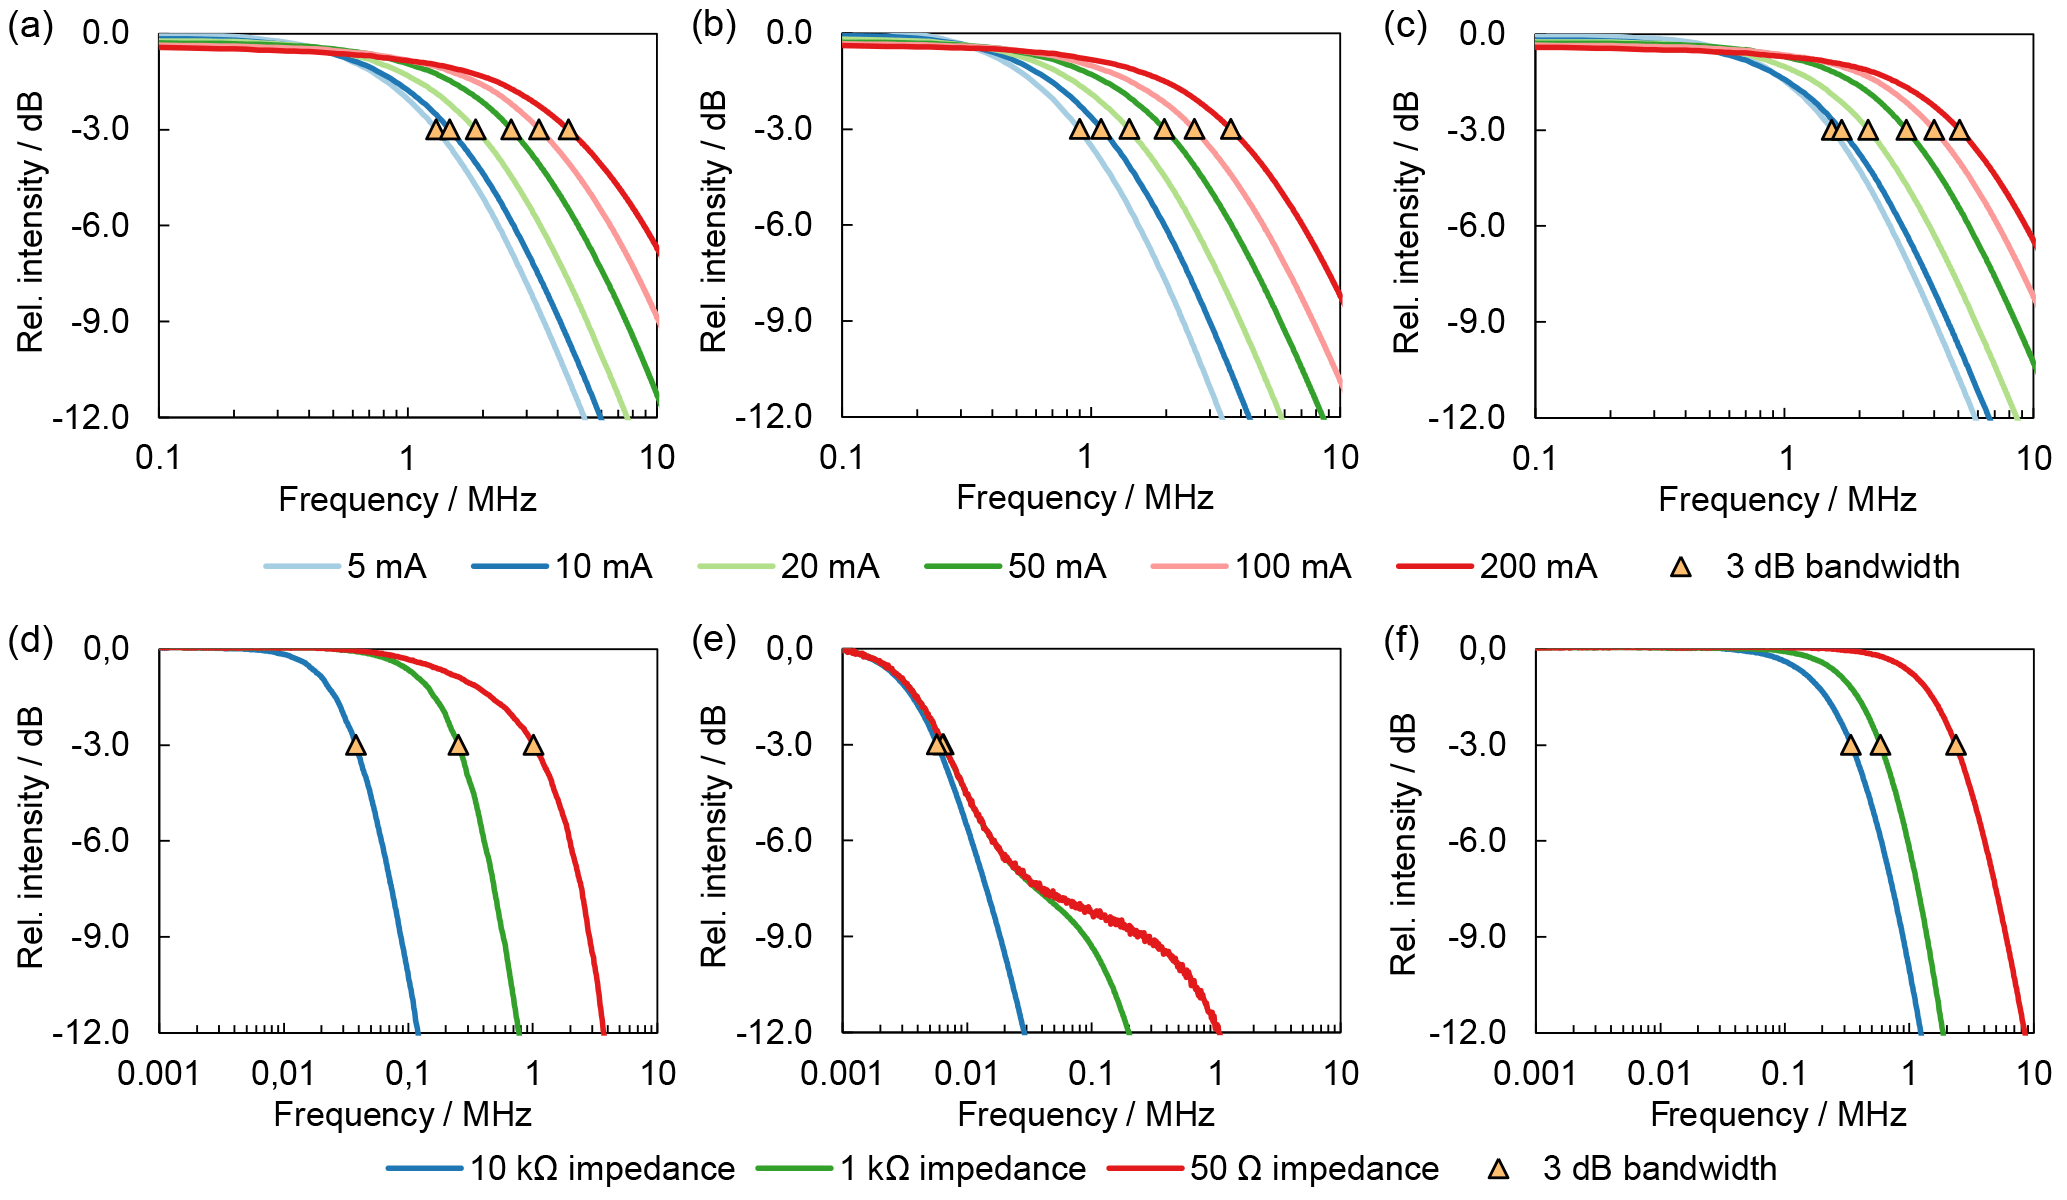
Figure 143 dB bandwidth of different LEDs as transmitter (Tx bandwidth) for different bias currents and of complete systems consisting of two LEDs of the same type (system bandwidth) for different load resistances: (a) Tx bandwidth – royal blue LED; (b) Tx bandwidth – green LED; (c) Tx bandwidth – red LED; (d) system bandwidth – royal blue LED; (e) system bandwidth – green LED; (f) system bandwidth – red LED.
Table 63 dB bandwidths of the different LEDs as transmitter and receiver.
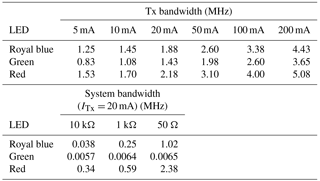
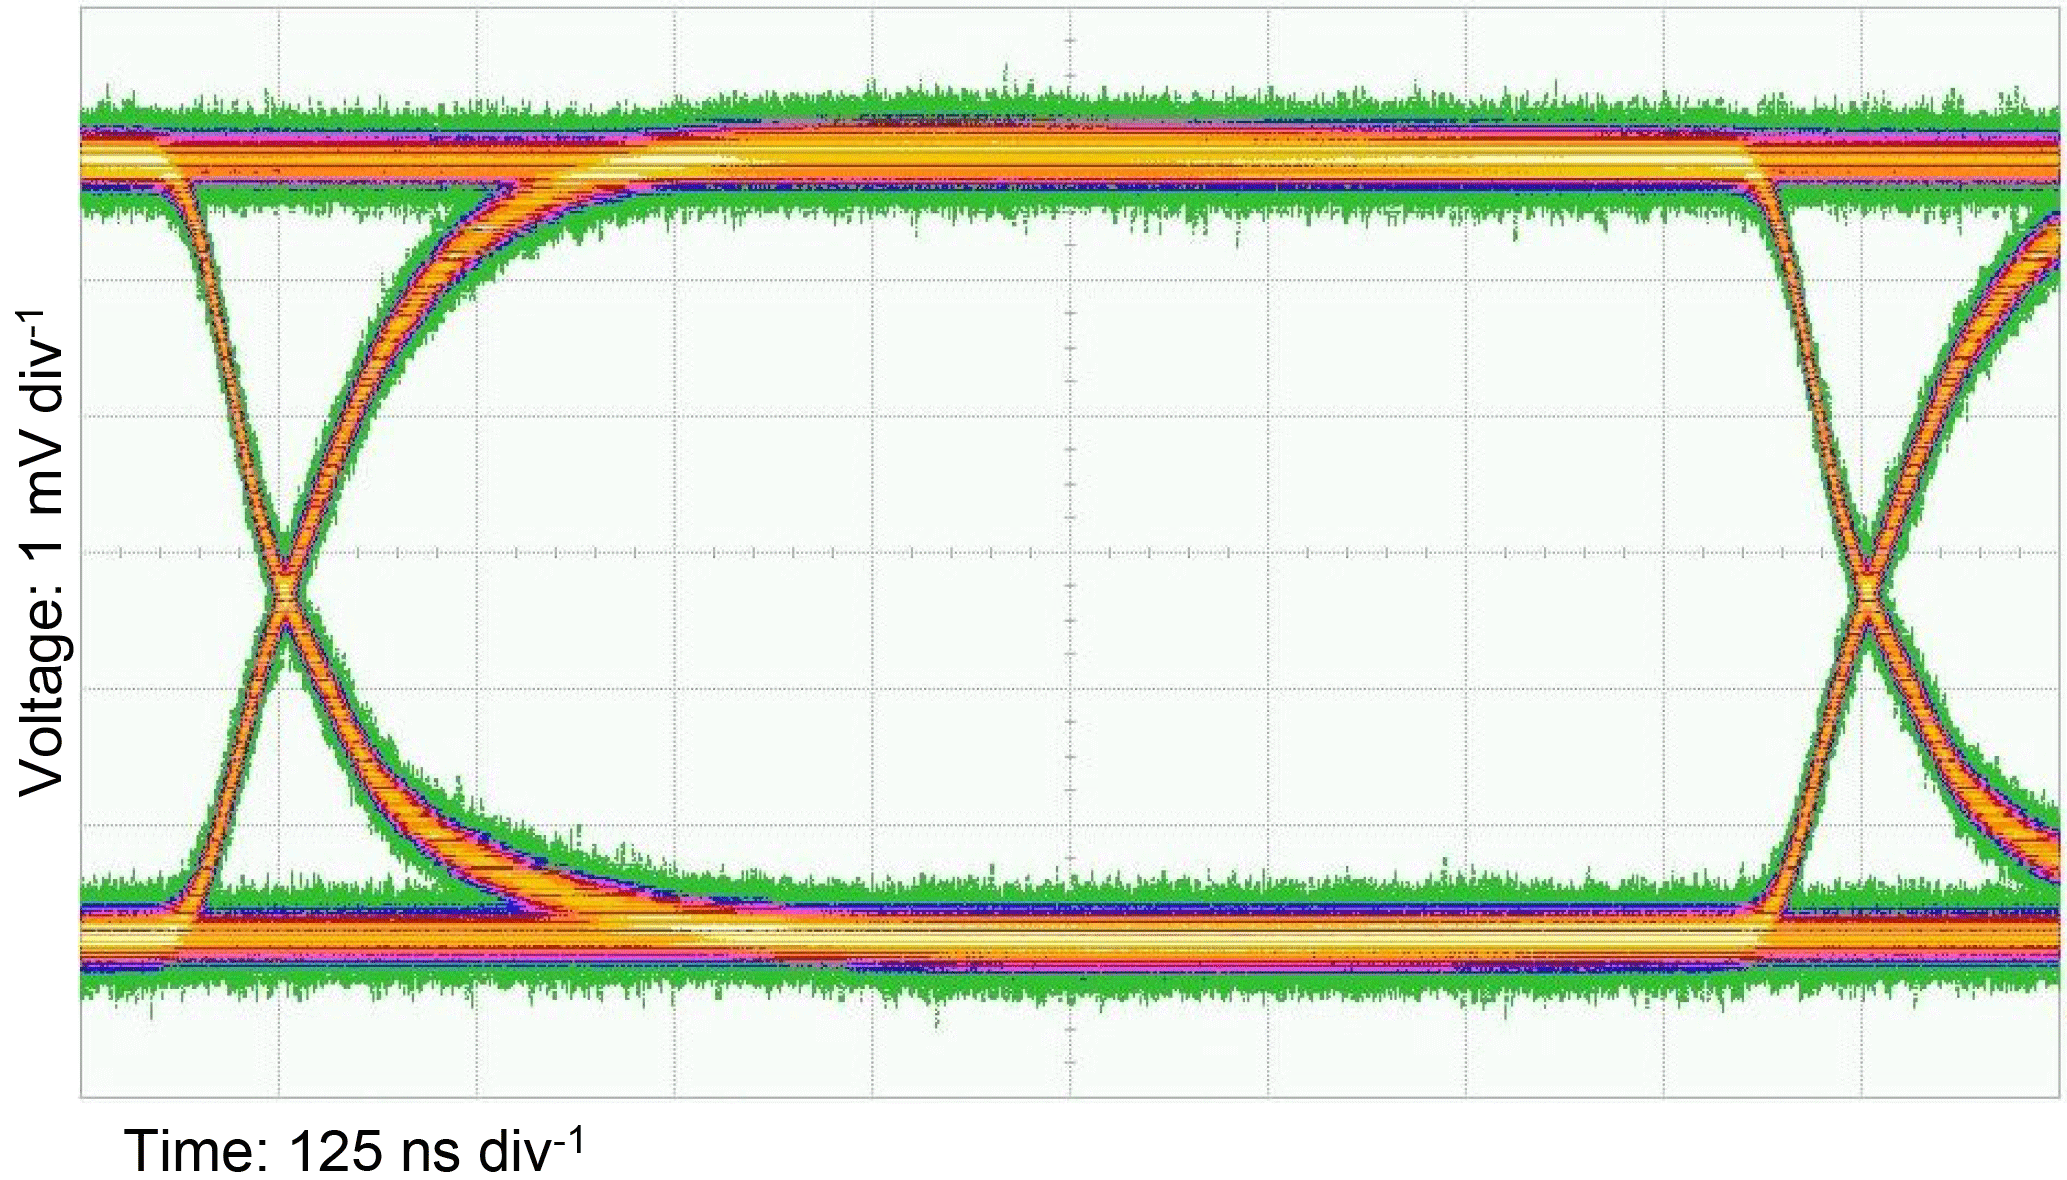
Figure 15Eye pattern for 1 Mbit s−1 PRBS data transmission with the two red LEDs as TX and RX over 1 m standard POF.
4.1 Sensor network principle and topology

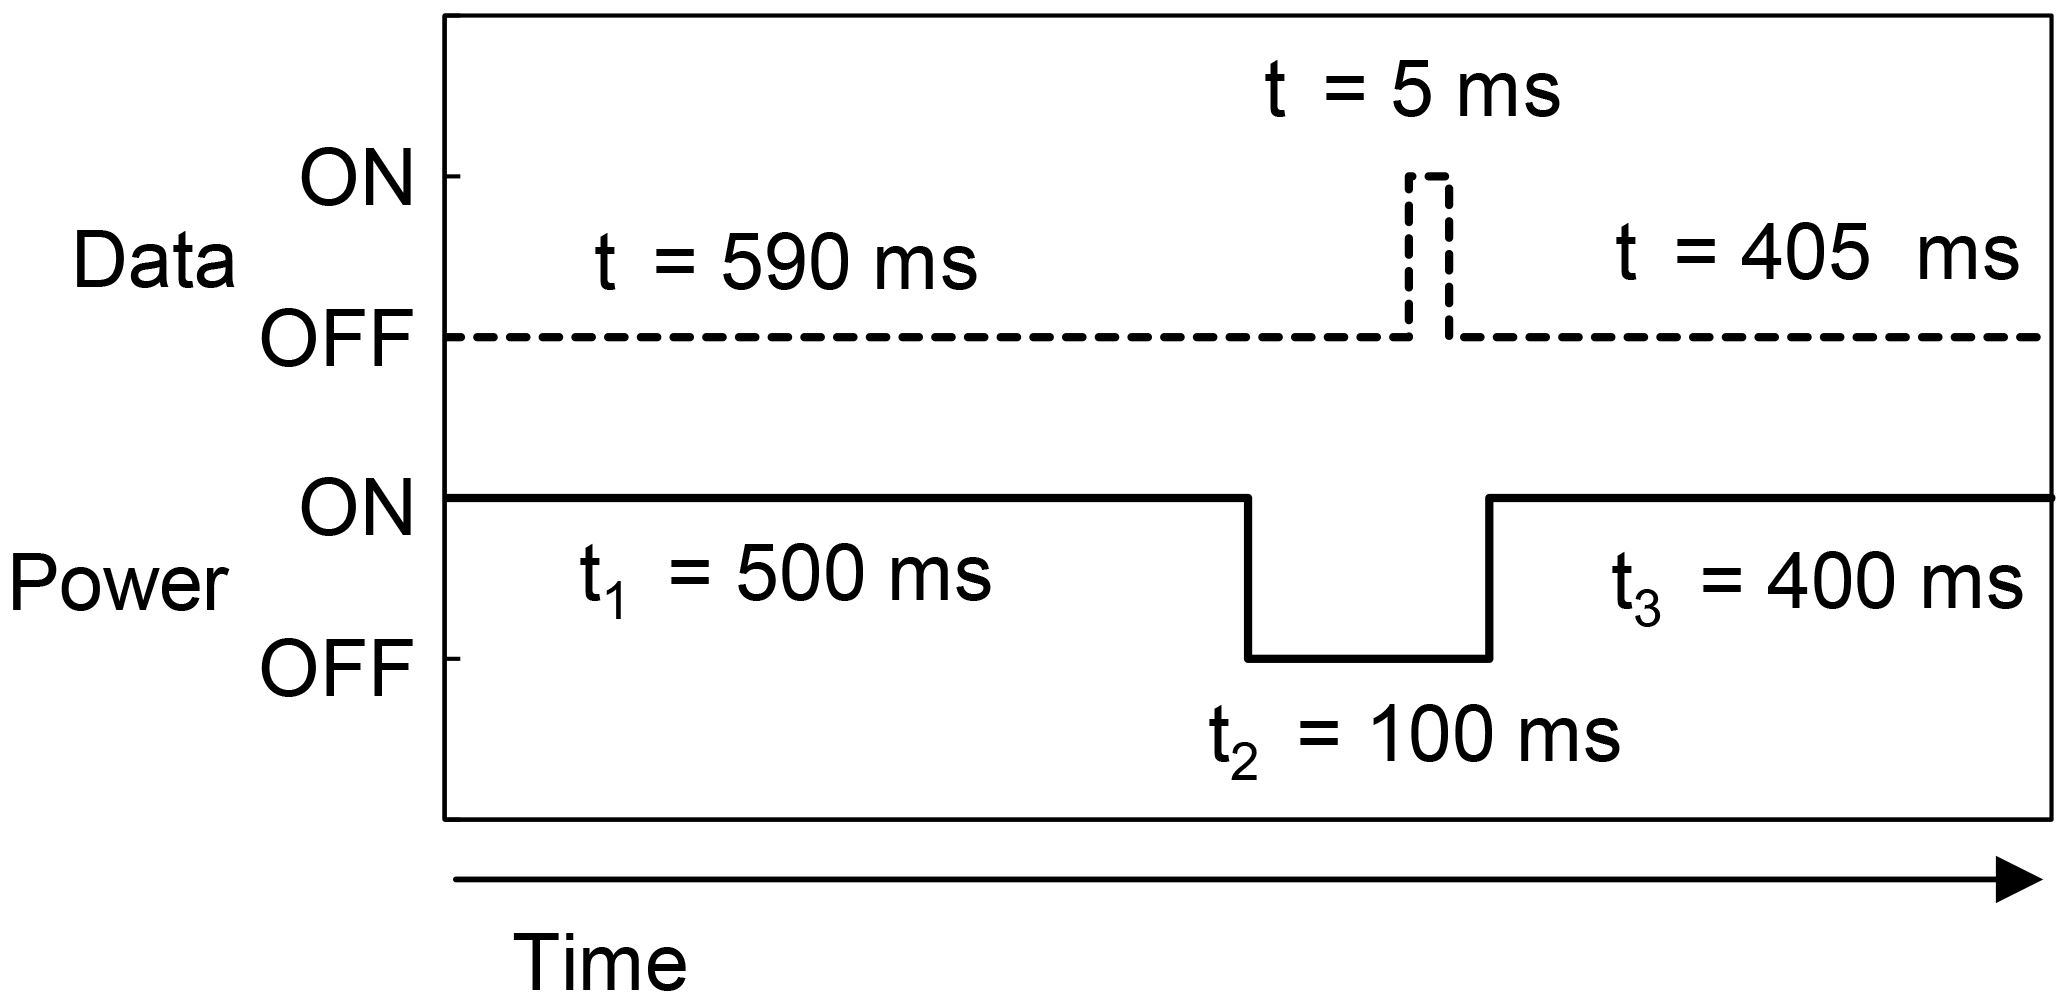
Using the results for the different LEDs from Sect. 3, the sensor network demonstrator was designed (Schuster, 2016; Schuster et al., 2016). The realized sensor network uses polymer optical fibers for power and data transmission and commercially available high-power LEDs as light transmitters as well as receivers. It consists of a central board and four sensor nodes in a star topology as shown in Fig. 16 using red LEDs (Cree XQ-E HI red), since these provide the highest transmitted electrical power and bandwidth. As each sensor node is connected to the central board via a single fiber only, the transmission of energy and data is implemented by a time division duplex (TDD) procedure. Therefore, energy storage at the sensor nodes is necessary to provide power during the time a sensor node sends back the sensor data, even if the required time for the data transmission is much shorter than the available time for powering. The timing diagram for TDD is shown in Fig. 17. At first the sensor nodes receive energy to charge themselves (time slot t1). Then the nodes perform measurements and send back the data (time slot t2). Afterwards, the central board powers the sensor nodes again (time slot t3). For the demonstrator a cycle time of 1 s has been chosen, although a faster readout is possible.
4.2 Central board
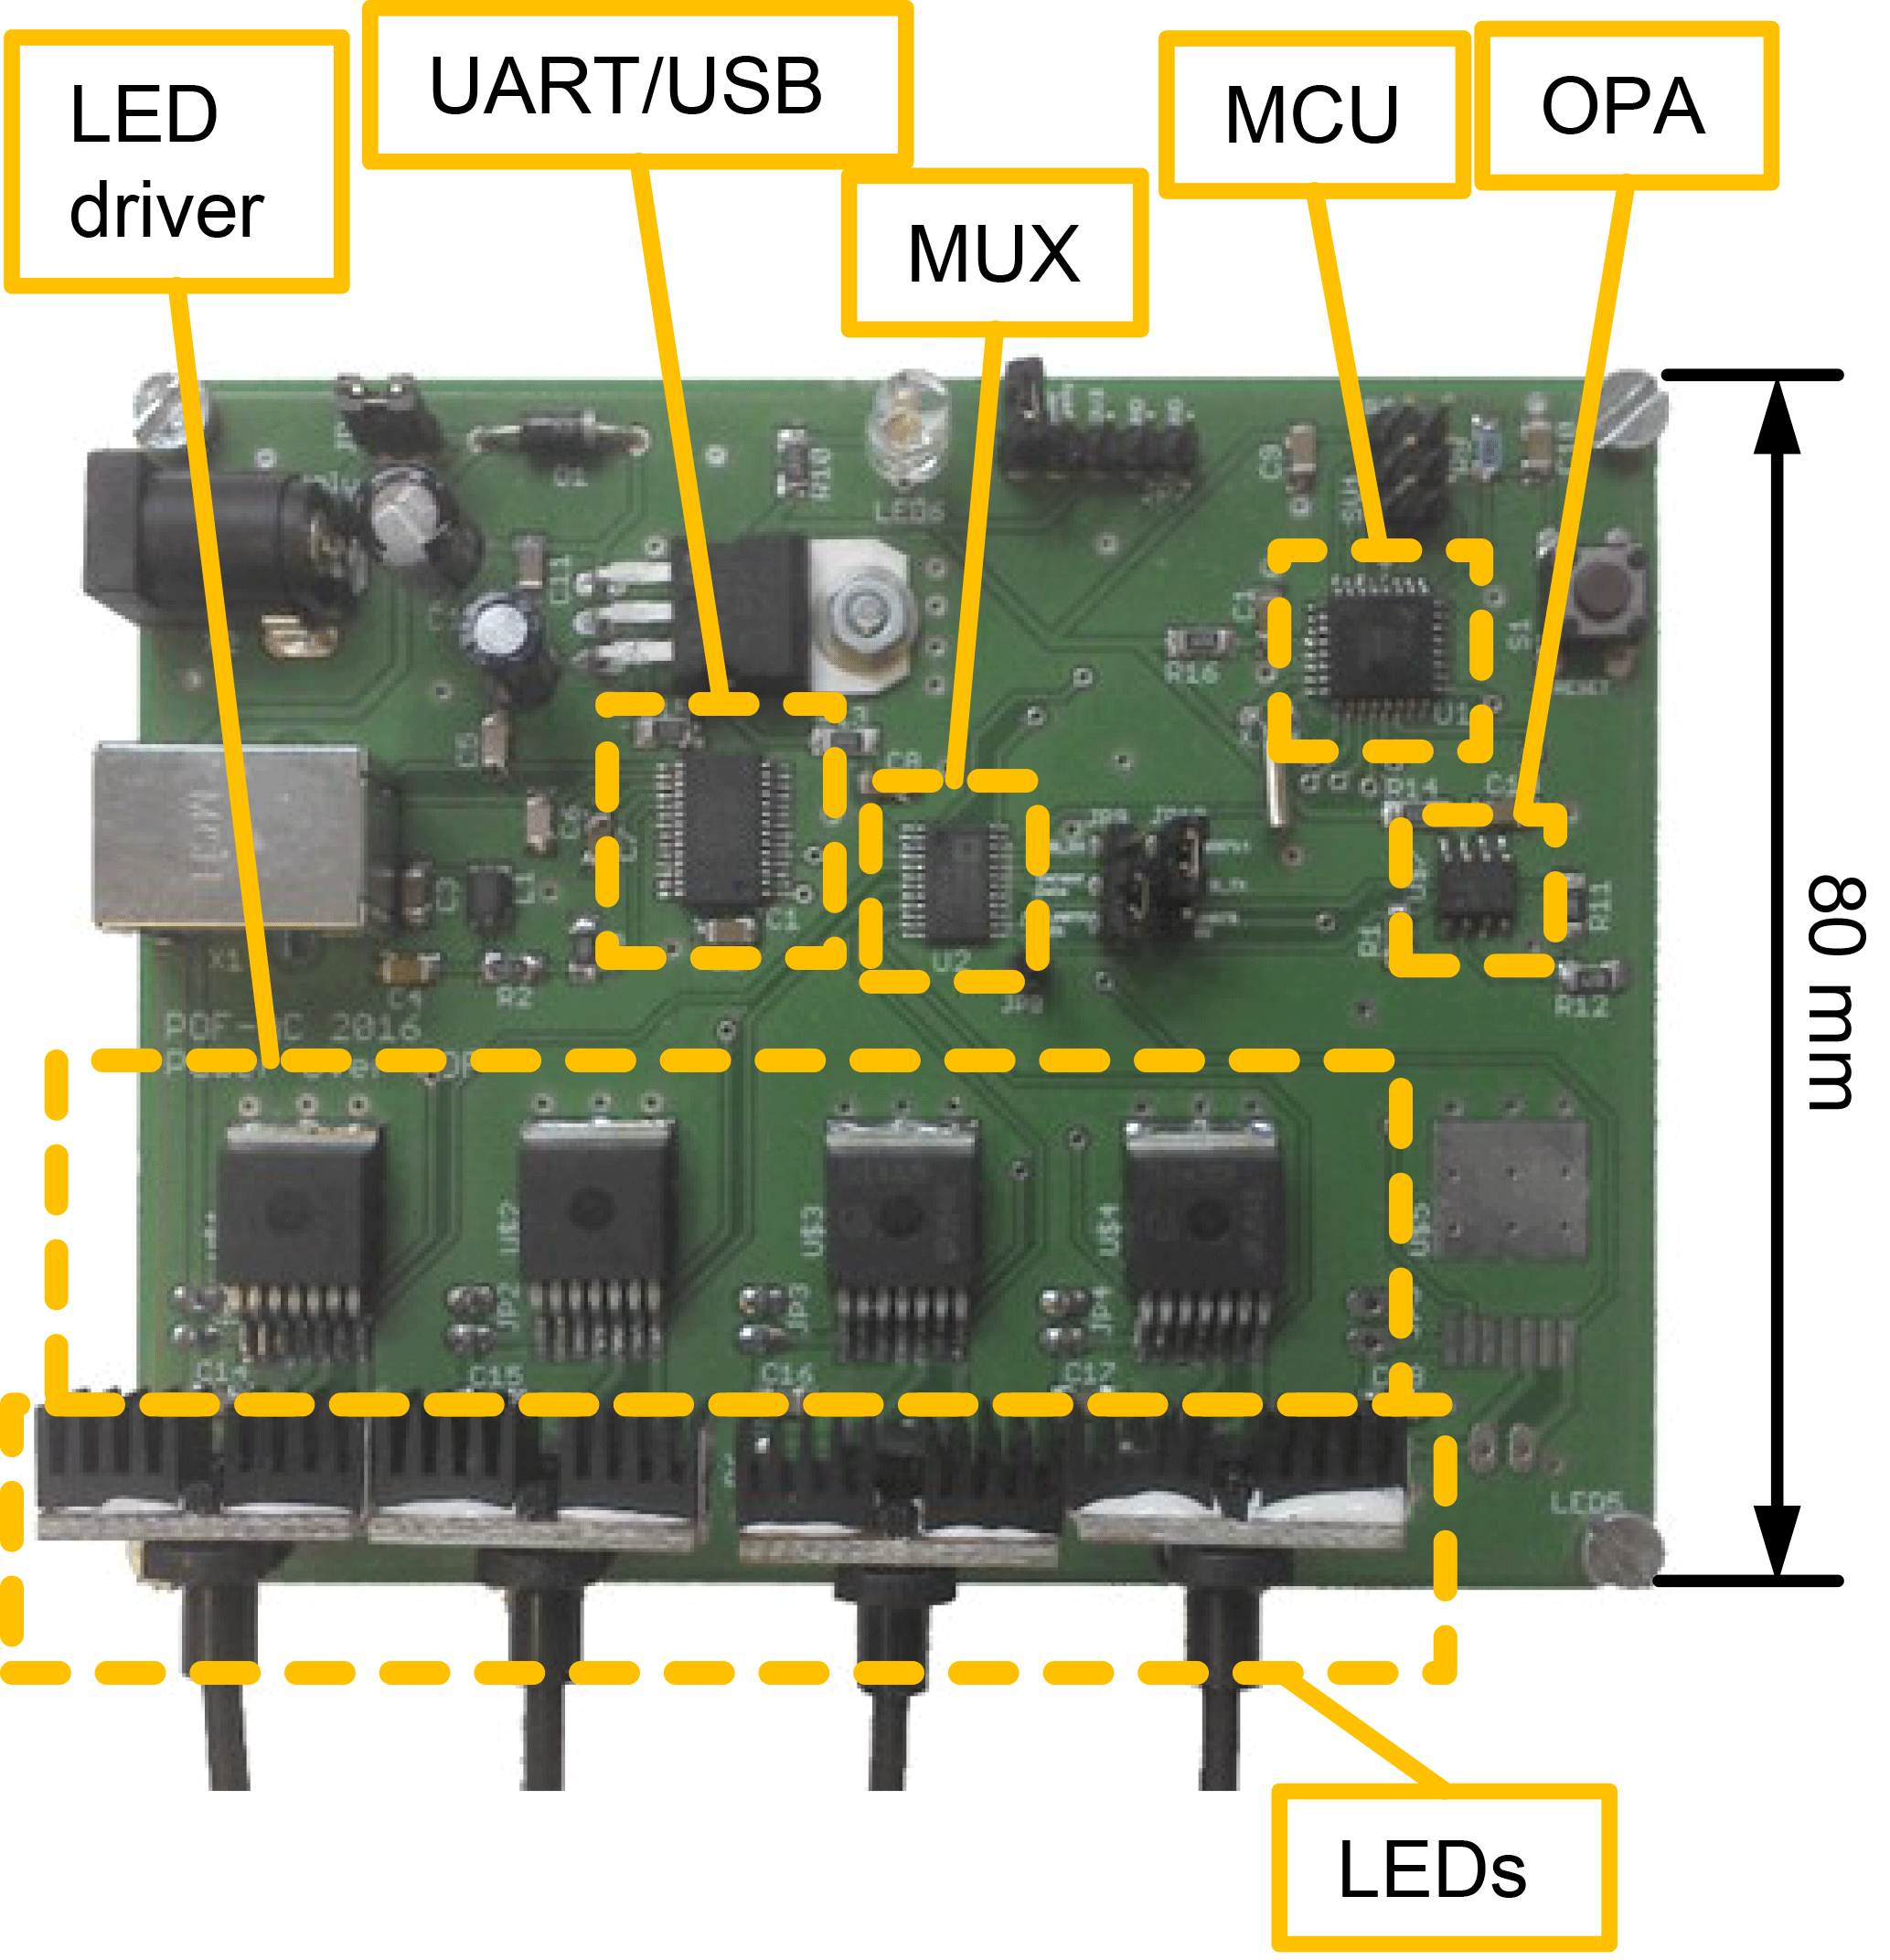
The central board powers the connected sensor nodes and receives the measurement data from the sensors. A block diagram is shown in Fig. 18. The key element is a microcontroller (MCU) “Kinetis MKL05” of NXP based on a ARM Cortex-M0+ architecture. To power the sensors the MCU controls the LED via a current driver using pulse-width modulation (PWM). Reception of the sensor data is realized by addressing the sensors one by one, stopping the supply of optical power for a certain time which triggers the microcontroller on the sensor boards to perform a measurement and send back data. During this time, the powering LEDs are used as a receiver for the sensor data. Serial data transmission is realized as a universal asynchronous receiver/transmitter (UART) at a rate of 9600 baud, sufficient for sensor data read-out here. By using an 8-fold switch (MUX), the currently receiving LED is toggled to a single operational amplifier, which in turn is connected to the UART interface of the microcontroller. This additional multiplexing is necessary since there is only one UART communication interface available on the selected MCU. Finally, the data are sent to a connected PC using a UART/USB converter. Figure 19 shows the realized PCB for the hardware of the central board.

4.3 Sensor nodes
Four different sensor nodes have been built for the demonstrator. Each node uses a microcontroller (MCU) to read out the data from different electronic sensors connected to the sensor nodes via an electronic I2C interface and to send the data back optically to the central board. The block diagram of the sensor node is shown in Fig. 20.

To perform a data transmission, the sensor board must have been charged previously by the received optical power from the central board, previously. An energy harvester chip (“bq25570” from Texas Instruments) is used to charge a 22 mF supercapacitor with the photocurrent generated by the LED by an internal boost charger and a maximum charged voltage of 5 V. Furthermore, the same energy harvester chip provides the supply voltage of 3.3 V for all consumers on the board with an integrated and adjustable step-down converter (Fig. 21).
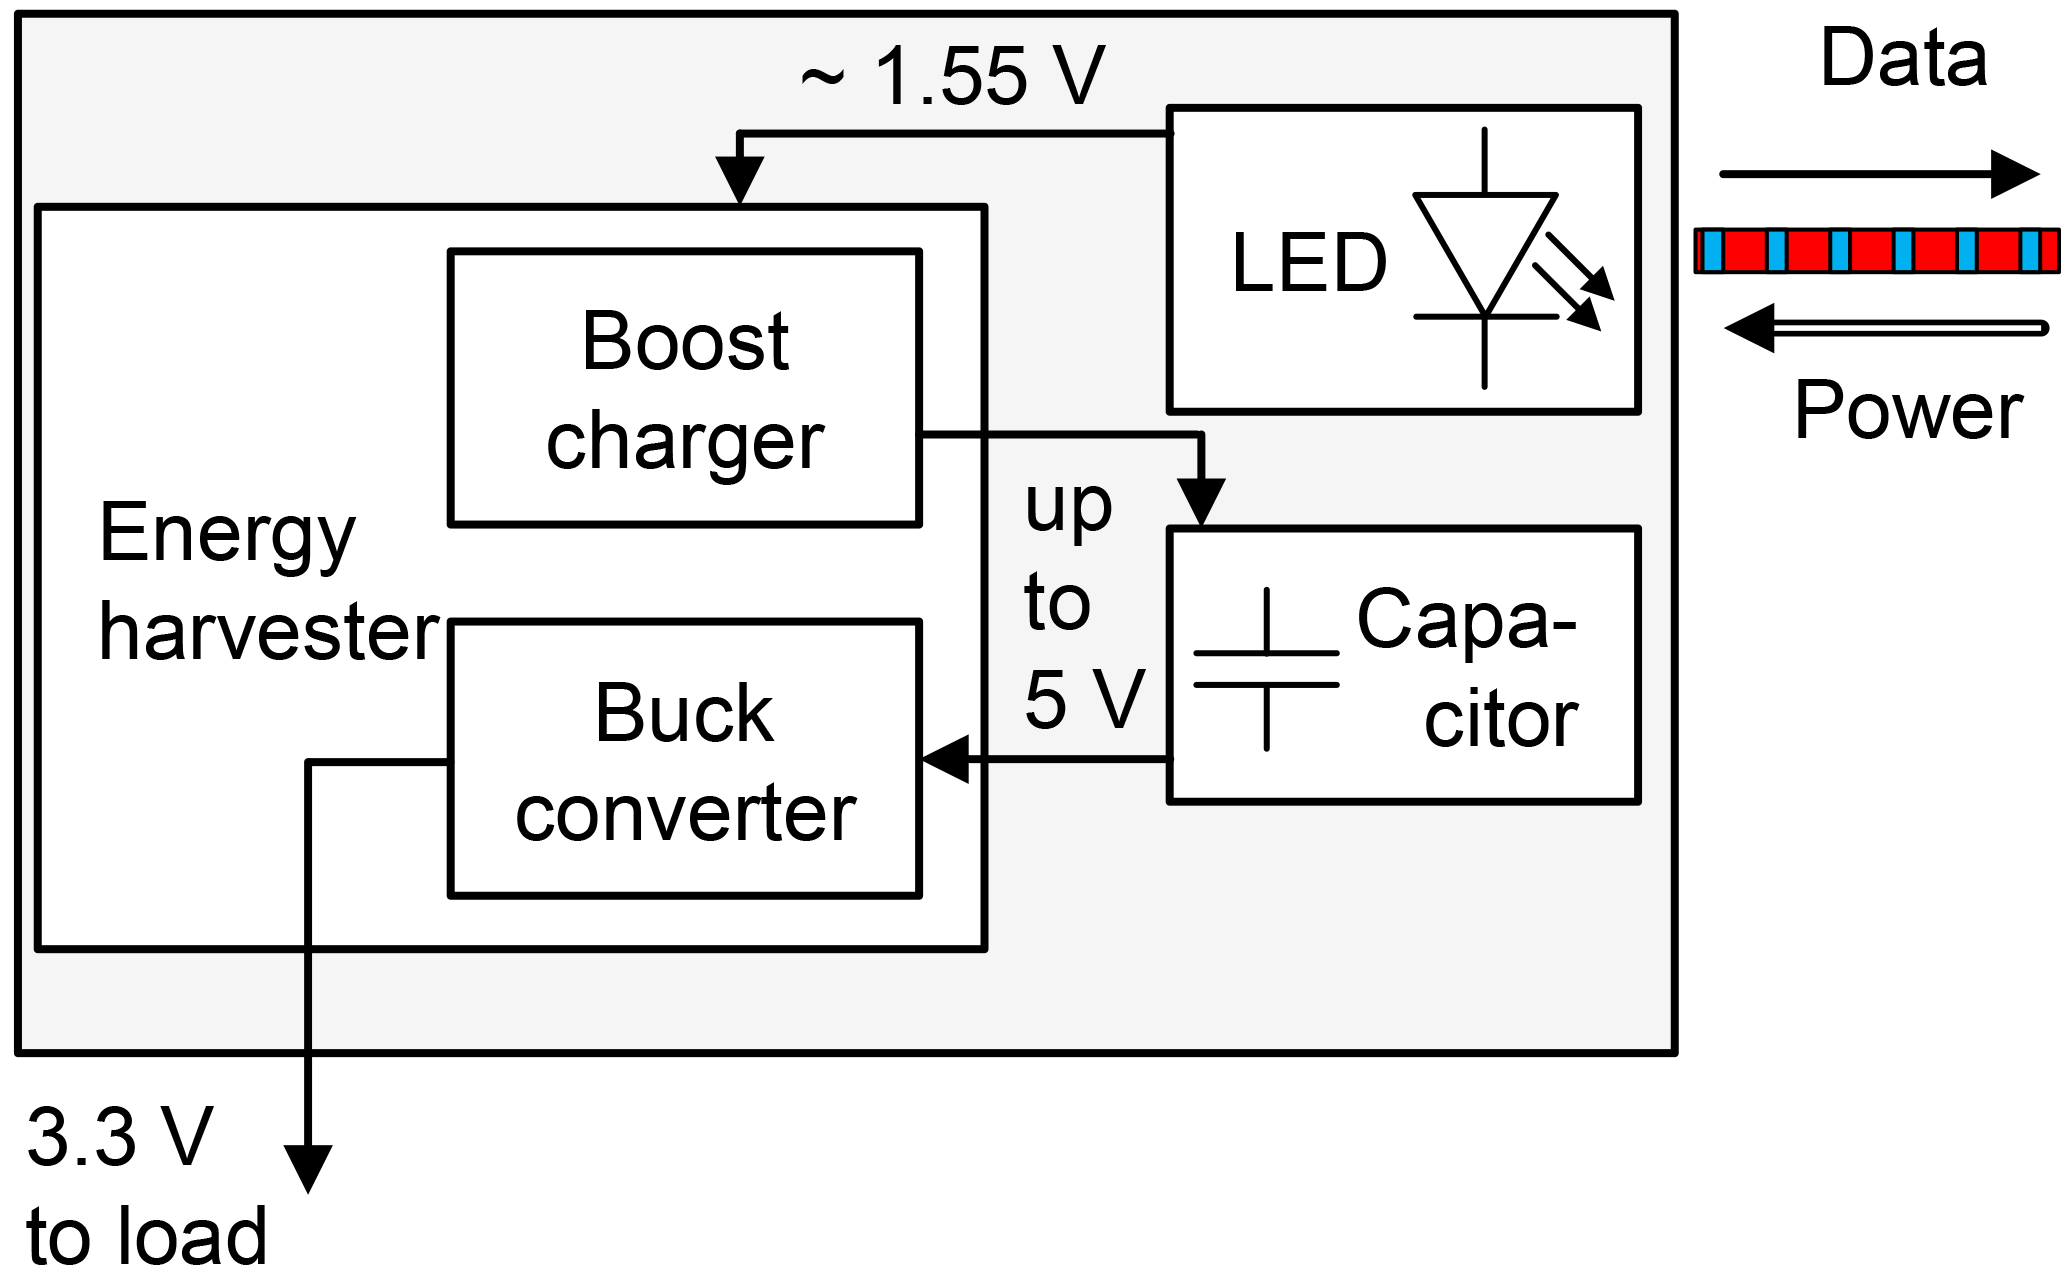
Figure 21Block diagram of the energy harvester consisting of the energy harvester chip, the LED and the capacitor.
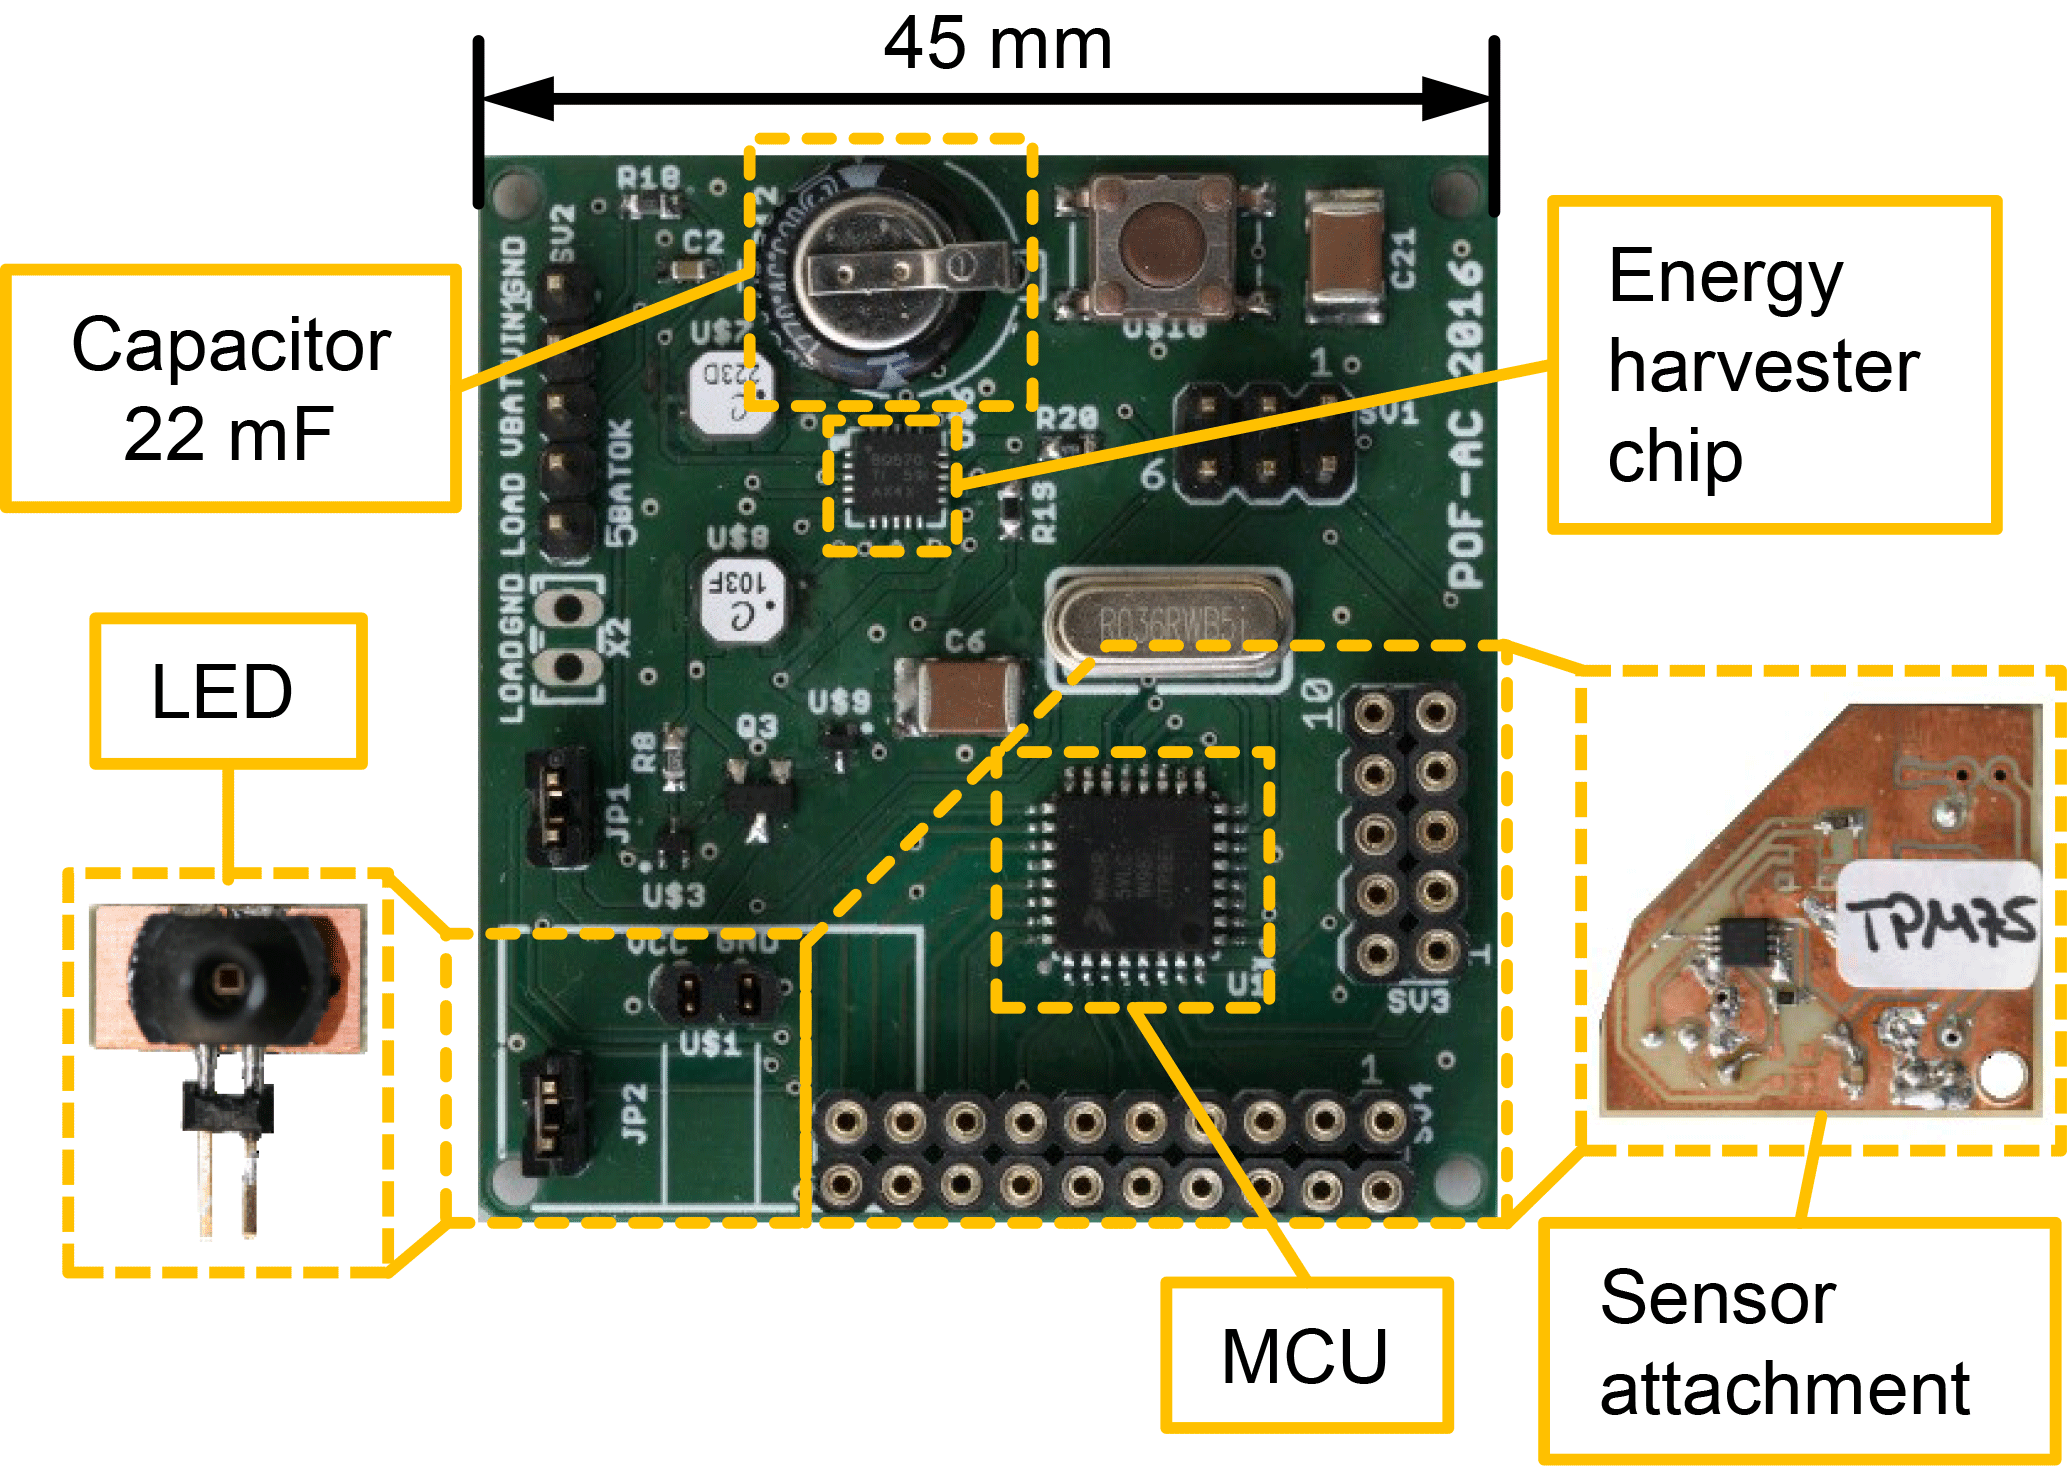
Figure 22Sensor board hardware setup (TMP75): the sensor attachment is a prototype board containing the different sensors and is connected to the sensor node using the contacts around the MCU.
The microcontroller is the same as on the central board (MKL05). The reasons for using this MCU are its available different low-power modes. As soon as the harvester supplies the microcontroller with the required 3.3 V, it boots and then switches into a stop mode (VLPS). For this mode, the current consumption of the controller is only at 2.25 µA, enabling further charging of the sensor node. When the power LED on the central board is shut off, the microcontroller recognizes an interrupt and switches to another mode to perform the measurements and send the data to the central board. In this mode the current consumption of the MCU is still below 243 µA (Freescale, 2014). Since the LED on a sensor node is alternatively a power receiver as well as a data transmitter, a field-effect transistor (FET) controlled by the microcontroller is used to switch the LED between these two modes. Any electronic sensor with a standard I2C interface is suitable for connection with these sensor nodes. The only limitation is the total power consumption required for the sensor itself, the microcontroller and the data transmission. It must be lower than the maximum power provided by the energy harvester for the time of sensing and data transmission. The layout for the sensor nodes is the same for all sensor types. Only a small adaptor board has to be changed, depending on the sensor used. As an example the circuit board for the temperature sensor is shown in Fig. 22. For this demonstrator the following four different sensors were used.
-
A temperature sensor (TMP75)
Range: −40–125 ∘C
Resolution: 0.125 ∘C
-
An atmospheric pressure sensor (MS5637)
Range: 10–2000 mbar
Resolution: < 0.11 mbar
-
A relative humidity sensor (SHT21)
Range: 0–100 %RH
Resolution: 0.04 %RH
-
A photoelectric sensor (TCST2103)
Range: open–closed
The precision and accuracy of the used sensors are defined by the manufacturer specifications and are not discussed here. These examples demonstrate the versatility of our approach, which enables almost any electronic sensor to operate electrically isolated with an economic solution.
4.4 Demonstrator parameters
Finally, the operational parameters of the realized demonstrator are discussed. The time until the sensor node is fully charged and ready for measurements after turn-on of the system depends on the fiber length which connects the sensor nodes to the central board, and the residual charge in the capacitor. The capacitor keeps a residual charge above 2 V for several days, enabling a faster wake-up after this time compared to a completely discharged sensor node. For the demonstrator described above, the following parameters are achieved.
-
Measurement cycle time per sensor: 1 s
-
Maximum fiber length: 10 m of a standard 1 mm PMMA POF
-
Time until sensor is ready after initial turn-on (1 m fiber): 131 s (cold-start operation), 17 s (capacitor charge: 2 V)
-
Up to 120 measurements possible even without optical powering of the sensor nodes (capacitor charge: 5 V)
This illustrates just a first realization with much potential for more frequent sensor read-out or faster data rates, and fewer start-up times by using ultra-low-power electronics.
Optical powering over fibers is a well-established technology. The transmission of several watts of electrical power is possible with near-infrared laser diodes, glass fibers and optimized converters. The use of LEDs in combination with large diameter and high NA polymer optical fibers can expand the field of application to low cost and high volumes. A particularity elegant solution is the use of high-brightness visible LEDs as transmitters as well as converters, alternatingly. This allows us to reduce the number of specialized electrical components and to use a single fiber without splitters. A disadvantage of this approach is the limited mutual responsivity of the LEDs. However, an electrical power of almost 10 mW can be provided, more than sufficient for the use of low-power electronics. Transmission bandwidths on the order of 1 MHz are possible with selected LED pairs over a few meters of POF, enabling fast data transmission with rates of 1 Mbit s−1.
In a first demonstration we have successfully proven the operation of a sensor network in star topology, equipped with pairs of red power LEDs as light sources and detectors. Moreover, we have shown that LEDs with other visible wavelengths can also be used as converters and receivers with surprisingly good parameters. Gallium nitride (GaN) based blue LED may offer advantages in the temperature stability and lifetime (Wun et al., 2012) as well as in higher direct output voltages. In the next steps we plan to realize sensor links operating at shorter wavelengths than red. The reduction of the sensor power consumption, increase in the possible data rate and improvements in the energy harvesting process are also under consideration. These investigations are planned in cooperation with Avago Technologies GmbH, a Broadcom Limited Company. Further improvements can be achieved by implementing dielectric tapers for LED–POF coupling, which has already been shown by Lange et al. (2015).
The underlying measurement data are not publicly available and can be requested from the authors if required.
The authors declare that they have no conflict of interest.
This article is part of the special issue “Sensor/IRS2 2017”. It is a result of the AMA Conferences, Nuremberg, Germany, 30 May–1 June 2017.
Parts of this work have been funded by the Staedler-Stiftung within the
project “OSALED – Optische Sensor-Anbindung mit Leuchtdioden”.
Edited by: Bernhard Zagar
Reviewed by: two anonymous referees
DeLoach, B. C., Miller, R. C., and Kaufman, S.: Sound Alerter Powered Over an Optical Fiber, Bell Syst. Tech. J., 57, 3309–3316, https://doi.org/10.1002/j.1538-7305.1978.tb02205.x, 1978. a
Fischer, J., Schuster, T., Wächter, C., Luber, M., Vinogradov, J., Engelbrecht, R., and Ziemann, O.: Electrically Isolated Sensor Networks Using Single Polymer Fibers for Remote Powering and Data Transmission, Sensor 2017, Nürnberg, Germany, 31 May 2017, https://doi.org/10.5162/sensor2017/B3.3, 2017. a
Freescale Semiconductor: KL05P48M48SF1 Rev 4 data sheet, NXP Semiconductors, available at: http://www.nxp.com/assets/documents/data/en/data-sheets/KL05P48M48SF1.pdf (last access: 7 February 2017), 2014. a
HAMAMATSU PHOTONICS K. K.: S3590-08/-09/-18/-19 Si PIN photodiode data sheet, Solid State Division, available at: http://www.hamamatsu.com/resources/pdf/ssd/s3590-08_etc_kpin1052e.pdf (last access: 9 February 2017), 2012. a
Katsande, M. P., Kalymnios, D., Steers, E., Faulkner, D., and Cockburn, A.: A LED as emitter and detector for bi-directional communication over a single POF, in: Proceedings of the 7th Intern. POF Conference POF'1998, Berlin, Germany, 127–129, 1998. a
Klüher, J., Englert, P., Urbanek, P., and Ziemann, O.: Powered over POF sensors: Level measurement, in: Proceedings of the 24th Intern. POF Conference POF'2015, Nürnberg, Germany, 22–24 September 2015, 115–120, 2015. a
Lange, V., Kopf, B., Storm, S., and Hönl, R.: Efficient Symmetric Led-POF Coupling, in: Proceedings of the 24th Intern. POF Conference POF'2015, Nürnberg, Germany, 22–24 September 2015, 95–98, 2015. a, b
Mims III, F. M.: LED Circuits and Projects, Howard W. Sams & Co., Inc., New York, NY, USA, 1973. a
Peña, R., Algora, C., Matías, I. R., and López-Amo, M.: Fiber-based 205-mW (27% efficiency) power-delivery system for an all-fiber network with optoelectronic sensor units, Appl. Opt., 38, 2463–2466, https://doi.org/10.1364/AO.38.002463, 1999. a
Poisel, H., Ziemann, O., Fischer, J., and Luber, M.: Power over Polymer Optical Fiber –An Overview, in: Proceedings of the 22nd Intern. POF Conference POF'2013, Rio de Janeiro, Brazil, 11–13 September 2013, 317–321, 2013. a
Schuster, T.: Entwicklung eines optisch ferngespeisten Sensornetzwerks, Masterthesis, TH Nürnberg Georg Simon Ohm, POF-AC, Germany, 2016. a, b
Schuster, T., Fischer, J., and Ziemann, O.: The use of high power LED as photo converters and optical receivers in low speed POF sensor networks, in: Proceedings of the 25th Intern. POF Conference POF'2016, Birmingham, United Kingdom, 13–15 September 2016, 225–259, 2016. a
Snyder, A. W. and Love, J.: Optical Waveguide Theory, Kluwer Academic Publishers, Norwell, MA, USA, 2000. a
Wächter, C.: Übersicht der Eigenschaften kommerziell verfügbarer High-Power LEDs für Energy Harvesting und optischer Daten- und Energieübertragung, Masterthesis, TH Nürnberg Georg Simon Ohm, POF-AC, Germany, 2017. a
Werthen, J. G.: The Power of Light, Laser+Photonik 2/2006, 62–65, 2006. a, b
Werthen, J. G.: Powering next generation networks by laserlight over fiber, Technical Digest (CD) of The Opt. Fiber Communication Conf. and Exposition and The National Fiber Optic Engineers Conf., San Diego, CA, USA, 24–28, February, 2008. a
Wun, J.-M., Lin, C.-W., Chen, W., Sheu, J.-K., Lin, C.-L., Li, Y.-L., Bower, J. E., Shi, J.-W., Vinogradov, J., Kruglov, R., and Ziemann, O.: GaN-based miniaturized cyan light emitting diodes on a patterned sapphire substrate with improved fiber coupling for very high-speed plastic optical fiber communication, IEEE Photonics J., 4, 1520–1529, https://doi.org/10.1109/JPHOT.2012.2210867, 2012. a
Ziemann, O., Krauser, J., Zamzow, P. E., and Daum, W.: POF Handbook: Optical Short Range Transmission Systems – 2nd Edn., 2, Springer Berlin Heidelberg, Berlin Heidelberg, Germany, 2009. a